Abstract
Adding personal perceptions to manufacturing engineering can be very challenging, especially when engineering-based methods are used to make artisans understand the designer's ideas. Unfortunately, the two-dimensional engineering definition can be extremely time-consuming for individuals who lack creativity or imagination, and model-based definition would be incapable of breaking the separation between the virtual space and the real world, which makes the interaction between natural persons exist spatial perception error. The emergence of Augmented Reality (AR), which allows individuals to perceive the intentions and strategies of the designer with visual cues that are attached to actual objects, fills this gap. In this paper, augmented engineering definition (AED) is proposed to enhance the information exchange between natural persons in a succinct, accurate and acceptable form of visual impression. Motivated by visual representation in remote collaboration, the specific empathy scenario bases on the AED design, which leads to the establishment of a mapping relationship between the visual cues and the augmented information. An inquiry had been conducted by involving participants who were paired up for the parts’ inspection, interacting via 2D visualization data only, interaction with 3D projection data, interaction with 3D visualization data, AED-based communication. The experimental results showed that participants with AED exhibited higher situational appeal and information understanding than using three other interactions. Besides, we discussed the feasibility of using AED in a collaborative manufacturing environment and the impact on AED users.
Keywords: Manufacturing, information communication, augmented engineering definition, visual representation, empathy
1. Introduction and motivation
Text and symbols are the primary means to support the exchange of information between natural persons. They combine people's attributes (such as sight, smell, hearing, taste, touch) to express people's advanced ideas. Advanced concepts describe ideology and information expressed through humans. Therefore, if there is no empathy, people's views will not be appreciated by others.
Two-dimensional engineering definition (2D-ED) and model-based definition (MBD) are two typical methods of visual impression. 2D-ED engineering drawings define what someone is to do and how to do it [1]. They considered as a realistic universal language idea is to give the recipient information easy to resonate through the projection method [2]. Although solid modeling is generally considered to be the primary means of engineering information exchange at this stage, engineering drawings used in some production practices. From a technical point of view, sponsors can use a widely accepted visual impression to convey information to recipients to achieve empathy.
The CAD model can be directly inserted into the visual process data for information exchange to form the so-called MBD (model-based definition) dataset [3]. The MBD replaces the 2D-ED so that the visual information can be greatly developed in 3D space, thus improving the understanding of information among natural persons, reducing the product delivery cycle and reducing the cost [4,5]. It is worth noting that, until today, the traditional definition of two-dimensional engineering has not been completely abandoned [6]. This reflects the dilemma of the industry's development, namely how to present easy-to-understand manufacturing information in the physical space [7].
Augmented Reality (AR) is an innovative Human-Computer Interaction (HCI) technology [8] that has the potential to solve empathy. It interacts with real objects using virtual objects embedded in the real world, greatly enriching the user experience in the real world [9]. In such an augmented environment, the initiator can effectively utilize the real scene and the virtual optical cues to express his behavior to the receiver [10,11]. However, the overwhelming majorities of the existing visualization-based AR collaborative systems exclusively emphasize better tracking methods or display content than the past while neglecting the expressive force in the initiator’s idea and the sublimation of the receiver’s volitions.
Empathy is often referred to as being able to detect the feelings of others and establish your own feelings of emotion [12]. It will potentially initiate ethical reasoning [13], sustain goal-oriented self-esteem, interpersonal tolerance and abide the treatment system [14]. Beyond this, empathy plays an important role in improving the human relationship [15], stimulating cooperative competence [16], and restraining the negative factors in interpersonal communication [17].
This paper is under the framework of augmented visualization, interaction and empathy design, and our work is motivated by the sharing collaboration [18] and the visual representation for physiological cues [12], a real-time concept in optical cues sharing, and empathy extraction and expression based the visual representation approach. According to studies described in [12,18], individuals’ empathy has shown great advantages in improving interpersonal communication, improving work efficiency, and maintaining users' higher concentration. However, the user's cognitive process has no scientific definition of the visual display rules in the empathy expression. Our idea is to propose an augmented engineering definition (AED) by analyzing AR-based visual guidance methods. AED inherits the advantages of the above two methods and uses pre-designed optical cues to make information exchange between people more efficient and natural.
Before explaining this novel idea, we would like to introduce the related works for supporting AED using empathy in Section 2. In Section 3, visual impression assumptions based on 2D-ED, MBD, and AED are proposed. In Section 4, the empathic visualization system framework and execution strategies of the AED-based mechanical inspection system are discussed. In Section 5, we will present the results of the inspection system and discuss the relationship between the visual impression model using empathy and work efficiency. In Section 6, we analyze in detail the research findings we have obtained and point out the problems we have in our current work. Finally, we give the conclusion of our research in Section 7 and point out our future work direction.
2. Supporting AED using empathy
2.1 Visual content and visual form
Ideological patterns hidden behind the advanced conceptions require a natural and comprehensible rule to convey the initiator’s intentions and strategies to the receiver. How to form a set of effective rules of ideological patterns is the focus of this paper. According to the mapping relation mentioned above, the empathic visualization of information communication in this paper mainly involves two aspects: visual content and visual form. In the 2D-ED and MED, the visual content used to express the model and its spatial information should be kept. In addition, we should abandon those confusing visual content and propose new content suitable for empathy. Considering with the specific requirements of visual form, the visual information produced by the initiators often has a strongly personal tendency, and it will be an urgent demand problem that how to pass people's thoughts in a receptive way to receiving people. For the recipient to correctly understand the intentions of others, the initiator sets an acceptable visual form for empathy, which should meet the configuration requirements of the new environment. These requirements are the same as the communication protocols and semantic logic rules under computer data transmission.
2.2 How does empathy and visualization affect information communication?
Visualization uses graphics, image processing and aesthetics to transform information into highly acceptable and more intuitive visualizations for display and interaction. Currently, several AR interfaces have been developed to apply visual methods to a range of situations [19,20]. However, merely satisfying the information display is not enough, which makes some researchers [21] begin to pay attention to the role of emotional cues in information expression. These reports on human communication led to the birth of a concept called “empathy” that has been shown to influence how people interact and how people communicate with each other. In addition, some literatures [22-24] even apply empathy to VR and AR environments and obtain information feedback by obtaining emotional clues. These results show that visualization affects the expression of information and personal communication habits, and empathy plays a crucial role in the multi-interaction and multi-objective interpersonal relationships. To determine how visualization and empathy affect our current information exchange/communication, a set of scholars have done some specific researches.
Coleman et al. [25] have adopted a novel design concept of ergonomics with adding empathy experience, thus effectively improves the availability and acceptability of industrial products. They integrate design philosophy and empathy concept to fit the destination that the soul of the designer is joined with the soul of the user. Kouprie et al. [26] propose an empathic design framework for giving insight into what role the designer's own experience can play when having empathy with the user. This paper emphatically discusses how to apply the empathic design in research activities, communication activities, and ideation activities, and expounds the positive effect of the resulting. Starting with the user-experience in Human-Computer Interaction, Wright et al. [27] treat empathy as a characteristic of designer-user relationships. This paper proposes some empathy-experience methodologies to link designers, users, and artifacts effectively. Thomas et al. [28] explore the role of empathy in new product development from the perspective of human-centered design, and empathic design tools. Their strategies have been developed to identify authentic human needs. Mattelmäki et al. [29] describe a construction of empathic design interpretation method, which shows how to change the idea of empathy into a long-term plan. This plan’s evolution indicates how the ideological roles of both designers and users have exchanged, as well as how the designer's task has transformed from design philosophy to cover rich domains, e.g., public service organization network and service development.
Also, some articles extend the concept of empathy to many fields, such as natural sciences, social activities, engineering and technology, so that people can expect the results to be fed back with reasonable visualization methods.
Carrier et al. [30] have introduced the “virtual empathy” to try revealing the nature of the relationship between network usage and empathy. In the form of questionnaires, they collected feedback on daily media usage, empathy, virtual empathy, social support, and demographic information about youths. The result of the importance in face to face communication shows that the online can’t replace face-to-face and is unable to reduce the real-empathy, which implies a lack of nonverbal cues in the network world will result in the virtual overall lower level of empathy comparing with the real. Kumar et al. [31] created a delightful experience based on empathy and visualization for prompting designers to embrace empathy to reach consensus on the needs of users. This paper has shared a case study that illustrates the power of empathy to understand complex experiences. Lee et al. [22] have used an “empathy glasses” to achieve collaborative operations between the remote helper and the local staff. The remote helper can observe the view of a local operator through the desktop display device which displays the visual representation of personal attributes (i.e., gazes, facial expressions and physiological signals) collected by sensors equipped with the “empathy glasses”, to achieve the goal. Gerry et al. [32] have designed a virtual reality system aimed at exploring the potentials of compassion and creativity during the painting process. The academic value is to be a realistic experience superimposed on another experience, so as to effectively guide the user to create infectious works. Kostelnick et al. [33] have studied the term between the data visualization and emotional appeals, i.e., changing the relationship between the designer and the user, this novel form of data design has intensified the affective impact of data displays by eliciting emotions ranging from excitement and empathy to anxiety and fear. Piumsomboon et al. [24] put forward an empathy experience and interactive environment based on MR, the focus is that the visualization method can reasonably express the empathy process, so as to effectively realize human-computer interaction and collaboration. These papers examine two attributes of design philosophy: empathy and visualization. Most of methods resort the study of the initiator in practice thinking to determine the role of empathy in the design process.
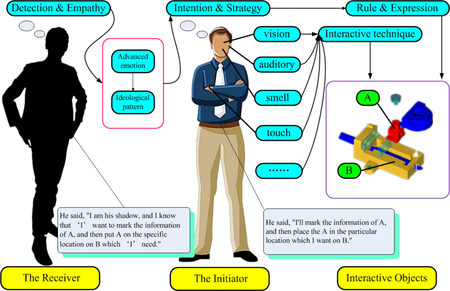
Empathy is solved by exploring two aspects of the effective and cognitive theory. The initiator’s design thinking view regarded as a reflexive practice [34], or as a creator of meaning, or even as a problem-solving activity is used to understand how the transference can be used in the design environment. Tan envisage empathy to be crucial for the establishment of building consensus and seeing a situation from the other person’s point of view to improve working relationships [12]. While nothing is more real, vivid and intuitive than our senses in face-to-face communion, the empathic visualization could partake vicariously of each other's senses for bringing the visual interaction to life. It is worthy of special mention that, the exploration in this article isn’t for emotional clues but rather for natural persons’ intention and strategy, i.e., we embrace not only the expression characteristics in AR visualization but also make the empathic process for the initiator’s motivation. As shown in Figure 1, empathic communication permits the initiator and the receiver to come to a consensus on common purposes.
| Figure 1. The empathy between initiator and receiver |
To reach this consensus, we have developed a novel rule & expression: AED. It not only inherits the visual content of 2D-ED but also inherits the information attribute classification of MBD, and then brings in an empathic visualization system like those in use in Tan’s report.
In our recommendation system, the initiators obviously acted in a similar manner to the commander. Their consciousness and thinking strategies depended on the rules of the AED and led to the exchange of information. The initiator maps the experience to the operating space in the form of empathic visualization through various sensory interaction techniques. The receiver is more like a shadow, namely a ghost. Following the same rule in AED, He can empathize with the initiator's intentions at this moment by empathic visualization, i.e., the ghost becomes the initiator's mind. With the intervention of one certain interaction mode, the private statuses mentioned above can be interchanged. The "original" initiator will shift into the "new" shadow due to receive suggests from the "original" receiver, and then accept the "reconstructed" the initiator's mercy. This series of process is subject to the AED rules, i.e., we shall refer to such empathic communication as AED-based visual impression.
2.3 Implementing empathy in AED-based visual impression
AED-based visual impression
The AED-visual impression follows the standardization of information tagging, rationalization of the graphical display in the 2D-ED. According to MBD, we retain the following modules: the model-based spatial coordinate system, free zoom module, angle rotation module, geometric element reuse module, visualization package of annotation information, visualization package of associative groups, named views, segmentation and cross section, local region enlargement, and the configure of non-geometric information. We aren’t blindly imitating the work of predecessors but rather adding some especial engineering definition. Before elaborating how to define the visual impression, we will need to be quite clear what kind of optical cues can be used to express under AED.
Optical cues for visual impression generation
The optical cue is a kind of medium with special meanings, some of which are inherent traits while others of which are conventional forms of artistic expression in daily life. The exclusive characteristics, marvelous inventions or typical states in optical cues will enter the sensory apparatus for stimulating neuronal cells on the human retina through the visible light. Once stimulation can form a corresponding electrical signal, the central nervous system will precipitate the signal traversing the whole body, and then the result is represented as the "immersed feeling", the body will automatically fuse this "feeling" with private experiences to form the intentions and strategies of personalization, which is called as visual impression. After individuals can quickly detect and reuse these visual cues, the initiator design visual forms, suggesting individual intentions and strategies, in order to transfer his personal will to the receiver. Owing to the same rule of visual cues following by the receiver, it leads the visual information to reach a consensus between them.
Referring to the design principles in relevant literatures [35,36], interactive contents in AED can be attributed to five fundamental elements, color [37], intensity [38], wire frame [39], language [40], coordinate. The first three elements belong to the attributes of the material itself, and the last two are defined by one's own custom.
Color: Color is a substance that exists in nature, usually divided into three basic pigments. Some articles show that people in blue or green rooms report more relaxed than those painted in warm colors such as red, yellow and orange.
Intensity: Intensity, sometimes called as brightness or color retention, has close ties with the inner human spiritual power. The stronger the chromaticity of the target, the more likely it is that the person's attention is affected. No doubt this is conducive to the exchange of information.
Wireframe: All objects in the world are tangible. The boundary between one object and another is often defined by an artificial medium which is named as Line. The line is a medium without boundaries. It can be long, short, coarse and fine. It can sketch any figures that you want. Individuals entrust the meaning of the graphics artificially, so as to realize the communication.
Language: The language doesn’t mean the language with nationality but refers to the text and pronunciation rules of communication. In other words, when language and agency are combined in the proper modality, they form a compound called text, and when language is combined with sound, they form a compound called speech. Therefore, purposeful language rules with fine definition form will exert positive effects on the natural person communication.
Coordinate: The visualization of the coordinates can effectively relieve visual vertigo in the cyber-physical interaction space by defining the spatial location. Coordinates enhance the initiator’s psychological experience to a certain extent, which can prompt the initiator to approach the target with stereo vision, and then give his will to the correct position of the target. Similarly, the remote receiver with the same perspective on the events has experienced the same sense of space, thus will better grasp the initiator’s mood.
AED-definable visual content
The definable content of visual data refers to the inherent attributes of the target body, e.g., the cube could define its length, width, height, volume, quality, and material. Thus, we can think that empathy analyses the characteristics of the target itself. Specifically, our AED can achieve the following aspects: object-based contour display, object-rooted cyber-physical occlusion, object-oriented annotated engineering language delineation, the visual orientation based on human spatial feeling, visual expression based on person's visual angle.
Empathy in AED
Empathy in AED is the key to creating visual impression. Without proper means of empathy, a good visual impression still does not allow the initiator to experience the original author's thoughts. Therefore, on the one hand, we must use existing optical cues to design visual impression that are helpful for understanding. On the other hand, we must also convey these visual impressions through specific empathy. This section will show which empathy methods will be more helpful in expressing visual impressions.
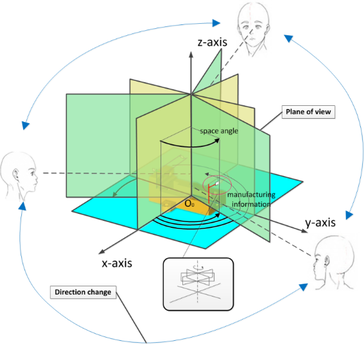
As we all know, the best way for an individual to understand others is to put himself in their place. We describe the empathy between the initiator and the receiver who join the information communication by hitching on the sharing visual angle. A concept called "shadow" was proposed, linking the initiator’s point of view with the receiver's point of view so that the recipient was immersed in the sponsor's consciousness. The operating mechanism of the shared perspective is shown in Figure 2.
|
| Figure 2. The operating mechanism of the shared perspective |
The initiator observes the part through the camera. After AR processing, the cyber-physical space (CPS) adds visual information that represents the intent of the initiator. The body of a real part can automatically establish four azimuth spaces in CPS through the shared perspective (Figure 2), and the pose of the initiator is determined by tracking module.
Through a well-designed spatial directional tracking algorithm, the vertical line of sight is operated and intersects with the Z axis to form a viewing plane. By calculating the spatial angle between the viewing plane and the XZ plane, the above operating mechanism can determine the directional space in which the initiator is located at this time and highlight the corresponding manufacturing information to create a visual impression using the remote receiver. Regardless of how initiators move, visual information is always perpendicular to the user's line of sight.
The initiator uses AED-based visual impressions to describe his intentions as a set of visual results consisting of optical cues that facilitate empathy. The receiver works remotely via Skype devices (e.g., Android phones, PCs) and help himself better understand tasks through a “visual” ideological pattern from the shared perspective.
The expressing strategy of visual impression in our experiment
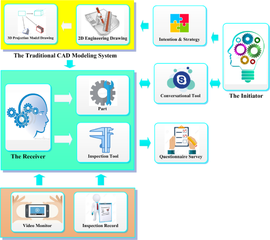
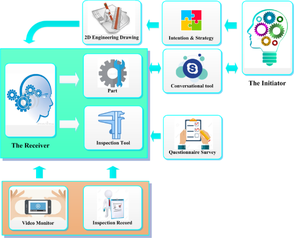
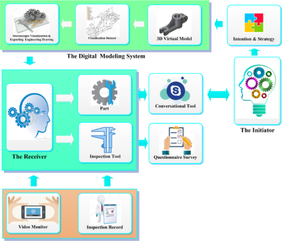
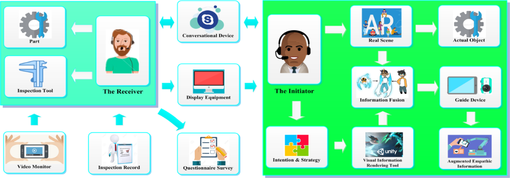
We have designed a typical work scenario to verify the positive effect of empathy on the manufacturing process. There are 4 types of configuration available: 2D information only, 2D and/or 3D projection data, 3D data only and AED-based visual impression.
The four modes are generally divided into four phases.
The data preparation-A pre-task questionnaire survey should be done by the receiver and the initiator.
Working medium configuration-The initiators are pre-designated researcher. He has four working media, namely 2D-ED drawing, 2D/3D projection drawing, MBD model data file and AED-based visualization data set. Every time an experiment is conducted, he need to reselect media for empathizing with remote recipients, and the choices within each experiment must not be repeated.
The data acquisition-The receiver could constantly consult the initiator about the details of working media by the conversational tool. After forming a clear and accurate visual impression, the receiver should utilize a Vernier caliper to inspect the target part placed on the operating platform, the size, and its tolerance information will be recorded.
The data processing-Comparing recorded data and design data, the receiver needs to write down the evaluative conclusion in the executive record book. And the pair receives a questionnaire survey. The system structure of the four empathy modes is shown in Figure 3.
|
|
| (a) Mode 1 | (b) Mode 2 |
| |
| (c) Mode 3 | |
| |
| (d) Mode 4 | |
| Figure 3. The system structure of the four empathy modes | |
By comparing with the above three modes (Figures 3(a), (b) y (c)), the AED-based system can adapt to the focus of the eye and focus on the behavioral awareness of the natural person. Through this visual processing method, the natural person's operational awareness can be evaluated.
3. Hypothesis
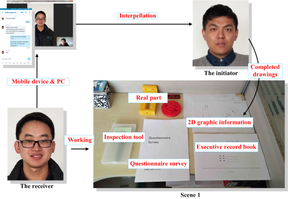
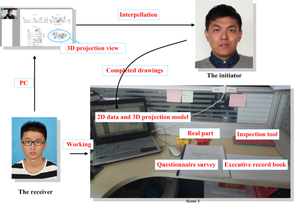
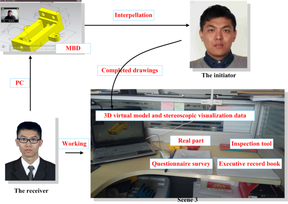
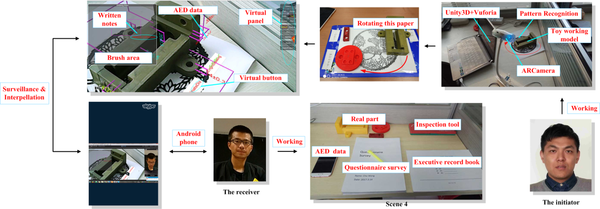
We believe that the proper visual expression of the aspirations of the natural person plays an important role in the empathy exchange. The configuration of the four visual impressions is shown in Figure 4.
|
|
| (a) | (b) |
| |
| (c) | |
| |
| (d) | |
| Figure 4. The configuration of the four visual impressions | |
Previous studies have defined engineering as the basis for communication between human and manufacturing information. Some articles have even made full use of scientific visualization methods, novel interactive tools, and interesting information processing systems to make the engineering definition expressed in a more intuitive and more natural form. However, a set of more adaptable information expression rules through incorporating emerging technologies (e.g., empathy, visual information cognition, augmented reality, virtual reality, mixed reality) into these existing engineering definitions haven’t been reported. Some kinds of literature have reported that AR-based manufacturing systems with empathy have focused on the physiological cues to get the emotional experience of human beings, and these reports have not formed a set of specific engineering rules. Our proposed engineering definition aims to further improve work efficiency by using visual impression to rebuild the manufacturing relationship between the initiator and the receiver.
In this study, we sorted out the contribution of each communication configuration (i.e., interacting via 2D graphic information only (Figure 4(a)), interaction with 2D data and 3D projection model (Figure 4(b)), interaction with 3D virtual model and stereoscopic visualization data (Figure 4(c)), AED-based communication by actual objects and augmented empathic information (Figure 4(d)).
We make the following hypotheses and clarify the empathy relationship in remote collaborative tasks:
Hypothesis 1 (H1): Using 3 or more optical cues will have higher visual performance than those using less than 3.
Hypothesis 2 (H2): Using the 2D / 3D projection view will produce higher levels of empathy than interacting via 2D graphics information only.
Hypothesis 3 (H3): Using MBD will produce higher levels of empathy than interacting via 2D graphics with its engineering definition.
Hypothesis 4 (H4): Using the AED-based visual impression will produce higher levels of empathy than interacting via MBD or 2D-ED.
4. Methods
4.1 Experimental design
Our experimental design involved pairs of participants, discussing and inspecting three representative parts in an assessment process within the setting of 4 modes. Guided by the initiator’s instruction, the receiver must complete a set of tasks in a specific order. For each mode, the initiator acted as team leader to maintain the exchange of information and was responsible for guiding the receiver's assessment process. The leader used mediums to give the graphics information based on engineering definitions and the order of the models to evaluate; while, the receiver has no prior knowledge. The participants were situated at different locations for this study. These four modes aimed to reveal the positive role of empathy and AED during the manufacturing information communication. We focused on identifying the impact of AED-based visual impression on individuals’ information communication. These modes correspond to the settings mentioned in the hypotheses.
4.2 Participant
We fixed the initiator as the same person to ensure that the input conditions under the four modes are constant. 10 receivers (5 undergraduates and 5 postgraduate students) between the age of 20 and 24, involved in our user study; all had prior experience using inspection tools and used PC or Android phone regularly at least once 10 to 15 hours a week for manufacturing goals. In each pair of randomly assigned pairs, the initiator acted as a remote expert. For example, doctoral researchers were assigned the role of leader, while students assumed the role of receivers. Please note that we also had other participants. The receivers were divided into two teams with 5 members each. Team 1 had the basics of engineering drawing but lacked experience in using CAD software. Team 2 had extensive experience in machine design using CAD software, e.g., NX, CATIA.
4.3 Configuration and implementation in four modes
In the mode 1, the 2D-ED drawings were the initiator's hand-painted graphics. The receiver's Android phone owned Skype-based video conferencing and information sharing. In mode 2 or 3, the initiator’s PC had a 2.4 GHz Intel processor and utilized 8 GB RAM. By contrast, the receiver’s PC that had a 2.1 GHz Intel processor and 4 GB RAM was utilized. A model expression is implemented by using the corresponding CAD modeling software (i.e., CAXA, NX). The AED-based prototype system had been developed using Unity3D-based C-sharp language and ran on a Microsoft Windows operating system. Similarly, the initiator’s PC equipped a 2.4 GHz Intel processor and 8 GB RAM. Marker-based tracking was implemented usthe ing VufARoria library. The customized panel for brush and the virtual button for coordinates had been rendered by OpenGL. A webcam with a capture rate of 30 fps had been used to assimilate physical information. The receiver’s Android phone owned Skype-based video conferencing and information sharing.
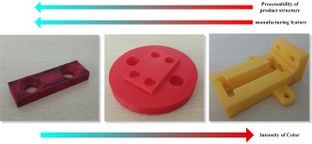
These four modes were applied to the data examining of three typical parts as shown in Figure 5. Selecting these parts attributed the cause to three main reasons. Firstly, using color shades with different intensities (one of the optical cues) reflected the operator’s acceptable degree for visual information. Second, each part contains a wealth of manufacturing features that make visual impression more intense. Third, the structure of the parts operated by the user is from simple to complex, making it increasingly difficult to operate.
|
| Figure 5. The parts with typical manufacturing features |
Two teams were welcomed to our test upon arrival in our designated place. They were given a brief description of all these modes. Prior to the start of the experiment, the visual content associated with each mode was informed to the users. In addition, we also explained to the two teams how to use visual expressions related to visual impression during the experiment. Our researchers responded questions covering any details about empathy. They were then asked to sign a consent form and completed the pre-task questionnaires, which included the empathy quotient, interpersonal reactivity index, and positive and negative affect schedule questionnaires.
After that, team 1 was led to their room, which was not the same room in which the initiator was located, to complete corresponding operations. Implementing all these modes lasted approximately one-half or two hours for each one pair. In this process, one initiator used Skype to guide receivers one by one in checking operation. When the inspection was finished, 5 receivers immediately filled in questionnaires about the current mode. It was worth noting that after team 1 completing all the tasks and leaving the room, then team 2 entered and repeated the whole process. During the whole experiment, a video monitor was placed near the receiver, which was used for real-time recording the operating status, i.e., facial expression, consultation frequency, length of operation time, and interruption times among the operation.
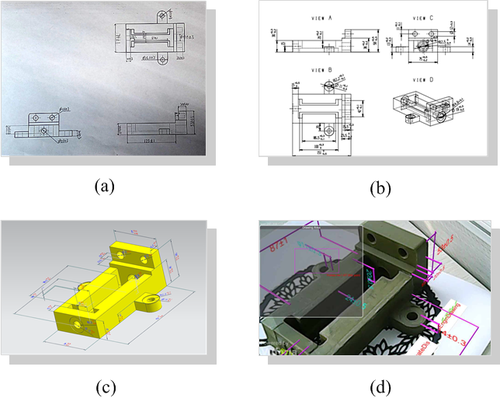
As soon as the initiator signaled, the receiver began to judge the checking sequence of current part’s manufacturing information by Skype that was used for observing the initiator’s behavior. The checking sequence specified by the initiator in each mode was random, making the efficiency index under the implementing mode not seriously been interfered by the receiver’s cumulative experience. The initiator was equipped with the recording list to chronicle the data of facial reaction index, advisory frequency index, operation time and operation interruption times. The initiator led the conversation and notified the receiver of the grading criteria. By contrast, the receiver was equipped with the inspection tool to check the three parts by examining 2D engineering drawings (Figure 6(a)), 3D projection drawings (Figure 6(b)), MBD-based models (Figure 6(c)) and AED-based models ((d)).
|
| Figure 6. The third part under the four setting conditions |
5. Experimental results and evaluation
This experiment has combined the two strategies: objective evaluation and subjective valuation. The objective evaluation refers to a configuration mode, i.e., several video monitors, which have been equipped in specific locations, collect receivers’ length of operation time, and interruption times among the operation to evaluate the operation efficiency.
The subjective evaluation refers to a questionnaire survey which is used to evaluate receivers’ experience. Questions in this evaluation are special, which covers many aspects (e.g., the degree of understanding drawings, the complexity of the operation process, psychological /emotional changes, and the aggregation degree of attention).
By adopting the above analysis method, the natural person's behavior evaluation will be able to more fully reflect the individual's understanding of the information in the information exchange.
5.1 Objective data executive record
We enabled the two types of data record scale to reflect the impact of AED on the receiver's behavior and manner. One of two types were called objective data executive record which possessed by the initiator recorded the receiver’s stress reaction in 4 aspects, namely the number of consultation, effective consultation time, effective operation time and interruption times.
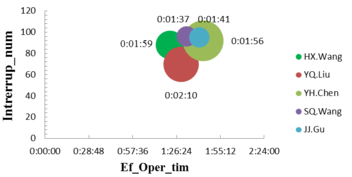
Figure 7 showed the personal operating characteristics. The horizontal axis represented the effective operation time, and the vertical axis indicated the operation interruption caused by certain factors (e.g., logical thinking, changing operation status). We had used circles with 5 colors to proclaim each one in two teams. The one’s radius was defined by the number of times of operation counseling. The larger the radius, the more counseling times. The label near the colored circles recorded the corresponding consultation time.
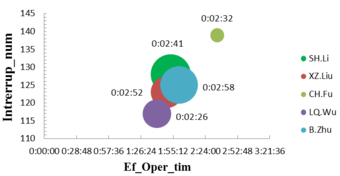
|
|
| *Circle radius: The number of operational consultations. | |
| *Label: Consultation time. | |
| Figure 7. The individual reaction of consultation and operation | |
The number of interruptions (Figure 6) is proportional to the effective operating time. Too few times of consultation had caused in a significant increase in effective operation time and interruptions. The excessive number of consulting times had not significantly shortened the effective operation time, and interruptions were also not significantly reduced. Too little human experience had played a negative role in reducing the number of inquiries. The counseling times and interruptions were able to be positively affected by human experience. Human experience had served a useful purpose on the shortening of effective operation time. We have recorded the specific response of each receiver in 4 modes, as shown in Table 1.
| Team-Name | M1(ECT/ECN/EOT/IN) | M2(ECT/ECN/EOT/IN) | M3(ECT/ECN/EOT/IN) | M4(ECT/ECN/EOT/IN) |
|---|---|---|---|---|
| 1-SH.Li | 53’’/3/32’59’’/33 | 44’/2/27’11’’/32 | 33’/3/27’59’’/33 | 31’/0/24’47’’/30 |
| 1-XZ.Liu | 64’’/2/36’28’’/31 | 36’/1/29’06’’/30 | 40’/1/22’28’’/31 | 32’/1/21’28’’/31 |
| 1-CH.Fu | 47’’/1/42’09’’/32 | 45’/0/38’14’’/38 | 38’/0/37’21’’/38 | 22’/0/36’52’’/31 |
| 1-LQ.Wu | 39’’/2/25’44’’/30 | 38’/1/25’30’’/31 | 40’/1/24’44’’/28 | 29’/0/24’40’’/28 |
| 1-B.Zhu | 69’’/2/32’13’’/32 | 44’/2/29’53’’/31 | 42’/2/30’01’’/32 | 23’/1/28’18’’/30 |
| 2-HX.Wang | 39’’/1/24’47’’/26 | 33’/1/19’28’’/24 | 28’/0/18’59’’/19 | 19’/0/18’47’’/19 |
| 2-YQ.Liu | 44’’/2/27’28’’/27 | 37’/0/22’18’’/18 | 24’/1/19’44’’/14 | 25’/0/19’51’’/11 |
| 2-YH.Chen | 38’’/1/32’19’’/28 | 28’/1/29’22’’/27 | 29’/1/21’27’’/19 | 20’/1/20’43’’/18 |
| 2-SQ.Wang | 32’’/0/27’14’’/29 | 26’/0/21’32’’/22 | 19’/1/24’44’’/24 | 21’/0/19’40’’/21 |
| 2-JJ.Gu | 31’’/1/29’57’’/28 | 24’/0/26’51’’/24 | 28’/0/22’44’’/25 | 18’/0/21’45’’/18 |
Compared to the other three modes, M1 had taken up more response resources, namely, ECT, ECN, EOT, and IN. As you can see from the data, receivers were more receptive to M3 and M4 with rich optical cues than M1 and M2 with only wireframes and textual expressions. Due to their experience of plotting traditional engineering drawings, team 1 had a slightly better performance in M2 than M3. In contrast, members of team 2 were researchers who specialized in using CAD software to help them better fit M3 rather than M2. Among all four tests, M4 was the most efficient mode. Overall, with rich practical experience, Team 2 shows more obvious empathy than Team 1.
5.2 Subjective data questionnaire
The other one of the two data records were named as subjective data questionnaire. Before the start of the experiment, they were asked to complete the pre-task questionnaires, which included the empathy quotient, interpersonal reactivity index, and positive and negative affect schedule questionnaires. As soon as the inspection was over, each receiver filled up the other questionnaire, in which a set of Likert questions covered the evaluation of AED-based visual impression in four main aspects, including ease of comprehending (see EQ), psychological experience (see IRI), ease of operating (see ES) and spiritual execution (see PANAS). At the end of this survey, several questions were designed to gain comments, suggestions and comparisons of AED-based interfaces and common visual interfaces.
The subjective data questionnaire is mainly divided into two parts. Pre-task survey: empathy quotient survey(EQ), interpersonal reactivity index survey(IRI) and positive and negative affect schedule survey(PANAS). Post-processing questionnaire: entitativity survey(ES), and positive and negative affect schedule survey(PANAS).
For each pair of participants, EQ and IRI were used to evaluate their empathy quotient and interpersonal reaction index, which probably otherwise impact manufacturing information communication due to impairment of participants to grasp others’ intention and behavior.
The EQ survey was a 5-point Likert scale with 60 items, with a total score of 0-80. Each participant’s score was considered individually. The one-way AVONA’s analysis demonstrated that there was no statistically significant difference between initiator and receiver. The initiator had a mean of 41.0 and a standard deviation of 0.00, while the receiver had a mean of 41.7 and a standard deviation of 5.34. The relevant data from SPSS (Statistical Product and Service Solutions) were , and . The IRI data were obtained from the Likert scale and included a total of 28 items. Because our goal was to relate the understanding of empathy to the ability of individuals to perceive visual manufacturing information, we focused on the components of the IRI that reflect the components of empathy. The paired sample t-test of IRI also showed no statistical difference in the respective subscales. SPSS had showed PT (, , , ), FS (, , , ), EC (, , , ) and PD (, , , ). From the parameter of PT and FS, we concluded that there was a strong correlation between initiator and receiver. According to the results of the analysis, all hypotheses had been established, i.e., there was no statistically significant difference in participants' EQ and IRI.
Entitativity survey (ES) was mainly used to evaluate how the visual configuration defined by three types of engineering definitions affected the formation of empathy for each pair. It was introduced by Bailenson and Yee (2006) with a Likert scale and owned ten items. 6 items with a 7-point response described a statement, while three items with a 9-point response presented personal performance. Additionally, 1 item required the initiator and the receiver to select which set of circles best represents the pair in seven charts of two different overlapping circles. Entitativity survey earned a total score of 0 to 76. Alpha reliability was used to assess the strength of the agreement composed of the participants' subjective responses. The results demonstrated that the consistency score of internal consistency is quite high (Cronbach’s alpha 0.807), and more than 90% of the designed problems are considered as reliable. We analyzed the interpersonal cohesion from the ES, which indirectly reflected the four modes of ease of operating. Wilcoxon signed-rank sum test was used to assess the entitativity in our study.
There was strong evidence to show that mode 3(, ) and mode 4 (, ) strikingly confirmed the potent effect on teamwork spirit and excellent communication than the others, when the p-values had been established on confidence level of 95% (). However, mode 4 (, ) had showed a slightly higher level of team awareness and empathy level than mode 3 (, ), mode 2 (, ) and mode 1 (, ) if the confidence level was adjusted from 95% to 99% ().

|
| Figure 8. Entitativity scores of four modes |
As shown in Figure 8, the scores of ES had exhibited that mode 1 was with the mean score of 46.84 and the standard deviation score of 11.8, mode 2 was with the mean score of 46.66 and the standard deviation score of 11.1, mode 3 was with the mean score of 48.11 and the standard deviation score of 10.7 and mode 4 was with the mean score of 49.02 and the standard deviation score of 10.4.
The experimental results had shown that M1 and M2 had no significant difference in the ES level. By comparison with M1 and M2, M3 and M4 were more conducive to the formation of empathy, which made both levels of operation achieved a higher effect. Furthermore, M4 was more advantageous than M3 in establishing a stable sense of teamwork based on empathy.
Specific quantitative analyses, acquired from their PANAS, had been performed on the participants’ spiritual execution. The participants' Likert scale scores had been shown to determine how well these modes match their spiritual tastes and whether any changes will affect their overall impact. In the four modes, the participants' self-assessed PANAS of the paired sample t-test showed a significant increase in positive sentiment and a significant decrease in negative sentiment compared to their pre-task self-reported measures (Table 2).
| PANAS-index | M1 | M2 | M3 | M4 |
|---|---|---|---|---|
| PA | , | , | , | |
| NA | ||||
| OA |
Statistical analysis of PANAS showed that AED-based visual impression (M4) had a more positive effect than those using 2D-ED (M1, M2) or MBD (M3). M1 was essentially consistent with M2 in terms of its overall affect (OA) and positive affect (PA) on participants. But M2 led a significantly greater emotional impact than M1, which made the data variability more violent. When comparing M4 with M3, the results proved a significant change in positive impact. However, the positive and negative effects of M4 on human cognitive emotion were more severe than that of M3, which made the AED have more obvious advantages and disadvantages compared to MBD.
The p-values of the one-way ANOVA also showed that the positive effect of M4 on the attitudes of participants was even more pronounced than M1. Besides, M4 had a clear advantage over M2 in terms of positive impact. M4 and M3 had a greater overall effect than M1 and M2. Furthermore, the Wilcoxon signed-rank sum test was used to assess alertness and distress of the self-reported emotions in PANAS, which had revealed a statistically significant difference between M3 and M4. When using M4 (, ) as compared to M3 (, ), alertness increased significantly (,). In contrast, M4 (, )’s distress decreased significantly (, ) when compared to distress in M3 (, ).
6. Discussion
6.1 Review results
According to the above study, we use the combination of objective measurement and subjective analysis to systematically evaluate whether AED-based visual impression is better than 2D-ED and MBD.
We use the number of consultations, effective consultation time, effective operating time and interruption time to quantify the impact of visual performance on the user during operation. Compared with other modes, M1's ECT, ECN, EOT, and IN data are more intense. Receivers were more receptive to M3 and M4 with rich optical cues than M1 and M2 with only wireframes and textual expressions. Due to their experience of plotting traditional engineering drawings, team 1 had a slightly better performance in M2 than M3. In contrast, members of team 2 were researchers who specialized in using CAD software to help them better fit M3 rather than M2. Among all four tests, M4 was the most efficient mode. Overall, with rich practical experience, Team 2 shows more obvious empathy than Team 1. The results show that the more visual content and the more novel the form, the stronger the visual stimuli to the user and the stronger the corresponding visual impression.
The empathy is assessed by the participants' comprehensibility and operability of the different engineering definitions. The assessment indicators are EQ and IRI. The test of EQ has ruled out the possibility of a failed empathy due to natural psychological defects. The IRI test has determined the pressure response of different users to different visual effects. Through the evaluation of this indicator, the experimental settings have been repeatedly modified to achieve a better level of user experience. According to the results of the analysis, the experimental content for H2, H3, and H4 is meaningful.
The assessment of visual impression is measured by behavioral performance and psychological experience. User psychological experience and behavioral performance can be measured by the feasibility and availability of these engineering definitions in the exchange of manufacturing information among natural persons.
Analyzing the user experience evaluation data obtained from ES and PANAS, we can determine the information contagion in empathy. Entitativity survey (ES) has evaluated how the supported visual configurations defined by the three projects affect the behavior of each pair during the transfer process. The experimental results had shown that M1 and M2 had no significant difference in the ES level. By comparison with M1 and M2, M3 and M4 were more conducive to the formation of empathy, which made both levels of operation achieved a higher effect. Furthermore, AED-based visual impression was more advantageous than MBD in establishing a stable sense of teamwork based on empathy.
PANAS assesses the positive and negative psychological effects of empathy on users before and after the experiment. The psychological performance shows that visual impressions under different engineering definitions influence the degree of personal work results, which allows us to determine which visual impressions lead to more comfortable psychological feelings.
Statistical analysis of PANAS shows that AED-based visual impression (M4) has a more positive effect than those using 2D-ED or MBD. M2 is essentially consistent with M1 in overall affect (OA) and positive affect (PA) but has a significantly great psychological impact. Comparing with M3, M4 has a significant change in positive impact. The positive and negative effects of M4 on human cognitive emotion have more severe than that of M3, which makes the AED have more obvious advantages and disadvantages than MBD.
The p-values of the one-way ANOVA also shows that the positive effect of M4 on the attitudes of participants was more pronounced than M1and M2. M4 and M3 had a greater overall effect than M1 and M2. The Wilcoxon signed-rank sum test assesses alertness and distress of the self-reported emotions in PANAS, which had revealed a statistically significant difference between M3 and M4. Comparing with M3, M4’s alertness increases significantly and distress decreased significantly.
Recall the hypotheses we have given, the number of consultation, effective consultation time, effective operation time and interruption times have proved that using three or more optical cues have higher visual stimuli; ease of comprehending, psychological experience, ease of operating and spiritual execution have verified H2, H3, and H4.
6.2 Problems in our study
During the experiment, we also noticed several problems that may affect the accuracy of the evaluation results. When the initiator embraces the AED-based visual impression, sometimes the tracking of the target object fails suddenly due to insufficient visible light entering the camera or moving the camera too fast, which can be troublesome to the remote receiver. The poor robustness of the AED-based CPS has made the assessment of the M4 far from expected.
Receivers have been divided into two groups because of their different background of identities. However, we neglected the CAD-specific preferences of certain groups of people. Team 1, whose members have long been instructed in engineering drafting, prefers traditional definition of engineering to model-based definition. On the other hand, Team 2, composed of researchers, prefers model-based definition compared to 2D engineering definition. This uncontrollable factor in personal habits led some of them to perform better in the M1 or M3. In the process of collecting objective data, we collect the receiver’s behavior through the video monitor. After the recipient's task is completed, a staff member will look back at the obtained video to record the relevant data. To a certain extent, this method has increased the risk of errors in the recorded data due to human factors. When investigating the subjective data, the designed problems tend to be biased toward people's cognition and understanding of visual information. However, a relatively large number of problems have focused on evaluating MBD and AED, leaving the evaluation of 2D-ED to some extent affected. We have reason to believe that when the number of evaluation questions among the three is the same, Team 1 will give the traditional engineering definition a higher score than the model-based definition.
7. Conclusion
Our work focuses on augmented engineering definition based visual impression for information communication in manufacturing engineering and use empathy to prove whether AED-based visual impression is beneficial to individuals' information exchange.
The study of Hypothesis 1 verifies some of the display characteristics of visual information itself and confirms that AED inherited from 2D-ED and MBD have their engineering expression advantages. Hypothesis 2 studies the reason why the 2D/3D projection description method is still used at the manufacturing site and confirms that the 3D projection drawing will reduce people's understanding burden compared with the 2D drawing.
Hypothesis 3 studies verified that MBD can greatly simplify the cognitive difficulties of work and confirms the inadequacy of 2D drawing. However, the existing industrial development makes it necessary to convert the MBD into a 2D/3D projection drawing. This is a key issue for MBD that cannot be fully utilized in the industry. The experimental study of Hypothesis 4 proves that AED-based visual impression is superior to 2D-ED and MBD in terms of information display, information comprehension, human-computer interaction, physical and psychological experience.
Empathy maps visual expressions with human intentions to the cyber-physical space, and AED effectively improves the problem of information understanding and ambiguity in the manufacturing process. However, it is worth noting that the current system can only empathy with static visual impression. In the future work, we will try to explore dynamic visual impressions based on AED to further analyze what kind of visual impression are used to manipulate the process so as to provide users with a better visual experience.
References
[1] French, T.E. Mechanical drawing CAD-communications. McGraw-Hill, 1990.
[2] Bourguignon D., Cani M.P., Drettakis G. Drawing for illustration and annotation in 3D. Computer Graphics Forum, 20:114-123, 2001.
[3] Briggs C., Brown G.B., Siebenaler D., Faoro J., Rowe S. Model-based definition. In Aiaa/asme/asce/ahs/asc Structures, Structural Dynamics & Materials Conference Aiaa/asme/ahs Adaptive Structures Conference, 2010.
[4] Alemanni M., Destefanis F., Vezzetti E. Model-based definition design in the product lifecycle management scenario. The International Journal of Advanced Manufacturing Technology, 52:1-14, 2011.
[5] Carvajal A. Quantitative comparison between the use of 3D vs 2D visualization tools to present building design proposals to non-spatial skilled end users. In International Conference on Information Visualisation, 2005.
[6] Quintana V., Rivest L., Pellerin R., Venne F., Kheddouci F. Will Model-based Definition replace engineering drawings throughout the product lifecycle? A global perspective from aerospace industry. Computers in Industry, 61:497-508, 2010.
[7] Leu M.C., ElMaraghy H.A., Nee A.Y.C., Ong S.K., Lanzetta M., Putz M., et al. CAD model based virtual assembly simulation, planning and training. CIRP Annals - Manufacturing Technology, 62:99-822, 2013.
[8] Wang X., Ong S.K., Nee A.Y.C. A comprehensive survey of augmented reality assembly research. Advances in Manufacturing, 4:1-22, 2016.
[9] Zhou F., Duh H.B., Billinghurst M. Trends in augmented reality tracking, interaction and display: A review of ten years of ISMAR. In International Symposium on Mixed and Augmented Reality, 193-202, 2008.
[10] Nee A.Y.C., Ong S.K., Chryssolouris G. Mourtzis D. Augmented reality applications in design and manufacturing. Cirp Annals-manufacturing Technology, 61:657-679, 2012.
[11] Henderson S.J., Feiner S. Exploring the benefits of augmented reality documentation for maintenance and repair. IEEE Transactions on Visualization and Computer Graphics, 17:1355-1368, 2011.
[12] Tan C.S.S., Luyten K., Den Bergh J.V., Schoning J., Coninx K. The role of physiological cues during remote collaboration. Teleoperators and Virtual Environments, 23:90-107, 2014.
[13] Eisenberg N., Fabes R.A., Murphy B.C., Karbon M., Maszk P., Smith M. et al. The relations of emotionality and regulation to dispositional and situational empathy-related responding. Journal of Personality and Social Psychology, 66:776-797, 1994.
[14] Bickmore T.W., Picard R.W. Establishing and maintaining long-term human-computer relationships. ACM Transactions on Computer-Human Interaction, 12:293-327, 2005.
[15] Stephan W.G., Finlay K.A. The role of empathy in improving intergroup relations. Journal of Social Issues, 55;729-743, 1999.
[16] Miller W.R., Rollnick S. Motivational interviewing: Preparing people for change. Journal for Healthcare Quality, 2nd ed., 25:46, 2003.
[17] Eisenberg N., Fabes R.A., Murphy B.C., Karbon M., Smith M., Maszk P. The relations of children's dispositional empathy-related responding to their emotionality, regulation, and social functioning. Developmental Psychology, 32:195-209, 1996.
[18] Gupta K., Lee G.A., Billinghurst M. Do you see what I see? The effect of gaze tracking on task space remote collaboration. IEEE Transactions on Visualization and Computer Graphics, 22:2413-2422, 2016.
[19] Huang J.M., Ong S.K., Nee A.Y.C. Visualization and interaction of finite element analysis in augmented reality. Computer-aided Design, 84:1-14, 2017.
[20] Li W., Nee A., Ong S. A state-of-the-art review of augmented reality in engineering analysis and simulation. Multimodal Technologies & Interaction, 1:17, 2017.
[21] Tan C.S.S., Schöning J., Luyten K., Coninx K. Informing intelligent user interfaces by inferring affective states from body postures in ubiquitous computing environments. In Proceedings of the 2013 International Conference on Intelligent User Interfaces, 235-246, 2013.
[22] Lee Y., Masai K., Kai K., Sugimoto M., Billinghurst M. A remote collaboration system with empathy glasses. In IEEE International Symposium on Mixed & Augmented Reality, 2017.
[23] Dey A., Piumsomboon T., Lee Y., Billinghurst M. Effects of sharing physiological states of players in a collaborative virtual reality gameplay. In Human Factors in Computing Systems, 4045-4056, 2017.
[24] Piumsomboon T., Lee Y., Lee G.A., Dey A., Billinghurst M. Empathic mixed reality: sharing what you feel and interacting with what you see. In International Symposium on Ubiquitous Virtual Reality, 38-41, 2017.
[25] Coleman R., Lebbon C., Myerson J. Design and empathy. Springer London, 2003.
[26] Kouprie M., Visser F.S. A framework for empathy in design: stepping into and out of the user's life. Journal of Engineering Design, 20:437-448, 2009.
[27] Wright P., Mccarthy J. Empathy and experience in HCI. In Human Factors in Computing Systems, 637-646, 2008.
[28] Thomas J., Mcdonagh D. Empathic design: Research strategies. Australasian Medical Journal, 6:1-6, 2013.
[29] Mattelmaki T., Vaajakallio K., Koskinen I. What happened to empathic design. Design Issues, 30:67-77, 2014.
[30] Carrier L.M., Spradlin A., Bunce J.P., Rosen L.D. Virtual empathy: Positive and negative impacts of going online upon empathy in young adults. Computers in Human Behavior, 52:39-48, 2015.
[31] Kumar J., Goldwasser E., Seth P. Empathy at work. Using the power of empathy to deliver delightful enterprise experiences. In International Conference on Human-Computer Interaction, 65-72, 2016.
[32] Gerry L.J. Paint with me: Stimulating creativity and empathy while painting with a painter in virtual reality. IEEE Transactions on Visualization and Computer Graphics, 23:1418-1426, 2017.
[33] Kostelnick C. The re-emergence of emotional appeals in interactive data visualization. Technical Communication, 63:116-135, 2016.
[34] Gasparini A. Perspective and use of empathy in design thinking. In Advances in Computer-Human Interaction, 49-54, 2015.
[35] Keller P.R., Keller M.M. Visual cues: Practical data visualization. Computers in Physics, 8:297-298, 1994.
[36] Hosseini R., Brusilovsky P. A comparative study of visual cues for adaptive navigation support. In ACM Conference on Hypertext, 323-325, 2016.
[37] Wantz A.L., Borst G., Mast F.W., Lobmaier J.S. Colors in mind: a novel paradigm to investigate pure color imagery. Journal of Experimental Psychology: Learning, Memory and Cognition, 41:1152-1161, 2015.
[38] Kong H., Liu Z., Karahalios K. Internal and external visual cue preferences for visualizations in presentations. Computer Graphics Forum, 36:515-525, 2017.
[39] Nakayasu T., Yasugi M., Shiraishi S., Uchida S., Watanabe E. Three-dimensional computer graphic animations for studying social approach behaviour in medaka fish: Effects of systematic manipulation of morphological and motion cues. Plos One, 12:e0175059, 2017.
[40] Boy J., Eveillard L., Detienne F. Fekete J. Suggested interactivity: Seeking perceived affordances for information visualization. IEEE Transactions on Visualization and Computer Graphics, 22:639-648, 2016.
Document information
Published on 21/01/21
Accepted on 02/01/21
Submitted on 20/06/20
Volume 37, Issue 1, 2021
DOI: 10.23967/j.rimni.2021.01.005
Licence: CC BY-NC-SA license
Share this document
Keywords
claim authorship
Are you one of the authors of this document?

