Abstract
Phytoplankton play a major role in marine ecosystem health. They form the base of aquatic food webs, but under conditions of nutrient loading and high stratification, they can develop into harmful algal blooms that produce toxins harmful to humans and wildlife. Ongoing phytoplankton blooms have been observed in Long Island’s (LI) coastal waters for the past half-century, but there is a lack of a comprehensive view of phytoplankton spatiotemporal distribution and their driving factors due to the analysis of specific sampling sites, species, and years. Thus, this study obtained 20 years of chlorophyll-a, climate, and nutrient remote sensing and in situ data from the ERDDAP data server and the CTDEEP Long Island Sound Water Monitoring Program to establish phytoplankton phenology using the threshold criterion and cumulative sum of anomalies methods and to investigate regional differences, influencing factors, and interannual trends using correlation and linear trend analysis. The phenology of summer-autumn blooms in Long Island Sound (LIS) was associated with high sea surface temperatures (r = -0.46, p < 0.01). In contrast, winter-spring blooms were most strongly correlated with low salinity (r = -0.52, p < 0.01), indicating P-rich Connecticut river discharges as the dominant nutrient source. However, phytoplankton in LI’s southern shores lack access to river outlets, so phytoplankton production was driven by deep winter mixings from low SST that replenish surface water nutrient levels (r = -0.71, p < 0.05). Finally, our results showed strong decreasing interannual trends of autumn chlorophyll-a levels from 2003-2022 (r < -0.66, p < 0.05), potentially due to heightened N-limitation. Hence, the effects of declining phytoplankton productivity on LI’s fisheries and marine ecosystems should be further investigated.
Introduction
Phytoplankton, also known as microscopic algae, are naturally found at the surface of oceans and play a major role in marine ecosystem health and functioning. Forming the base of aquatic food webs, they support marine life and recycle nutrients by assimilating metabolic waste from other organisms, such as nitrogen (N) and phosphorus (P), from the environment as a nutrient source (Falkowski et al., 2012; Banta et al., 2004). On the other hand, their excessive growth—attributable to nutrient loading from rainfall runoff or river discharge—can lead to harmful algal blooms (HABs) in which uncontrolled growth of algal colonies contribute to hypoxia, poisoning syndromes, and the loss of biodiversity (Anderson et al., 2021; Vaquer-Sunyer & Duarte, 2008). Furthermore, the timing of phytoplankton blooms is essential to ensure food availability during the feeding window of higher trophic level organisms (Edwards & Richardson, 2004; Beaugrand et al., 2003). Since phytoplankton significantly impacts marine ecosystems, their growth is monitored and, in some cases, regulated on a need-basis to restore biological balance.
However, there is a lack of a thorough understanding of phytoplankton spatiotemporal distribution in Long Island Sound (LIS) and Long Island’s (LI) southern embayments, which have a 50-year history of ongoing eutrophication, summer hypoxia, and seasonal phytoplankton blooms (Varekamp et al., 2010; Parker & O’Reilly, 1991; Ryther, 1954). Moreover, LI waters are changing as NY metropolitan areas are rapidly urbanizing and ecological parameters influencing phytoplankton growth differ seasonally, making phytoplankton susceptible to shifts in spatiotemporal distribution (Gobler et al., 2006). It is evident that these changing factors are impacting phytoplankton on LI as the frequency and intensity of HABs and hypoxia are increasing with trends of rising sea surface temperatures and stronger stratification—the separation of the water column in stable layers of differing temperature and nutrient density (Anderson et al., 2021; Griffith et al., 2019; Rice & Stewart, 2013; Staniec & Vlahos, 2017). Past studies have produced contradictory findings of factors driving phytoplankton phenology and abundance possibly due to analyzing different sample sites, species, and years (George et al., 2014; Rice & Stewart, 2013, Suter et al., 2014; Anderson & Taylor, 2001; Gobler et al., 2006). Thus, understanding the variables influencing phytoplankton spatiotemporal distribution in LI coastal waters is essential to protecting the health of humans and wildlife.
Remote Sensing for Satellite Visualization of Phytoplankton
Since all objects absorb and reflect different frequencies of light, remote sensing satellites in Earth’s orbit can monitor characteristics and phenomena of the environment without direct contact and at high spatial and temporal resolutions. Satellites have one or more sensors that use solar radiation or their own source of illumination to measure the intensity of specific wavelengths, usually in the visible and near-infrared light spectrum, reflected from the Earth’s surface (Zhu et al., 2018).
To estimate phytoplankton biomass, satellites measure the absorption and reflection wavelengths associated with Chlorophyll-a (Chl-a) due to its role as the main photosynthetic pigment in phytoplankton and its selective light absorption (Poddar et al., 2019). To improve the accuracy of remote sensing measurements, ocean color algorithms establish empirical relationships between on-site chlorophyll-a measurements and combinations or ratios of remote sensing reflectance derived at three or more wavelengths across the visible light spectrum depending on the satellite sensor (Lee, 2006; NASA, n.d.). Higher intensities of Chl-a absorbance wavelengths indicate lower phytoplankton biomass, while lower intensities indicate higher biomass. Hence, remote sensing data can help provide a comprehensive view of phytoplankton phenology and abundance in LI waters with its high spatiotemporal coverage.
Phenological Metrics
As objective metrics that can be acquired from each data pixel, the four phenological metrics, the timing of initiation, termination, peak, and duration—or the start date, end date, date of maximum Chl-a concentration, and length of annual phytoplankton growth periods—serve as important ecological indicators to understand seasonal dynamics and variation of phytoplankton blooms (Platt & Sathyendranath, 2008). Using Chl-a remote sensing data, phenological metrics can be derived at a low cost and high spatial and temporal resolutions, allowing long-term patterns and variability in phenology to be observed. These metrics were used in past studies to identify and analyze driving factors, recent trends, and regional patterns of phytoplankton phenology and bloom intensity (Gittings et al., 2017; Zoljoodi et al., 2022; Record et al., 2019).
Precipitation and river discharge contribute to phytoplankton growth by altering nutrient levels and the Redfield ratio
Phytoplankton requires nutrients to form organic compounds to grow and survive. Specifically, phytoplankton need carbon, N, and P in a 106:16:1 ratio, known as the Redfield ratio. Redfield (1934) found this proportion in phytoplankton biomass and dissolved nutrient pools by performing correlation analysis to find patterns in ratios of nitrate to carbonate, nitrate to oxygen, and carbonate to oxygen in water samples at various depths and stations located in the Sargasso Sea and comparing the observed ratios to other researchers’ findings. Imbalances in the Redfield ratio were shown to restrict phytoplankton growth through nutrient limitation. When in situ Thalassiosira spp. microalgae water samples with near Redfield nutrient ratios were enriched with silicon and nitrogen, growth rates were three times higher than control groups, demonstrating silicon and nitrogen limitation in Jamaica Bay, New York and the impact of imbalanced ratios on phytoplankton (Wallace & Gobler, 2015).
Alleviation of nutrient limitation is often attributed to N and P loading or runoff from precipitation or low-salinity river discharge. After rainfall events in Tampa Bay, Florida, nutrient levels of stormwater runoff in residential catchment, measured using the alkaline persulfate digestion method, significantly increased N and P by up to two folds (p < 0.05), causing N and P co-limitation and N-limitation respectively, indicating the effects of precipitation on altering nutrient ratios through atmospheric deposition and runoff of urban pollutants, such as soil sediment, plant debris, fertilizers, and pet waste (Yang & Toor, 2018). Gobler et al. (2006) found that nitrate and ammonium amendments during the summer in eastern LIS significantly increased Chl-a specific growth rates from less than -0.13 d-1 to greater than 1.25 d-1 (p < 0.001), while nutrient amendments during spring did not produce significant results. These results correspond with 15 times greater dissolved inorganic N and P levels during spring than summer and with the United States Geological Survey’s measurements of greater river water fluxes during the spring experiment, suggesting that higher spring discharge from the Connecticut rivers was reducing nutrient limitation.
Water column stratification influences driving factors of phytoplankton growth
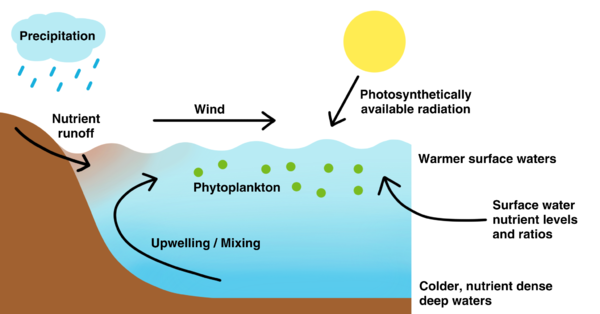
Stratification, in which the separation of the water column into distinct layers of differing temperature and density occurs, adjusts in response to changes in sea surface temperature (SST) and wind speed (WS), which influences surface water nutrient levels and photosynthetically available radiation (PAR)—significant driving factors of phytoplankton growth (Fig. 1). In a study done by Zoljoodi et al. (2021), geographically weighted regression showed that PAR and the timing of initiation of phytoplankton growth periods had a moderate to strong significant positive correlation with coefficient of determinations falling between 0.22 and 0.76 in most of the Persian Gulf (p < 0.05), indicating that the growth period starts after the light climate is improved from summer stratification, where high SST stabilizes the water column. Furthermore, significant correlations were observed between WS and chlorophyll-a concentration, showing that the break in stratification caused by deep winter mixings from cooling surface waters replenishes vital nutrients in the photic zone—the uppermost layer of the water column that receives enough sunlight for phytoplankton to carry out photosynthesis (Fig. 1). Similarly, earlier spring blooms were strongly correlated with greater stratification in the Gulf of Maine (r = -0.93, p < 0.01) (Record et al., 2019).
Figure 1. Interactions between phytoplankton, the water column, and physical, chemical, and climatic factors. Figure generated by author.
Impacts of climate change on phytoplankton threaten marine ecosystem health
Threats to marine ecosystems are emerging as ongoing changes in climate and environmental conditions, especially global warming, are significantly altering phytoplankton phenology and abundance, while organisms at higher trophic levels were shown to respond differently to increased temperatures (Edwards & Richardson, 2004). After using principal component analysis to group survey data measurements of different plankton species in the North Sea into their respective functional types, trophic mismatch was present as functional types varied significantly in their shifts in seasonality, with the timing of peak meroplankton, a secondary consumer, shifting earlier in the year by 27 days from 1958 to 2002 (p < 0.001), while that of diatoms, a primary producer, staying relatively static (Edwards & Richardson, 2004). Moreover, the effects of long-term decreases in North Sea phytoplankton from rising temperatures are evident as phytoplankton fluctuations strongly covaried with cod recruitment, explaining 27.87% of variation from principal component analysis (Beaugrand et al., 2003). The survival indexes of larval cod and plankton were also significantly correlated (r = 0.52, p < 0.001), indicating that lower cod survival is largely attributed to reduced phytoplankton productivity (Beaugrand et al., 2003).
Global warming also threatens marine ecosystems as it increases the intensity of HABs, like Cochlodinium polykrikoides blooms. Using the Theil-Sen trend estimator and Mann-Kendall test on data from previously published datasets, remote sensing satellites, and in situ stations, Griffith et al. (2019) revealed that warming temperatures since 1982 have increased the severity of C. polykrikoides blooms worldwide, increasing their cell doubling rates, peak cell density, and bloom duration along coasts of the US, South Korea, and Japan.
Objectives
This study aims (1) to uncover the patterns in phytoplankton phenology across Long Island’s coastal waters, thereby contributing to our understanding of marine ecosystem health; (2) to investigate the physical, chemical, and climatic factors that influence phytoplankton phenology and seasonal Chl-a abundance, which could help in predicting and managing harmful algal blooms; and (3) to scrutinize the interannual trends of phenological metrics and Chl-a levels and their significant driving factors, providing insights that could inform future research and conservation efforts.
Methods
Ocean-color data from satellites
Version 6 of the European Space Agency (ESA) Ocean Colour Climate Change Initiative (OC-CCI) product comprising merged, band-shifted, and bias-corrected data from MERIS (MEdium Resolution Imaging Spectrometer), MODIS (Moderate Resolution Imaging Spectroradiometer) Aqua, SeaWiFS (Sea-Wide Field of View Sensor) Local Area Coverage and Global Area Coverage, VIIRS (Visible Infrared Imaging Radiometer Suite), and OLCI (Ocean and Land Colour Instrument) for Chl-a measurements in mg/m3, available at https://www.esa-oceancolour-cci.org, were acquired from the NOAA ERDDAP data server as CSV files with a 0.0417° spatial resolution and as 8-day composites, where the average of measurements from 8-day periods are taken to limit missing data (Racault et al., 2014). A subset of the product was taken by acquiring the bounding box of data from 40.2°N to 41.4°N and from -74.5°E to -71.5°E from the 20-year period 2003-2022 to include the beginning of increased occurrences of brown tides in Peconic Estuary and Shinnecock Bay since 2004 and in Long Island’s south shore estuaries since 2007 while calculating interannual trends (Anderson et al., 2021). Missing data were interpolated by averaging the values of spatially adjacent pixels using Microsoft Excel (Version 2404). If data of adjacent pixels were unavailable, values of temporally adjacent pixels were averaged. The remaining missing data were left empty (Racault et al., 2012). Coordinates with more than 30% of missing data were omitted.
Ecological parameters remote sensing data
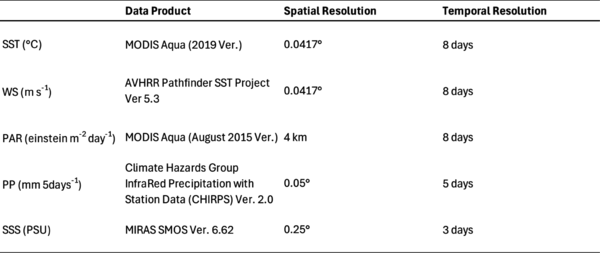
Remote sensing data for the five ecological parameters—sea surface temperature (SST), wind speed (WS), photosynthetically available radiation (PAR), precipitation (PP), and sea surface salinity (SSS)—were acquired from the ERDDAP database within the same bounding box as Chl-a (Table 1). Spatial resolutions were standardized by averaging their pixels to the 0.0417° resolution of the ESA OC-CCI Chl-a data product. PP only had land data, so the land data in the bounding box was averaged to create one overall measurement every 5 days. The lower spatial resolution of SSS was normalized with Chl-a data by averaging Chl-a data pixels to the 0.25° resolution of SSS. Same with the Chl-a data, missing values will be filled with the methodology from Racault et al. (2012).
Table 1. Remote sensing data products for sea surface temperature (SST), wind speed (WS), photosynthetically available radiation (PAR), precipitation (PP), and sea surface salinity (SSS), and their respective spatial and temporal resolutions.
On-site nutrient data
Surface water (2 m depth) nutrient data for total dissolved nitrogen (TDN) and total dissolved phosphorus (TDP) from 2003 to 2022 was retrieved from all 17 stations of the Connecticut Department of Energy and Environmental Protection (CTDEEP) Long Island Sound Water Quality and Hypoxia Monitoring Program. Monthly measurements were taken from each station throughout the year and additional bi-weekly measurements were taken during the summer. Additionally, the ratio of TDN:TDP concentrations will be calculated from this data.
Temporal distribution: establishing phytoplankton phenology
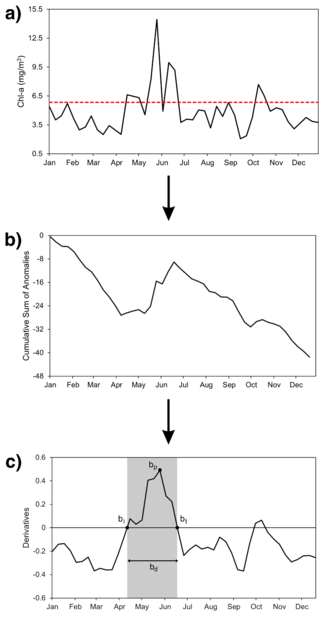
The four phenological metrics—timing of initiation (bi), peak (bp), termination (bt), and duration (bd) of annual phytoplankton growth periods—were extracted from each year in the 20-year period 2003-2022 for each Chl-a data coordinate from the ESA OC-CCI product using Microsoft Excel and following the threshold criterion and cumulative sum of anomalies methods adapted from Racault et al. (2015) as shown in Figure 2.
First, a threshold value, which acts as a baseline to determine the main phytoplankton growth period, was chosen by testing previous studies’ threshold values on 20 random samples of climatological series of Chl-a across LI’s coastal waters: the median Chl-a concentration plus 5% to 20% of the maximum concentration (Brody et al., 2013; Zoljoodi et al., 2022; Racault et al., 2015). Graphing the four thresholds (median + 5%, median + 10%, median + 15%, median + 20%) with 20 random samples of Chl-a climatological series (one random coordinate was chosen for each year in the 20-year period 2003-2022), the median + 10% of the maximum concentration was chosen as the best threshold value as it fell below the major peaks but above most of the small peaks of Chl-a climatologies (Zoljoodi et al., 2022). This chosen threshold is consistent with previous studies as Brody et al. (2013) found that thresholds of median + 10% to 15% of the maximum concentration accurately predicted initiation timing of phytoplankton blooms in subtropical regions after testing six thresholds of 5% to 30%. Furthermore, the 10% threshold was applied for the Red Sea, a body of water in a subtropical climate zone, like New York (Racault et al., 2015).
The threshold was subtracted from the 8-day composites of Chl-a, creating 8-day Chl-a anomalies, revealing the times of year when Chl-a levels deviate from the established norm. Chl-a concentrations below the threshold have an anomaly value less than 0, whereas concentrations above the threshold have an anomaly value greater than 0. By adding positive and negative anomalies, the cumulative sum of anomalies, taken over 8-day periods starting at the beginning of the climatology, eliminates high-frequency noise and reveals trends of persistent increases or decreases of Chl-a (Lozowski et al., 1989).
The derivatives of the cumulative sum of anomalies were computed, and the main growth period was defined as the time with the highest Chl-a peak and when derivatives were above 0. The dates when the derivatives fall above and below 0 represent bi and bt, respectively. The number of days of the growth period translates to bd. The date of maximum Chl-a concentration in the growth period translates to bp.
Figure 2. Step-by-step process of the threshold criterion and cumulative sum of anomalies methods adapted from Racault et al. (2015) to estimate annual phenological metrics. a) Chl-a time series (black line) with the median + 10% (dashed red line). The threshold is subtracted from the 8-day composite Chl-a values to create 8-day Chl-a anomalies. b) The cumulative sum of anomalies is taken starting at the beginning of the climatology, eliminating noise and revealing persistent increases or decreases of Chl-a (Lozowski et al., 1989). c) Derivatives of the cumulative sum of anomalies is calculated. The main growth period is defined as the time period where the derivatives are above 0 and include the highest Chl-a peak (Zoljoodi et al., 2022). The start, peak, end, and length of the growth period become bi, bp, bt, and bd, respectively. Figure generated by author.
Spatial distribution: stratifying coordinates and years
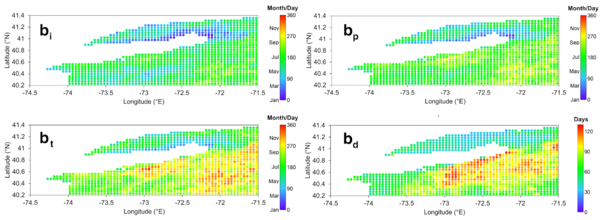
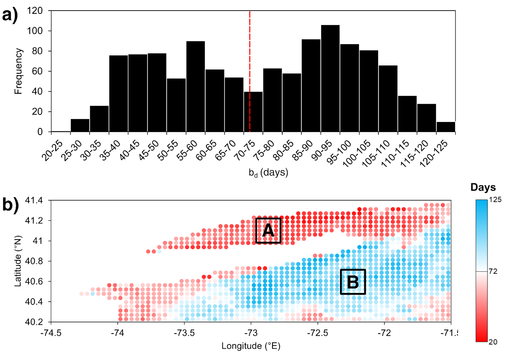
For each coordinate from the ESA OC-CCI Chl-a product, each of the four phenological metrics was averaged across the 20 year-period, and their spatial distributions were mapped (Fig. 3). These coordinates were stratified according to the bimodal distribution of bd, which exhibits two peaks separated by the median bd of 72 days (Fig 4a), forming Region A with bd shorter than 72 days, encompassing LIS and the southwestern shores of LI, and Region B with bd longer than 72 days, encompassing the southeastern shores of LI and the open seas, separated by transition-like boundaries between the two regions indicated by the lighter red and blue coordinates (Fig. 4b).
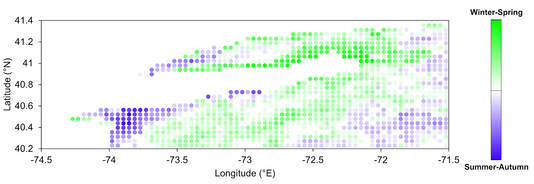
The years of each coordinate were further categorized into winter-spring (W-S) or summer-autumn (S-A) according to the season that bp falls into since main growth periods were found in both the first and second half of the year after establishing phenology (Fig. 5). Moreover, W-S and S-A phytoplankton blooms have been studied as two different entities for LI and the U.S. northeast coast (George et al, 2015; Anderson & Taylor, 2001; Gobler et al., 2006; Record et al., 2019). As a result, four groups are formed: W-S blooms in Region A (Region Aw-s), S-A blooms in Region A (Region As-a), W-S blooms in Region B (Region Bw-s), and S-A blooms in Region B (Region Bs-a).
Figure 3. Spatial distributions of average phytoplankton phenology (2003-2022). The color scales in the bi, bp, and bt maps indicate the day of year, whereas the color scale in the bd map indicates the number of days.
Figure 4. a) Bimodal histogram of average bd (n = 1197). Dashed red line indicates the median (72 days) splitting bd into two groups that correspond with Region A (20 < bd < 72) and Region B (72 < bd < 125). b) Spatial distribution of Region A (red) and Region B (blue) coordinates. The color scale indicates the length of bd.
Figure 5. Percentage of years with winter-spring (W-S) or summer-autumn (S-A) phytoplankton growth periods, as determined by bp. The growth period is W-S or S-A when bp falls within December-May or June-November, respectively. Bright green indicates all years being W-S, bright purple indicates all years being S-A, and white indicates an equal split between W-S and S-A.
Statistical analysis
To find the average phytoplankton seasonality of each Region Aw-s, Region As-a, Region Bw-s, and Region Bs-a, Chl-a data from the ESA OC-CCI product were averaged at 8-day intervals across all years of the coordinates in each of the four categories. Taking the normality test and Levene’s F-test on IBM SPSS, results were significant for both (p < 0.05), indicating unequal variances and non-normal data distribution, so the Dunnett’s C post-hoc test was carried out after ANOVA tests. Similarly, phenological metrics were averaged across all years of each group’s coordinates to find average phenology. T-tests were performed to find any differences in average phenology between groups.
For each of the four groups, regression analysis was performed in Microsoft Excel (Version 2404) to identify correlations between annual phenological metrics (bi, bp, bt, bd) from 2011-2019 and monthly means of the ecological parameters (SST, WS, PAR, SSS, PP, TDN, TDP, TDN:TDP) in the corresponding year. Correlation coefficients were also calculated to find relationships between seasonal means of Chl-a levels and those of the eight ecological parameters.
In Region A and Region B, linear trend analysis was performed to detect interannual trends from 2003-2022 in phenological metrics and seasonal and monthly averages of Chl-a levels and those of factors that showed significant correlation coefficients from regression analysis. Significance of all correlations were determined by computing the p-value from the t-statistic.
Results
Comparisons in phytoplankton seasonality and phenology between seasons and regions
The average phytoplankton seasonalities of W-S and S-A blooms in Region A and Region B were graphed by averaging at 8-day intervals of Chl-a data across all years of the coordinates in each of the four groups. Phenological metrics, estimated using the threshold criterion and cumulative sum of anomalies methods adapted from Racault et al. (2015), were also averaged across all years of each category’s coordinates to calculate the average phytoplankton phenology. T-tests and ANOVA tests followed by Dunnett’s C post-hoc tests were performed to find any differences in average phytoplankton phenology and seasonality between groups.
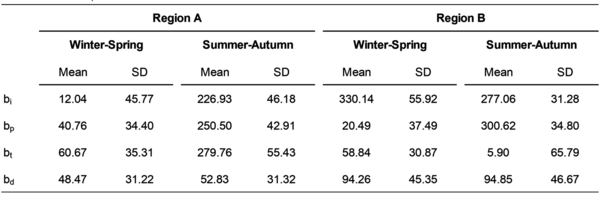
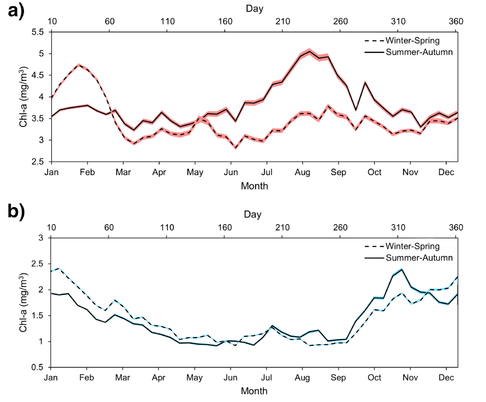
Phenological metrics between W-S and S-A blooms and between Region A and B of W-S and S-A blooms were found to be significantly different (p < 0.05), except for bd between Region Bw-s and Region Bs-a (Table 2). The growth periods of Region Bw-s and Region Bs-a both fell around late autumn and early winter, as shown in the overlapping appearance of their seasonalities, while Region Aw-s and Region As-a were more differentiated, falling around late winter and late summer, respectively (Fig. 6). Overall, bp of W-S blooms in Region A is 20.27 days later than Region B, while bp of S-A blooms in Region A is 50.12 days earlier than Region B (Table 2).
Chl-a levels were also significantly different between W-S and S-A blooms and between Region A and B. Overall, Region A had more than two times greater annual Chl-a levels than Region B at an average mean difference of 2.22 mg/m3 (p < 0.05). Within Region A, Chl-a levels of W-S blooms had higher Chl-a concentrations than S-A blooms at a mean difference of 0.33 mg/m3 (p < 0.05). However, there was no significance in Chl-a levels between W-S and S-A blooms in Region B.
Table 2. Means and SD of phenological metrics of WS and SA blooms in Region A and B (2003-2022). Means for bi, bp, and bt are shown as the day of year, and means for bd is shown as number of days.
Figure 6. Average phytoplankton seasonality of W-S (dashed line) and S-A (solid line) years in a) Region A and b) Region B (2003-2022). Red and blue shading indicates ±1 SEM.
Region A bloom phenology was driven by high SST and nutrients from river discharge, while Region B bloom phenology was driven by nutrients from upwelling and precipitation
After performing regression analysis between phenological metrics and monthly means of the eight ecological parameters, correlation coefficients showed that SST, nutrient levels, and factors associated with upwelling and runoff that increase surface water nutrient levels—SSS, WS, and PP—mainly drive phenology in Region A and Region B blooms.
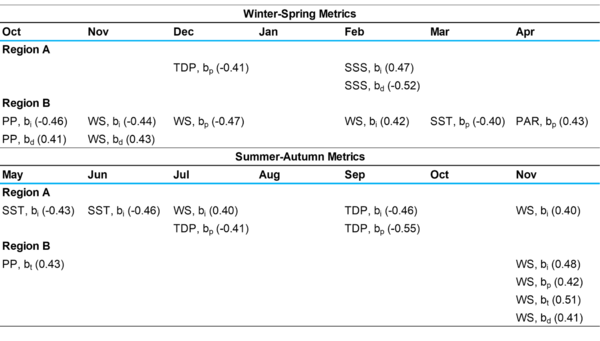
In Region A, moderate correlations were only found between W-S bloom phenology and TDP as well as SSS, indicating riverine nutrients as one of the main driving forces of phytoplankton growth and bloom timing (Table 3). Moderate negative correlations between TDP and bp and between SSS and bd suggest that higher December TDP levels and lower February SSS levels lead to earlier bp and longer bd of W-S blooms, respectively (r = -0.41, p < 0.001; r = -0.52, p < 0.001). Region As-a was also moderately associated with TDP but had additional correlations with WS and SST (Table 3). Higher SST in May and June and lower WS in July and November are all linked to earlier bi (r = -0.43, p < 0.001; r = -0.46, p < 0.001; r = 0.40, p < 0.001; r = 0.40, p < 0.001).
In Region B, the strongest correlations for phytoplankton blooms were mainly WS and PP, suggesting that nutrients from upwelling and runoff drive phenology (Table 3). For Region Bw-s, higher WS and PP are correlated with earlier bi, earlier bp, and longer bd at correlation coefficients greater than 0.40 (p < 0.001). Similar trends for WS and PP were observed for Region Bs-a, with PP moderately correlated with later bt and WS moderately correlated with later bt and longer bd (p < 0.001), further indicating that nutrients sourced from upwelling and runoff primarily increase phytoplankton productivity.
Table 3. Correlation coefficients between phenological metrics and monthly averages of the factors in each region. Only correlations in months before or within 2 SD of the mean phenology (Table 1) with |r| ≥ 0.40 and p < 0.05 are shown.
Nitrogen and phosphorus strongly limited phytoplankton productivity in Region A, and low SST and WS mainly increased Chl-a levels in Region B
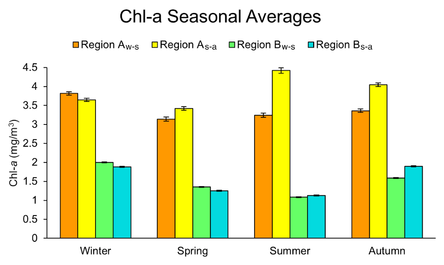
Seasonal Chl-a levels in Region A were found to be up to double to triple the levels in Region B with significantly different means between seasons and between regions after carrying out ANOVA and Dunnett’s C post-hoc tests (p < 0.05), except between spring and summer and autumn for Region Aw-s, between autumn and winter in Region Bs-a, and between Region Bw-s and Bs-a for winter and summer (Fig. 7). Within Region B, Chl-a levels were higher in the winter and autumn than the spring and summer (p < 0.05), while Chl-a levels varied in seasonal abundance between Region Aw-s and Region As-a.
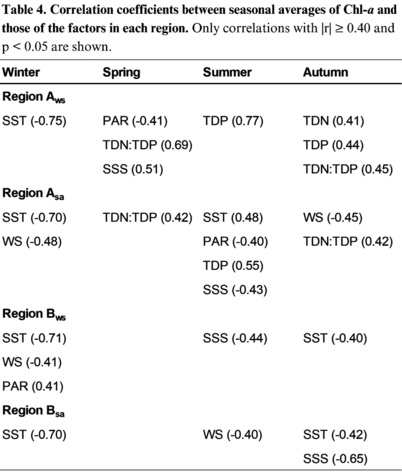
Consistent with driving factors of phenological metrics, higher seasonal Chl-a in Region A was moderate to strongly correlated with nutrients. Region Aw-s exhibited N-limitation during spring, P-limitation during summer, and N and P co-limitation during autumn (r = 0.69, p < 0.001; r = 0.77, p < 0.001; r > 0.40, p < 0.001) from performing regression analysis between TDN and TDP levels and ratios (Table 4). Similar nutrient limitations were found for Region As-a, but the correlation coefficients were weaker (r < 0.50, p < 0.001), and autumn only showed N-limitation.
In Region B, the trend of low SST driving greater Chl-a concentration occurred in winter and autumn for both W-S and S-A blooms, with the strongest correlations during winter (r = -0.71, p < 0.001; r = -0.70, p < 0.001). Strong negative correlations between winter Chl-a and SST were also prominent in Region A where Chl-a increased as SST decreased (r = -0.75, p < 0.001; r = -0.70, p < 0.001). In addition, higher Chl-a levels were associated with lower WS during winter Region Bw-s and during summer in Region Bs-a (r = -0.41, p < 0.001; r = -0.40, p < 0.001), opposite to the previous correlations of earlier timing of blooms and higher WS. This pattern also occurred during winter and summer in Region As-a (r = -0.48, p < 0.001; r = -0.45, p < 0.001), contradicting WS correlations with phenological metrics as well (Table 3).
Figure 7. Seasonal averages of Chl-a in WS and SA years in Region A and B (2011-2019). Error bars represent ±1 SEM.
Table 4. Correlation coefficients between seasonal averages of Chl-a and those of the factors in each region. Only correlations with |r| ≥ 0.40 and p < 0.05 are shown.
Decreasing interannual trends in phytoplankton productivity and TDN:TDP ratios were found in Region A
For Region A and Region B, linear trend analysis was performed to identify interannual trends in phenological metrics and in monthly and seasonal averages of Chl-a and those of significant driving factors of bloom phenology and seasonal Chl-a (Table 3, 4). The strongest significant trends were increasing and decreasing nutrient levels in Region A throughout the year. TDN:TDP ratios decreased across all months and seasons, except June and September, with the strongest trend in winter (r = -0.90, p < 0.05). Consistent with decreasing TDN:TDP ratios, TDN levels decreased in the 20-year period (r < -0.48, p < 0.05), while TDP levels increased (r > 0.50, p < 0.05).
Phenological metrics showed no significant interannual trends for both regions, but Region A showed strong and moderate decreasing trends of Chl-a in autumn and summer, respectively (r < -0.66, p < 0.05; r < -0.46, p < 0.05). Additionally, SST, WS, and PAR also showed moderate increasing trends and SSS showed moderate decreasing trends, but they only occurred in one season or a few months in the year (Fig. 8a). The trends of these three factors seem to be repeated in Region B, but decreasing trends of Chl-a in Region A were not observed in Region B (Fig. 8b).
Figure 8. Confidence matrices of interannual trends of monthly and seasonal chl-a and those of significant driving factors of phytoplankton spatiotemporal distribution (Table 2, Table 3) in a) Region A and b) Region B. Color scale indicates the strength of the correlation coefficient (r) values in the matrices. Trends with p < 0.05 are colored. Only factors with at least one significant trend were shown. All trends are from 2003-2022, except for SSS (2010-2022) and Jul-Dec for SST and for PAR (2003-2021).
Discussion
The goal of this study was to identify patterns in phytoplankton phenology across Long Island’s coastal waters, to investigate the factors attributing to differing patterns, and to examine the trends of phenology and driving factors in the last two decades.
Differences in phenology across LI waters may be attributed to source of nutrients and phytoplankton species
In Region Aw-s, significant correlations between earlier bi and bp with higher TDP and between longer bd with lower SSS possibly indicate river discharges from the Connecticut rivers, located north of LIS, as the dominant source of P as they provide low-salinity freshwater inputs (Gobler et al., 2006). On the other hand, Region B has no nearby river outlets to source nutrients from, thereby obtaining nutrients from upwelling and runoff, as suggested by strong correlations with WS and PP (Zoljoodi et al., 2022; Anderson & Taylor, 2001). Consequently, both W-S and S-A growth periods in Region B congregate in autumn and winter when surface waters cool and sink deeply into the water column, bringing nutrient-dense bottom waters to the surface (Fig. 1, 6). This corroborates with the Dilution-Recoupling Hypothesis from Behrenfeld (2010) that shows that bi is prompted in North Atlantic waters when the mixed layer becomes the deepest, not only increasing surface water nutrients but also “diluting” the water column of grazers, hence decreasing encounters between phytoplankton and zooplankton and reducing grazing pressure.
Although Region A benefits from increased nutrient availability from river discharge and exhibits two to three times higher Chl-a levels than Region B, the bd of Region A is, on average, 44 days shorter than Region B (Table 2). This may be attributed to larger-sized phytoplankton species in western LIS that require more nutrients and have higher nutrient-uptake rates; consequently, they quickly return to a nutrient-limited state (Gobler et al., 2006; Raven and Kubler, 2002).
Phytoplankton species can also explain the strong correlations between earlier bi and high SST and low WS in Region Aw-s, unlike Region As-a where bloom phenology largely relies on low SSS or nutrient-rich river discharge (Table 2). These results are consistent with past findings of global warming and greater stratification increasing the intensity of HABs and hypoxia, which are linked with specific species and phytoplankton functional types (PFTs), such as Cochlodinium polykrikoides, a dinoflagellate, and cyanobacteria, which gain a competitive advantage during thermal stratification as it enables their vertical migration to obtain PAR at surface waters and to draw nutrients from deeper waters (Griffith et al., 2019; Anderson & Taylor, 2001; EPA, 2013).
Seasonal variation in Chl-a levels is likely due to nutrient availability, shifts in species dominance, and off-shelf transport
In this study, N-limitation and P-limitation were observed during spring and summer respectively, which was partially consistent with the findings of Gobler et al. (2006) where dissolved inorganic N and P levels in WLIS during spring were 15 to 19 times higher than those during summer, resulting in greater N-limitation during the spring than summer. However, P enrichment experiments from Gobler et al. (2006) yielded no significant increases in phytoplankton growth across LIS for both spring and summer, while our findings exhibited P-limitation in summer and autumn, possibly due to new nitrogen reduction programs introduced since the 2000 and 2001 experiments of Gobler et al. (2006) (CTDEEP, 2022; NYDEC, n.d.).
From correlations between seasonal Chl-a and ecological parameters, SST was among the strongest factors driving Chl-a. In Region A, higher SST was moderately correlated with higher summer Chl-a levels for S-A blooms (r = 0.48, p < 0.001), and lower SST was strongly correlated with lower winter Chl-a levels for both W-S and S-A blooms (r = -0.75, p < 0.001; r = -0.70, p < 0.001). In Region B, low SST showed moderate to strong correlations with high Chl-a levels during autumn and winter (r < -0.40, p < 0.001; r < -0.70, p < 0.001). This may suggest seasonal shifts in species dominance in LI waters due to differing temperature tolerances. PFTs like flagellates and cyanobacteria prosper in high temperatures, while pelagophytes such as LI brown tide species Aureococcus anophagefferens can not tolerate temperatures above 25°C and start declining during the summer (Rice & Stewart, 2013; Gobler & Sunda, 2012). Additionally, strong correlations between autumn Chl-a and low SST in Region B and the absence of this relationship in Region A further support that S-A blooms follow the Dilution-Recoupling Hypothesis established by Behrenfeld (2010) and primarily source nutrients from deep winter mixings.
Several strong correlations were also found between low WS and high seasonal Chl-a levels, which is opposite from our findings of higher WS increasing phytoplankton growth earlier in the year. These contradictory results may be attributed to off-shelf transport, where high WS pushes phytoplankton biomass off the coasts and into the open seas, which occurs more frequently along coasts with wider shelf widths (Botsford et al., 2003). Therefore, WS may play ambivalent roles, increasing phytoplankton productivity through upwelling and water mixings and decreasing coastal phytoplankton populations through off-shelf transport. The potential roles of shelf-width and WS on decreasing phytoplankton growth were unexpected findings and an improved understanding of these two factors may be necessary to evaluate bloom dynamics along LI coasts.
Decreasing summer and autumn phytoplankton productivity could be explained by N-limitation and weakened stratification
Investigating interannual trends in Chl-a and ecological parameters, strong decreasing trends in summer and autumn Chl-a across 2003-2022 were found in Region A. This reduction in phytoplankton productivity may be attributed to the strong decreasing trends of TDN:TDP supported by decreasing TDN and increasing TDP levels (Fig. 10a), thereby exacerbating N-limitation found occurring in autumn from seasonal correlation analysis (Table 4). Although summer temperatures are rising (r = 0.60, p < 0.05; r = 0.53, p < 0.05), which were shown in past studies to strengthen stratification and increase phytoplankton production and hypoxia, their effects may have been canceled by increasing trends of WS (r = 0.52, p < 0.01) that could have weakened stratification (Griffith et al., 2019; Anderson & Taylor, 2001; EPA, 2013).
Decreasing interannual trends of TDN levels may be the effects of recent programs targeted towards reducing nitrogen levels in LI waters, including the Total Maximum Daily Load (TMDL) by the Environmental Protection Agency (EPA) from 2000 and the Long Island Nitrogen Action Plan (LINAP) from 2015 (CTDEEP, 2022; NYDEC, n.d.). These programs may need to be reassessed to consider the impacts of increased N-limited phytoplankton on LI’s ecosystems and fisheries.
Limitations
Although remote sensing data provides large spatial coverage and enables long-term analysis, ocean color satellites can not capture data below the surface of the water, and Chl-a data may not be precise due to cloudy conditions and other suspended terrigenous material present in bodies of water, especially coastal areas, that can interfere with the measurements of ocean color remote sensing satellites and hinder their accuracy (Racault et al., 2015; Aurin & Dierssen, 2012). Furthermore, not all missing values in the remote sensing data products for Chl-a and the ecological parameters were qualified to be interpolated spatially and temporally, which may have also affected the accuracy of the data. To evaluate the confidence in the use of these remote sensing products, in situ data could be matched with satellite data for validation (Gittings et al., 2017).
Moreover, remote sensing data products acquired from the ERDDAP database had inconsistent spatial and temporal resolutions, and not all variables had data available from 2003-2022 due to limited options. This study worked around this by standardizing resolutions through taking monthly, seasonal, and spatial averages and adjusting time periods for correlation and linear regression analysis.
Additionally, no public-access remote sensing or on-site nutrient data was found for areas outside of LIS. Thus, this study was only able to analyze the effects of TDN and TDP levels and ratios on Region A. Phytoplankton phenology and seasonal abundance in Region B exhibited strong correlations with high WS, low SST, and high PP, indicating increased phytoplankton growth from obtaining nutrients from upwelling, water mixings, and runoff (Table 3, 4), but specific nutrients that were involved in this process could not be identified.
Because of the nature of this study to use a threshold value to determine the growth period and phenological metrics, the choice of the threshold may slightly influence the accuracy and consistency of the results. Furthermore, this threshold value and the study only focuses on Long Island’s coastal waters, so the findings may not be applicable to other regions.
Future research
Although this study stratified LI’s coastal waters into four categories and two regions according to bd and bp (Fig. 4, 5), the spatial distribution of phytoplankton phenology and abundance should be further investigated in smaller regions and at the coordinate level to identify areas vulnerable to fluctuations in phytoplankton growth. In the future, the spatial distribution of the strength of correlation coefficients between phenological metrics and ecological parameters and between Chl-a levels and ecological parameters can be mapped as well (Zoljoodi et al., 2022). To capture a more comprehensive picture of phytoplankton bloom dynamics, remote sensing measurements could be combined or compared with in situ measurements as well (Gittings et al., 2017).
Since this study found that phytoplankton species and PFTs may contribute to the timing and abundance of phytoplankton blooms due to their differing temperature tolerances and environmental preferences, more data for these two factors should be collected to identify the specific species and PFTs. Similarly, nutrient data in Region B or LI southeastern shores should be collected to determine the specific nutrients that primarily drive increased phytoplankton growth during upwelling, deep winter mixings, and nutrient runoff. In addition, this study also found that the Dilution-Recoupling Hypothesis from Behrenfeld (2010) may impact phytoplankton spatiotemporal distribution in Region B, so the factor of grazing pressure should be assessed in future studies.
Future research could also seek to investigate the long-term effects of decreased phytoplankton productivity on LI’s marine ecosystems and fisheries. Linear trend analysis produced strong decreasing trends of summer and autumn phytoplankton productivity in the recent 20 years, which can have implications for food web imbalances and trophic mismatch (Edwards & Richardson, 2004; Beaugrand et al., 2003).
Conclusion
The objective of this study was to identify regions across LI’s coastal waters with contrasting patterns in phytoplankton phenology, investigate the factors driving regional differences in phytoplankton phenology and seasonal abundance, and analyze their long-term patterns. By using 20-year remote sensing datasets covering large areas over time, this study provides a comprehensive view of phytoplankton phenology and abundance in Long Island’s coastal waters. Winter-spring (W-S) and summer-autumn (S-A) blooms in Region A, encompassing LIS and the southwestern shores of LI, peaked in late winter and late autumn and are primarily driven by P-rich river discharges and thermal stratification, respectively. Both W-S and S-A blooms in Region B, the southeastern shores of LI, initiate in autumn as they thrive from colder surface waters that deepen the mixed layer, increasing surface water nutrients and reducing grazing pressure. Although Region A had higher Chl-a levels and greater access to nutrients throughout the year from river outlets, bd in Region A is 44 days shorter than Region B, likely due to more nutrient-limited phytoplankton in LIS. Seasonal variation in Chl-a is attributed to sea surface temperature (SST) due to differing temperature tolerances of seasonal dominant species, high wind speeds that facilitate off-shelf transport, and N- and P-limitations. Consequently, heightened autumn N-limitation and decreased summer SST led to reduced phytoplankton production in Region A in the past 20 years. Results from this study enhance our understanding of the factors influencing phytoplankton phenology and abundance in Long Island’s coastal waters, which could help in predicting and managing harmful algal blooms.
Acknowledgments
I gratefully thank Ms. Nicole Spinelli for providing guidance, feedback, and support throughout this study and on this manuscript. Thanks to Dr. Magaly Koch for introducing remote sensing to me and Ms. Diana Tosato for her useful comments on this research. Finally, I would also like to thank Matthew Lyman and Mary Becker from the Connecticut Department of Energy and Environmental Protection (CTDEEP) Water Quality and Hypoxia Monitoring Program for sharing the 2003-2022 surface water nutrient data used in this study.
Bibliography
Anderson, D. M., Fensin, E., Gobler, C. J., Hoeglund, A. E., Hubbard, K. A., Kulis, D. M., Landsberg, J. H., Lefebvre, K. A., Provoost, P., Richlen, M. L., Smith, J. L., Solow, A. R., & Trainer, V. L. (2021). Marine harmful algal blooms (HABs) in the United States: History, current status and future trends. Harmful Algae, 102, 101975. https://doi.org/10.1016/j.hal.2021.101975
Anderson, T. H., & Taylor, G. T. (2001). Nutrient Pulses, Plankton Blooms, and Seasonal Hypoxia in Western Long Island Sound. Estuaries, 24(2), 228. https://doi.org/10.2307/1352947
Aurin, D. A., & Dierssen, H. M. (2012). Advantages and limitations of ocean color remote sensing in CDOM-dominated, mineral-rich coastal and estuarine waters. Remote Sensing of Environment, 125, 181–197. https://doi.org/10.1016/j.rse.2012.07.001
Banta, G. T., Pedersen, M. F., & Nielsen, S. L. (2004). Decomposition of Marine Primary Producers: Consequences for Nutrient Recycling and Retention in Coastal Ecosystems. Estuarine Nutrient Cycling: The Influence of Primary Producers (pp. 187–216). Springer Netherlands. https://doi.org/10.1007/978-1-4020-3021-5
Beaugrand, G., Brander, K. M., Alistair Lindley, J., Souissi, S., & Reid, P. C. (2003). Plankton effect on cod recruitment in the North Sea. Nature, 426(6967), 661–664. https://doi.org/10.1038/nature02164
Behrenfeld, M. J. (2010). Abandoning Sverdrup’s Critical Depth Hypothesis on phytoplankton blooms. Ecology, 91(4), 977–989. https://doi.org/10.1890/09-1207.1
Botsford, L. W., Lawrence, C. A., Dever, E. P., Hastings, A., & Largier, J. (2003). Wind strength and biological productivity in upwelling systems: an idealized study. Fisheries Oceanography, 12(4-5), 245–259. https://doi.org/10.1046/j.1365-2419.2003.00265.x
Brody, S. R., Lozier, M. S., & Dunne, J. P. (2013). A comparison of methods to determine phytoplankton bloom initiation. Journal of Geophysical Research: Oceans, 118(5), 2345–2357. https://doi.org/10.1002/jgrc.20167
CTDEEP. (2022). Long Island Sound Hypoxia & Nitrogen Reduction Efforts. CT.gov. https://portal.ct.gov/deep/water/lis-monitoring/lis-hypoxia-and-nitrogen-reduction-efforts
Edwards, M., & Richardson, A. J. (2004). Impact of climate change on marine pelagic phenology and trophic mismatch. Nature, 430(7002), 881–884. https://doi.org/10.1038/nature02808
EPA. (2013). Impacts of Climate Change on the Occurrence of Harmful Algal Blooms. https://www.epa.gov/sites/default/files/documents/climatehabs.pdf
Falkowski, P. (2012). Ocean Science: The power of plankton. Nature, 483(7387), S17–S20. https://doi.org/10.1038/483s17a
George, J. A., Lonsdale, D. J., Merlo, L. R., & Gobler, C. J. (2015). The interactive roles of temperature, nutrients, and zooplankton grazing in controlling the winter-spring phytoplankton bloom in a temperate, coastal ecosystem, Long Island Sound. Limnology and Oceanography, 60(1), 110–126. https://doi.org/10.1002/lno.10020
Gittings, J. A., Raitsos, D. E., Racault, M.-F., Brewin, R. J. W., Pradhan, Y., Sathyendranath, S., & Platt, T. (2017). Seasonal phytoplankton blooms in the Gulf of Aden revealed by remote sensing. Remote Sensing of Environment, 189, 56–66. https://doi.org/10.1016/j.rse.2016.10.043
Gobler, C. J., Buck, N. J., Sieracki, M. E., & Sañudo-Wilhelmy, S. A. (2006). Nitrogen and silicon limitation of phytoplankton communities across an urban estuary: The East River-Long Island Sound system. Estuarine, Coastal and Shelf Science, 68(1-2), 127–138. https://doi.org/10.1016/j.ecss.2006.02.001
Gobler, C. J., & Sunda, W. G. (2012). Ecosystem disruptive algal blooms of the brown tide species, Aureococcus anophagefferens and Aureoumbra lagunensis. Harmful Algae, 14, 36–45. https://doi.org/10.1016/j.hal.2011.10.013
Griffith, A. J., Doherty, O. M., & Gobler, C. J. (2019). Ocean warming along temperate western boundaries of the Northern Hemisphere promotes an expansion of Cochlodinium polykrikoides blooms. Proceedings of the Royal Society B, 286(1904), 20190340–20190340. https://doi.org/10.1098/rspb.2019.0340
Lozowski, E. P., Charlton, R. B., Nguyen, C. D., & Wilson, J. D. (1989). The Use of Cumulative Monthly Mean Temperature Anomalies in the Analysis of Local Interannual Climate Variability. Journal of Climate, 2(9), 1059–1068. https://www.jstor.org/stable/26196228
NASA. (n.d.). NASA Ocean Color. Oceancolor.gsfc.nasa.gov. https://oceancolor.gsfc.nasa.gov/resources/atbd/chlor_a/
NYDEC. (n.d.). Long Island Nitrogen Action Plan (LINAP). Dec.ny.gov. https://dec.ny.gov/nature/waterbodies/oceans-estuaries/linap
Parker, C. A., & O’Reilly, J. E. (1991). Oxygen Depletion in Long Island Sound: A Historical Perspective. Estuaries, 14(3), 248. https://doi.org/10.2307/1351660
Platt, T., & Sathyendranath, S. (2008). Ecological indicators for the pelagic zone of the ocean from remote sensing. Remote Sensing of Environment, 112(8), 3426–3436. https://doi.org/10.1016/j.rse.2007.10.016
Poddar, S., Chacko, N., & Swain, D. (2019). Estimation of Chlorophyll-a in Northern Coastal Bay of Bengal Using Landsat-8 OLI and Sentinel-2 MSI Sensors. Frontiers in Marine Science, 6, 598. https://doi.org/10.3389/fmars.2019.00598
Racault, M. F., Le Quéré, C., Buitenhuis, E., Sathyendranath, S., & Platt, T. (2012). Phytoplankton phenology in the global ocean. Ecological Indicators, 14(1), 152–163. https://doi.org/10.1016/j.ecolind.2011.07.010
Racault, M. F., Raitsos, D. E., Berumen, M. L., Brewin, R. J. W., Platt, T., Sathyendranath, S., & Hoteit, I. (2015). Phytoplankton phenology indices in coral reef ecosystems: Application to ocean-color observations in the Red Sea. Remote Sensing of Environment, 160, 222–234. https://doi.org/10.1016/j.rse.2015.01.019
Racault, M. F., Sathyendranath, S., & Platt, T. (2014). Impact of missing data on the estimation of ecological indicators from satellite ocean-colour time-series. Remote Sensing of Environment, 152, 15–28. https://doi.org/10.1016/j.rse.2014.05.016
Raven, J. A., & Kubler, J. E. (2002). New light on the scaling of metabolic rate with the size of algae. Journal of Phycology, 38(1), 11–16. https://doi.org/10.1046/j.1529-8817.2002.01125.x
Record, N. R., Balch, W. M., & Stamieszkin, K. (2019). Century-scale changes in phytoplankton phenology in the Gulf of Maine. PeerJ, 7, e6735. https://doi.org/10.7717/peerj.6735
Redfield, A. C. (1934). On the proportions of organic derivatives in sea water and their relation to the composition of phytoplankton (Vol. 1). Liverpool: university press of liverpool.
Rice, E., & Stewart, G. (2013). Analysis of interdecadal trends in chlorophyll and temperature in the Central Basin of Long Island Sound. Estuarine, Coastal and Shelf Science, 128, 64–75. https://doi.org/10.1016/j.ecss.2013.05.002
Ryther, J. H. (1954). The Ecology of Phytoplankton Blooms in Moriches Bay and Great South Bay, Long Island, New York. The Biological Bulletin, 106(2), 198–209. https://doi.org/10.2307/1538713
Suter, E. A., Lwiza, K. M. M., Rose, J. M., Gobler, C., & Taylor, G. T. (2014). Phytoplankton assemblage changes during decadal decreases in nitrogen loadings to the urbanized Long Island Sound estuary, USA. Marine Ecology Progress Series, 497, 51–67. https://doi.org/10.3354/meps10602
Vaquer-Sunyer, R., & Duarte, C. M. (2008). Thresholds of hypoxia for marine biodiversity. Proceedings of the National Academy of Sciences, 105(40), 15452–15457. https://doi.org/10.1073/pnas.0803833105
Varekamp, J. C. (2004). Environmental change in Long Island Sound in the recent past: eutrophication and climate change. Third, 12. https://www.academia.edu/20632584/Environmental_change_in_Long_Island_Sound_in_the_recent_past_eutrophication_and_climate_change?hb-sb-sw=22017478
Wallace, R. B., & Gobler, C. J. (2015). Factors Controlling Blooms of Microalgae and Macroalgae (Ulva rigida) in a Eutrophic, Urban Estuary: Jamaica Bay, NY, USA. Estuaries and Coasts, 38(2), 519–533. https://doi.org/10.1007/s12237-014-9818-1
Yang, Y. Y., & Toor, G. S. (2018). Stormwater runoff driven phosphorus transport in an urban residential catchment: Implications for protecting water quality in urban watersheds. Scientific Reports, 8(1), 11681. https://doi.org/10.1038/s41598-018-29857-x
Zhu, L., Suomalainen, J., Liu, J., Hyyppä, J., Kaartinen, H., & Haggren, H. (2018). A Review: Remote Sensing Sensors. In www.intechopen.com (pp. 19–42). IntechOpen.
Zoljoodi, M., Moradi, M., & Moradi, N. (2022). Seasonal and interannual cycles of total phytoplankton phenology metrics in the Persian Gulf using ocean color remote sensing. Continental Shelf Research, 237, 104685. https://doi.org/10.1016/j.csr.2022.104685
Document information
Published on 02/08/24
Submitted on 18/07/24
Volume 6, 2024
Licence: CC BY-NC-SA license
Share this document
Keywords
claim authorship
Are you one of the authors of this document?

