Abstract
The regional climate model RegCM4 was used to investigate the regional climate effects of land cover change over China. Two 24-year simulations (1978–2001), one with the land cover derived from the MODIS data and the other with the CLCV (Chinese land cover derived from vegetation map) data, were conducted for a region encompassing China. The differences between the MODIS and CLCV data reflect characteristics of desertification and degradation of vegetation in China. Results indicate that the land cover change has important impacts on local climate through mechanisms related to changes in surface energy, water budgets and macro-scale circulation. In summer, the land cover change leads to a decrease in surface air temperature over southern China, a reduction in precipitation and an increase in surface air temperature in the transitional climate zone and the northern Tibetan Plateau, and an increase in inter-annual variability of surface air temperature in the marginal monsoon zone and northwestern China. Strengthened southwesterly winds increase precipitation to some extent in central and eastern Inner Mongolia by enhancing water vapor transport. In winter, enhanced northerly winds, bringing more dry and cold air, lead to a reduction in precipitation and temperature over areas south of the Yellow River.
Keywords
land cover change ; regional climate change ; RegCM4 ; CLM3.5
1. Introduction
Land cover plays an important role in the water and energy balance between land and atmosphere. Changes in land cover affect surface albedo, surface roughness, soil water and thermal characteristics, which further influence the climate. Due to the combined effects of natural climate variability, overgrazing, reclamation of land for cultivation, deforestation, and other human activities, land cover has significantly changed and further influences the natural environment, climate variability and extreme weather events [ Li and Ding, 2004 ]. Therefore, studies on the effect of land cover change on climate improve our understanding of climate change and the natural environment. Charney [1975] first studied the potential impact of vegetation changes in desert border regions in the 1970s. Hereafter, many studies showed that a wide range of changes in vegetation cover has impacts of varying degrees on the regional climate and the natural environment and the impact degrees depend on the studies’ temporal and spatial scales and the environment sensitivity of an area [ Shukla et al., 1990 , Xue, 1996 , Douglas et al., 2000 , Zhang et al., 2009a and Zhang et al., 2009b ]. Researches in China have also provided insights on the climate effects of land cover changes, but these studies typically used only one vegetation type in a model grid with unlikely and unrealistic experimental designs such as replacing grassland with desert or vice versa over extended areas [ Zhou and Chen, 1995 and Lü and Chen, 1999 ; Ding et al., 2005 ; Gao et al., 2007 ; Zhang et al., 2009a; 2009b; 2009c].
In this study, we chose two land cover datasets which basically reflect land cover changes in China during the end of the 20th century. One is the CLCV data (Chinese land cover derived from vegetation map) [ Chen and Xie, 2009 ], which is based on the 1:1,000,000 Vegetation Atlas of China [ Hou, 2001 ], representing the land surface conditions from the 1980s to the 1990s. The other dataset is the MODIS data (moderate resolution imaging spectroradiometer) [ Lawrence and Chase, 2007 ], which is based on satellite remote sensing data from November 2000 to October 2001. Consistent with previous studies on land cover changes [ Zha and Gao, 1997 , Piao and Fang, 2001 , Liu et al., 2002a and Zhang et al., 2005b , the differences between the MODIS and CLCV datasets demonstrate characteristics of desertification and degradation of vegetation over China at the end of the 20th century. Using the regional climate model RegCM4 with its land surface scheme CLM3.5, in which plant functional types are simultaneously considered in one model grid, the regional climate effects of land cover changes over China were investigated. Two 24-year simulations (1978–2001) using both land cover datasets were conducted for a region encompassing China.
2. Land surface data and study domain
For its integration in the Community Land Model, Lawrence and Chase [2007] developed the MODIS land surface dataset based on the MODIS satellite remote sensing data from November 2000 to October 2001. For reducing the uncertainties of satellite data, Chen and Xie [2009] developed the CLCV dataset based on the Vegetation Atlas of China (1:1,000,000). The data reflects the land surface conditions from the 1980s to the 1990s. On the simulation, they investigated the impacts on land surface processes. The CLCV data production process began with the classification of vegetation maps into 8 categories: bare soil, forest, shrub, grass, crop, glacier, lake and wetland. Secondly, needleleaf and broadleaf forests were divided into evergreen and deciduous forests using the AVHRR (advanced very high resolution radiometer) Continuous Fields Tree Cover of the University of Maryland. Then the proportion of forest cover in the vegetation maps was identified. Thirdly, using mean precipitation, temperature and accumulated temperature data from 753 weather stations in China for 40 years (1960–1999), forest, shrub, and grass were further separated into tropical, temperate, and boreal categories. In doing so, the area ratios of glacier, lake, wetland, and 16 plant functional types, which are the same as in the Community Land Model, were extracted from the vegetation maps. These vegetation types include bare soil, temperate needleleaf evergreen forest, boreal needleleaf evergreen forest, boreal needleleaf deciduous forest, tropical broadleaf evergreen forest, temperate broadleaf evergreen forest, tropical broadleaf deciduous forest, temperate broadleaf deciduous forest, boreal broadleaf deciduous forest, temperate broadleaf evergreen shrub, temperate broadleaf deciduous shrub, boreal deciduous shrub, arctic C3 grass, non-arctic C3 grass, C4 grass, and crops. Both datasets have a resolution of 0.5° latitude by 0.5° longitude.
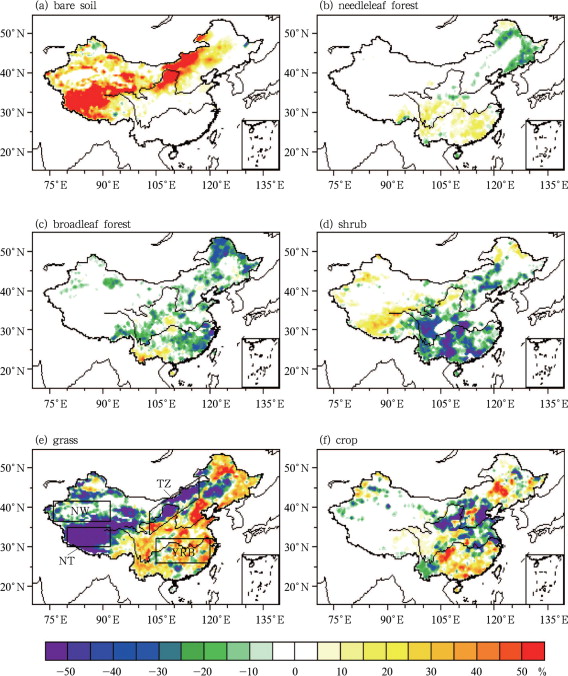
In our study, we reduced the 16 plant functional types to 6 broad categories for convenience of comparison. The differences of MODIS and CLCV (Fig. 1 ) show an increase in bare soil and degradation of natural vegetation over China. The scope of desertification in northern China is consistent with the results of Zha and Gao [1997] and Zhang et al. [2005b]. We can detect serious desertification over the transitional climate zone including Inner Mongolia, Ningxia province, and south of Gansu province. Moreover, significant desertification also exists in the Qilian Mountains, Kunlun Mountains, Tianshan Mountains, and the central and western Tibetan Plateau (Fig. 1 a&1e). Piao and Fang [2001] showed that the NDVI (normalized difference vegetation index) in the western Tibetan Plateau and Northwest China decreased significantly during the last two decades of the 20th century. Land cover changes in Northeast China are consistent with the findings of Liu et al. [2002a] . Bare soil and crops replaced grassland in the Northeast Plain, and forests degraded to grassland in the mountain areas in Northeast China (Fig. 1 b&1c). However, vegetation cover change in southern China is more complicated and is greatly influenced by human activities [ Liu et al., 2002b ], mainly displaying changes from broadleaf forest and shrub to grassland and crops (Fig. 1 c–1 f). Therefore, we preliminarily believe that the differences of the two datasets can basically describe the characteristics of land cover changes at the end of the 20th century. For convenience of analysis, we chose four sub-regions based on the climate and land cover change characteristics (Fig. 1 e). Sub-region TZ has a semiarid climate and is located in a transitional climate zone between the humid monsoon area and the inland arid region. Sub-region NT is located in the northern Tibetan Plateau, which has a semiarid climate. Sub-region NW is located in Northwest China and is characterized by an arid climate. In Table 1 , it is illustrated that these arid and semiarid regions have undergone serious desertification, especially in the sub-region NT where more than 60% of grassland has turned into bare soil. Sub-region YRB represents a humid climate and is located in southern China. An obvious degradation of vegetation is found in YRB.
|
|
|
Figure 1. Differences of vegetation cover types between MODIS data and CLCV data in China (TZ: transitional climate zone, NT: northern Tibetan Plateau, NW: Northwest China, and YRB: Yangtze River Basin)
|
| Sub-region | Bare soil | Needleleaf forest | Broadleaf forest | Shrub | Grass | Crop |
|---|---|---|---|---|---|---|
| TZ | 41.8 | –0.1 | –2.4 | –0.5 | –24.0 | –14.9 |
| NT | 63.1 | 0.1 | 0.1 | 12.3 | –75.7 | 0.2 |
| NW | 14.4 | 0.0 | –1.2 | 1.0 | –11.5 | –2.7 |
| YRB | 0.6 | 5.7 | –9.8 | –18.9 | 17.5 | 4.9 |
3. Model description and experimental design
The Abdus Salam International Center for Theoretical Physics (ICTP) RegCM4 [ Giorgi et al., 2012 ] is employed in this study. The model is successfully coupled with CLM3.5 [ Oleson et al., 2008 ], improving the descriptions of physical, chemical, and biological processes of the land surface. In addition, it has improved radiative cloud representation and aerosol radiative transfer calculations.
The study domain includes continental China and its surrounding areas, and is centered at 36°N/102°E, with a grid size of 60 km and 120×90 grid points. There are 18 vertical levels with 50 hPa at the model top. Two experiments are conducted: 1) a control run (denoted as RCM_C) using CLCV land surface dataset over continental China and MODIS data outside China; and 2) a comparative run (denoted as RCM_M), where MODIS land surface data for the entire domain is used. Each simulation utilizes the European Centre for Medium-Range Weather Forecast (ECMWF) 40-year reanalysis dataset and the British Atmospheric Data Center monthly mean sea surface temperature as initial and lateral conditions. The Grell scheme with Fritsch and Chappell closure as the cumulus convective scheme, and CLM3.5 is also used. The boundary fields, which are inputted into the model once every 6 hours, adopt exponential relaxation techniques. Both simulations are conducted from January 1, 1978 to January 1, 2002 with a time step of 120 s, the first 4 years are used for spin-up and the last 20 years are selected for analysis.
The results of the RCM_C run compared with observations (not shown) indicate that RegCM4 performs well at capturing the spatial patterns of surface temperature and precipitation, but there is a systematic cold bias similar to the simulations of RegCM3 [ Zhang et al., 2005a ]. Precipitation has a positive bias over northern China and a negative bias over southern China. Nonetheless, RegCM4 captures the summer characteristics much better than the winter characteristics.
4. Effects of land cover changes on regional climate
4.1. Spatial variability
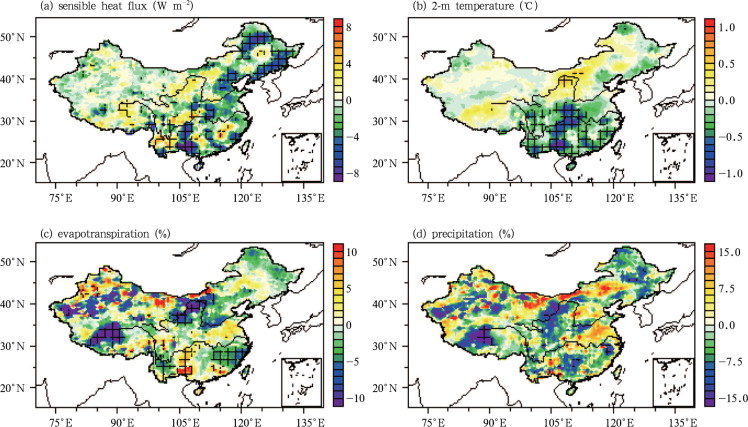
Figure 2 and Figure 3 show the differences of sensible heat flux, 2-m air temperature, evapotranspiration, and rainfall between the RCM_M run and the RCM_C run. We carried out the t -test to calculate the statistical significance of the differences. In summer, the sensible heat flux increases in the middle of the Yellow River Basin, the center of the Tibetan Plateau, and parts of southern China, and decreases in most parts of eastern China. The reduction in Guizhou and Guangxi provinces is more than 8 W m–2 (Fig. 2 a). Changes in the energy balance influence the surface air temperature. The 2-m air temperature increases in sub-region TZ by 0.5°C over the middle reaches of the Yellow River and by less than 0.5°C in the central Tibetan Plateau. A significant large-range cooling is found south of 35°N in central-eastern China, especially in Guangxi province by over 1°C (Fig. 2 b). Decreases in 2-m air temperature in most areas are significant at the 95% confidence level. Large increases of bare soil result in decreases in evapotranspiration by more than 10% over sub-region TZ and sub-region NT (Fig. 2 c). Increases in evapotranspiration in eastern sub-region TZ are caused by increases in ground evaporation (not shown). Although shrubs show an important decrease in Chongqing city, Guizhou province, and Guangxi province, total evapotranspiration rises significantly (Fig. 2 c), possibly due to precipitation increase (Fig. 2 d). Evapotranspiration declines significantly in the southern half and lower reaches of the Yangtze River because of broadleaf forests decrease. The decline also occurs over the southern region of Xinjiang with the largest decrease being more than 10% (Fig. 2 c). The decrease in rainfall in subregion NT and the southwest of sub-region TZ exceeds 15%. The spatial pattern of the rainfall differences in sub-region NT is similar to that of evapotranspiration changes, indicating that local evapotranspiration could be the dominant factor affecting precipitation in this region. Rainfall and evapotranspiration changes are very heterogeneous in sub-region NW. Rainfall also decreases south of the Yangtze River, in most regions of Northeast and Northwest China, areas between Kunlun Mountains, Tianshan Mountains and Tarim Basin (Fig. 2 d). Only in eastern sub-region NT are changes in summer rainfall significantly.
|
|
|
Figure 2. Results of differences between simulations over China in summer (RCM_M minus ROM_C; gridded regions are significant at the 95% confidence level)
|
|
|
|
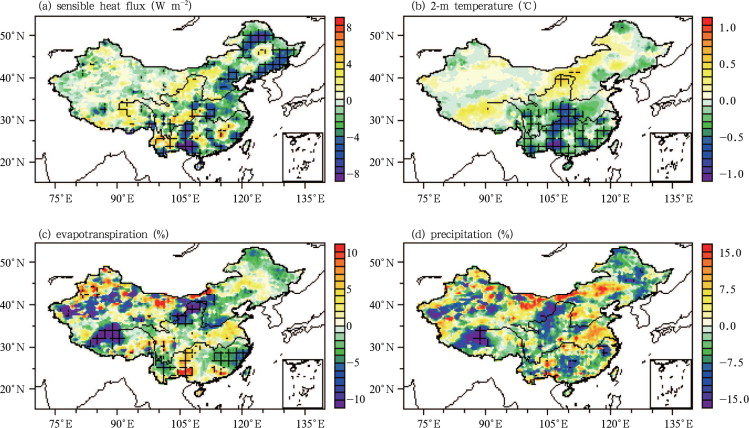
Figure 3. As in Figure 2 , but for winter
|
In winter, the spatial pattern of changes in sensible heat flux is in agreement with that in summer, but the amplitude of changes is obviously reduced (Fig. 3 a). Eastern China as a whole is cooler and shows a significant decrease by more than 1°C in Guangxi and Guizhou provinces, and the southeast coast. There is some warming over sub-regions TZ and NT (Fig. 3 b). Evapotranspiration declines over most areas of China. Decreased evapotranspiration in the middle and east of sub-region TZ, mountain areas in Northeast China is significant at the 95% confidence level. Precipitation decreases over the areas south of the Yellow River and the central parts of the Tibetan Plateau, with the largest reduction by more than 10%. However, rainfall changes in winter are not significant.
4.2. Temporal variability
4.2.1. Seasonal variability
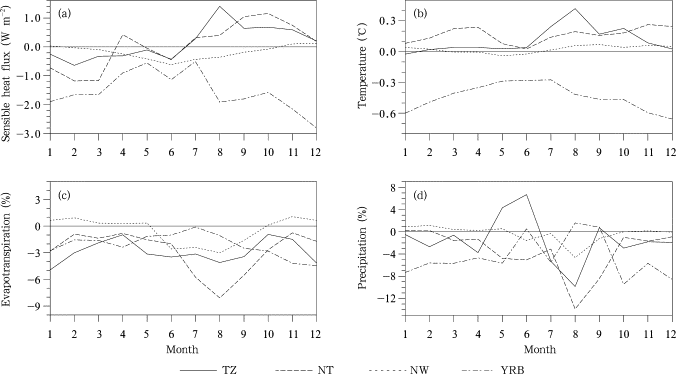
Figure 4 shows the differences in mean monthly sensible heat flux, 2-m air temperature, evapotranspiration, and precipitation between the RCM_M run and the RCM_C run averaged over the four subregions. Sensible heat flux decreases from January to June and increases from July to December, especially in August in sub-region TZ. Sub-region NT has similar changes to sub-region TZ, but the changes are more apparent in early spring and autumn. Sensible heat flux decreases slightly from March to October in subregion NW, and decreases year-round in sub-region YRB, especially in winter. For nearly all months, 2-m air temperature rises in the semiarid sub-regions TZ and NT. Sub-region TZ has the largest warming in August by 0.4°C. Sub-region NT warms by less than 0.3°C. Temperature increases are higher in spring and autumn. To some extent, seasonal temperature ranges increase in sub-region TZ and decrease in sub-region NT. The seasonal cycle of temperature changes is consistent with the sensible heat flux changes over subregion YRB, with a decrease of approximately 0.6°C in winter, twice as that in summer. The 2-m air temperature changes little during the year in sub-region NW. Evapotranspiration is lower through the year in semiarid regions probably due to the reduction of grassland. Sub-region NT shows a large decrease in evapotranspiration from July to September with a marked reduction of 8% in August, which is double to that in sub-region TZ. Winter evapotranspiration decreases in semiarid regions probably because of the reduced ground evaporation in winter (not shown). Furthermore, decreases in evapotranspiration may cause decreases in local precipitation by a weakening of convection. Precipitation decreases during most months over all sub-regions. The seasonal variability of rainfall changes is similar to the evapotranspiration variability over sub-regions NT and NW. August marks a decrease in rainfall in sub-regions TZ, NT, and NW, by 10%, 14% and 4%, respectively. In January, a reduction of approximately 7% is found for sub-region YRB. There are also different degrees of increases in rainfall in May, June, and September over sub-region TZ.
|
|
|
Figure 4. The average monthly differences (RCM_M mines RCM_C) in the four sub-regions in (a) sensible heat flux, (b) 2-m air temperature, (c) evapotranspiration, and (d) precipitation
|
4.2.2. Interannual variability
In order to investigate the effects of land cover changes on the interannual variability of climate, we have calculated the ratio of the standard deviation [ Zhang et al., 2009c ] as the measurement of change in interannual variability. Table 2 displays the differences in interannual variability of sensible heat flux, 2-m air temperature, evapotranspiration, and precipitation over four sub-regions in summer and winter. We find that interannual variations of all of the climate variables in summer change more notably than those in winter, and changes in sub-region TZ are significantly larger than those in other sub-regions. In summer, 2-m air temperature variability intensifies by an increase of 13.7%, while rainfall variability weakens sharply by 31.1% in sub-region TZ. Considerable reductions in the interannual variability of sensible heat flux and evapotranspiration are detected. Precipitation and evapotranspiration variations increase in sub-region NT (14.1%, 7.1%), which is in contrast to the decreases in sub-region NW (–11.0%, –12.9%). In addition, sub-region YRB shows a slight reduction in summer rainfall variation. In winter, only evapotranspiration variability over sub-region TZ changed significantly by –16.8%.
| Climate variable | TZ | NT | NW | YRB | ||||
|---|---|---|---|---|---|---|---|---|
| summer | winter | summer | winter | summer | winter | summer | winter | |
| Sensible heat flux | –11.0 | 5.2 | –1.6 | –1.4 | –6.0 | 1.3 | –2.0 | –5.5 |
| 2-m air temperature | 13.7 | –0.5 | 1.9 | 3.2 | 5.7 | 0.1 | 0.7 | –0.7 |
| Evapotranspiration | –17.3 | –16.8 | 14.7 | 1.7 | –11.0 | 2.0 | 2.8 | –3.5 |
| Precipitation | –31.1 | –5.5 | 7.1 | 0.4 | –12.9 | 0.8 | –7.5 | –4.3 |
4.3. Changes in macroscale atmospheric processes
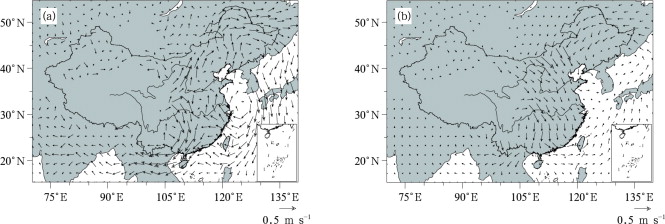
Large-scale land cover changes affect the overlying atmospheric circulation through changes in the water and energy balances, which would result in redistribution of water and energy through advection. The differences in 850 hPa and 500 hPa temperature and relative humidity (not shown) indicate that the overlying atmosphere tends to be warmer and wetter over northern China and colder and dryer over southern China in summer. Obvious decreases in temperature and humidity can be found over southern China in winter. Changes in 850 hPa winds over continental China and its surrounding areas are shown in Figure 5 . In summer, an anti-cyclonic anomaly over the East China Sea enhances southerly winds in northern China. A southwesterly wind anomaly increases rainfall to some extent over central and eastern Inner Mongolia by enhancing water vapor transport, which leads to a smaller decrease in summer rainfall over sub-region TZ than over sub-region NT. The northerly wind anomaly over Hubei, Hunan, and Guangxi provinces is not conducive to warm and wet air transport from the South China Sea and the Bay of Bengal to the inland, and hence causing precipitation decrease (Fig. 2 d). In winter, a low-level northerly wind anomaly brings more dry and cold air that leads to the reduction of precipitation and temperatures over the area south of the Yellow River (Fig. 3 b&3d).
|
|
|
Figure 5. Differences of 850 hPa winds (RCM_M minus RCM_C) over China and its neighboring regions in (a) summer and (b) winter
|
5. Summary and discussion
(1) Land cover changes characterized by desertification and degradation of vegetation have significant impacts on the regional climate of China. In summer, 2-m air temperature increases over the semiarid regions and decreases over southern China; precipitation decreases over the area south of the Yangtze River, most regions of Northeast China and Northwest China, areas between Kunlun Mountains, Tianshan Mountains and Tarim Basin. The spatial pattern of rainfall differences in sub-region NT is similar to that of the changes in evapotranspiration, which indicates that local evapotranspiration could be the dominant factor affecting precipitation in this region. In winter, decreases in temperature over eastern China exceed those in summer; precipitation considerably decreases over the south of the Yellow River and the central Tibetan Plateau. In general, desertification causes reduced summer rainfall in arid and semiarid regions, possibly resulting in further deterioration of the natural environment. Furthermore, increased temperatures in summer may render northern China more vulnerable to heat waves; decreased temperature in winter could make southern China more susceptible to low temperature hazards and chilling damages.
(2) Land cover changes affect seasonal and interannual variability to some extent. Seasonal temperature ranges could increase in sub-region TZ due to warming in summer, while in sub-region NT seasonal temperature ranges could decrease due to temperature increase in spring and autumn but less so in summer. Sub-region YRB has a reduction in temperature in winter twice as that in summer. Reduced rainfall reaches the valley in August in sub-regions TZ, NT, and NW, but in January in sub-region YRB. The interannual variability of 2-m air temperature intensifies, while rainfall variation weakens in sub-regions TZ and NW. In addition, precipitation variability increases in sub-region NT, but decreases in sub-region YRB. Therefore, sharply reduced vegetation over arid and semiarid regions could exacerbate climate sensitivity. However, none of the differences in interannual variations are statistically significant (F-test, 95% confidence level).
(3) Land cover changes further influence atmospheric circulation. In summer, the low-level wind fields show that southwesterly wind anomalies increase rainfall to some extent over central and eastern Inner Mongolia by enhancing water vapor transport, which leads to a smaller reduction in summer rainfall over sub-region TZ than that over sub-region NT. In winter, northerly wind anomalies bring drier and colder air resulting in decrease of rainfall and surface air temperature over the area south of the Yellow River.
It should be noted that the different sources and time periods of the two datasets might include some uncertainties. The study was limited by the small quantity of land cover datasets that not only reflect land surface conditions of different periods but also are compatible for use in climate models. Moreover, more simulations are required to investigate the detailed mechanism and decadal variation of climate effects.
Acknowledgements
The authors would like to thank CHEN Feng for providing the CLCV data and ZOU Jing for helpful discussion. This work is supported by the National Basic Research Program (No. 2010CB428403, 2010CB951001), and the National Natural Science Foundation of China (No. 91125016).
References
- Charney, 1975 J.G. Charney; Dynamics of deserts and drought in Sahel; Quarterly Journal of the Royal Meteorological Society, 101 (428) (1975), pp. 193–202
- Chen and Xie, 2009 F. Chen, Z.-H. Xie; A land cover dataset based on Chinese vegetation data and its impact on land surface simulations; Chinese Journal of Atmospheric Sciences (in Chinese), 33 (4) (2009), pp. 681–697
- Ding et al., 2005 Y.-H. Ding, Q.-P. Li, W.-J. Dong; A numerical simulation study of the impacts of vegetation changes on regional climate in China; Acta Meteorologica Sinica (in Chinese), 63 (5) (2005), pp. 613–621
- Douglas et al., 2000 B.C. Douglas, Y.-K. Xue, J.H. Richard, et al.; Modeling the impact of land surface degradation on the climate tropical North Africa; Journal of Climate, 14 (8) (2000), pp. 1809–1822
- Gao et al., 2007 X.-J. Gao, D.-F. Zhang, Z.-X. Chen, et al.; Land use effects on climate in China as simulated by a regional climate model; Science in China Series D: Earth Sciences, 50 (4) (2007), pp. 620–628
- Giorgi et al., 2012 F. Giorgi, E. Coppola, F. Solmon, et al.; RegCM4: Model description and preliminary tests over multiple CORDEX domains; Climate Research, 52 (1) (2012), pp. 7–29
- Hou, 2001 X.-Y. Hou; 1:1000000 Vegetation Atlas of China (in Chinese)Science Press (2001), p. 260
- Lawrence and Chase, 2007 P.J. Lawrence, T.N. Chase; Representing a new MODIS consistent land surface in the Community Land Model (CLM 3.0); Journal of Geophysical Research: Biogeosciences, 112 (G01023) (2007) doi: 10.1029/2006JG000168.
- Li and Ding, 2004 Q.-P. Li, Y.-H. Ding; Research process in the effect of vegetation change on regional climate; Journal of Nanjing Institute of Meteorology (in Chinese), 27 (1) (2004), pp. 131–140
- Liu et al., 2002b J.-Y. Liu, X.-Z. Deng, M.-L. Liu, et al.; Study on the spatial patterns of land-use change and analysis of driving forces in Northeastern China during 1990–2000; Chinese Geographical Science, 12 (4) (2002), pp. 299–308
- Liu et al., 2002a J.-Y. Liu, M.-L. Liu, D.-F. Zhuang, et al.; Spatial pattern analysis of recent land use changes in China; Science in China Series D: Earth Sciences (in Chinese), 32 (12) (2002), pp. 1031–1040
- Lü and Chen, 1999 S.-H. Lü, Y.-C. Chen; The influence of Northwest China afforestation on regional climate in China; Plateau Meteorology (in Chinese), 18 (3) (1999), pp. 416–424
- Oleson et al., 2008 K.W. Oleson, G.-Y. Niu, Z.-L. Yang, et al.; Improvements to the Community Land Model and their impact on the hydrological cycle; Journal of Geophysical Research: Biogeosciences, 113 (2008) http://dx.doi.org/10.1029/2007JG000563 G01021
- Piao and Fang, 2001 S.-L. Piao, Y.-J. Fang; Dynamic vegetation cover changes over the last 18 years in China; Quaternary Sciences (in Chinese), 21 (4) (2001), pp. 294–302
- Shukla et al., 1990 J. Shukla, C. Nobre, P.J. Sellers; Amazon deforestation and climate change; Science, 247 (4948) (1990), pp. 1322–1325
- Xue, 1996 Y.-K. Xue; The impact of desertification in the Mongolian and the Inner Mongolian grassland on the regional climate; J. Climate, 9 (9) (1996), pp. 2173–2189
- Zha and Gao, 1997 Y. Zha, J. Gao; Characteristics of desertification and its rehabilitation in China; Joural of Arid Environments, 37 (3) (1997), pp. 419–432
- Zhang et al., 2005a D.-F. Zhang, X.-J. Gao, Z.-C. Zhao, et al.; Simulation of climate in China by RegCM3 model; Advances in Climate Change Research (in Chinese), 1 (3) (2005), pp. 119–121
- Zhang et al., 2009a H.-Q. Zhang, X.-J. Gao, Y.-H. Li; Climate impacts of land-use change in China and its uncertainty in a global model simulation; Climate Dynamics, 32 (4) (2009), pp. 473–494
- Zhang et al., 2009b H.-Q. Zhang, X.-J. Gao, Y.-H. Li; On the atmospheric dynamical responses to land-use change in East Asian monsoon region; Climate Dynamics, 33 (2–3) (2009), pp. 409–426
- Zhang et al., 2009c H.-Q. Zhang, Y.-H. Li, X.-J. Gao; Potential impacts of land-use on climate variability and extremes; Advances in Atmospheric Sciences, 26 (5) (2009), pp. 840–854
- Zhang et al., 2005b J.-Y. Zhang, W.-J. Dong, C.-B. Fu; Impact of land surface degradation in northern China and southern Mongolia on the regional climate; Chinese Science Bulletin, 50 (1) (2005), pp. 53–58
- Zhou and Chen, 1995 S.-Q. Zhou, W.-L. Chen; Numerical experiments with effects of Tibetan vegetaion on East Asia atmospheric circulations; Journal of Nanjing Institute of Meteorology (in Chinese), 18 (4) (1995), p. 536542
Document information
Published on 15/05/17
Submitted on 15/05/17
Licence: Other
Share this document
Keywords
claim authorship
Are you one of the authors of this document?

