Abstract
This research quantitatively recognized the wind speed change using wind speed trend and trend of wind speed variability from 1961 to 2012 and regionalized the wind speed change on a county-level basis. The mean wind speed observation data and linear fitting method were used. The findings suggested that level-I regionalization includes six zones according to wind speed trend value in different regions, viz . Northeast China–North China substantial declining zone, East–Central China declining zone, Southeast China slightly declining zone, Southwest China very slightly declining zone, Northwest China declining zone, and Qinghai–Tibetan Plateau slightly declining zone. Level-II regionalization divides China into twelve regions based on trend of wind speed variability and the level-I regionalization results.
Keywords
Wind speed trend ; Regionalization ; Wind speed variability ; China
1. Introduction
Climate change is a hot issue among the studies of global change and has major impacts on economic and social development. Dealing with global climate change has become an important world-wide concern. IPCC (2013) issued the Fifth Assessment Report in 2013, which showed a warming trend for global surface temperature during the past one hundred years. The Second National Assessment Report on Climate Change issued by China (CCCNARCC, 2011 ) indicates that Chinas temperature rising trend is basically the same as the global one on a century time scale; global extreme precipitation events are showing an increasing trend and regional differences of precipitation are widening. The variation in wind speed, which is an important meteorological factor in characterizing the inevitable climate change and climatogenesis, is not in the center of current climate change researches. In view of various effects of temperature, precipitation and wind in different regions worldwide, it is necessary to study the wind speed change. The wind speed change usually has far-reaching influence on regional environment. As the global industrialization continues to develop and emissions of air pollutants are growing, people begin to notice the significantly growing haze days in urban areas in recent years (Wang et al., 2004 , Hu and Zhou, 2009 and Ding and Liu, 2014 ); wind speed is showing an obvious decreasing trend (Ren et al., 2005 , Jiang et al., 2013b and Song et al., 2014 ); and the declining of the wind speed does not favor the diffusion of pollutants in urban atmosphere (Zhang et al., 2014b and Wang et al., 2015 ). Problems, such as whether the wind speed change has influences on haze weather and how wind speed changes under global warming, should be addressed. The wind speed change may be associated with the change of temperature difference (difference among latitudes and between land and ocean) caused by global warming. Along with the accelerating urbanization process, site observation data is being affected to a certain degree, which may also have impacts on site observation of wind speed.
Current researches on wind speed now mainly concentrate on regional or sub-regional near-surface wind speed change. McVicar et al. (2012) found wind speed was declining sharply in most areas of low latitudes in both hemispheres but rising at high latitudes (>70° latitude). Pirazzoli and Tomasin (2003) found that wind speed was rising before the 1970s and began to decline afterwards, by studying the average annual rate of wind speed change in Italy for nearly 50 years. McVicar et al. (2008) found that the average declining rate of wind speed reached 0.009 m s−1 per year in Australia during 1975–2006. Wan et al. (2010) noticed the significant decline of wind speed in southern and western Canada while Kousari et al. (2013) showed that the overall wind speed in Iran is rising with significant declining in some areas. Attentions are also gradually paid to the wind speed change in China. Wang et al. (2004) found that annual mean wind speed in China is showing a significant declining trend from 1951 to 2000. Jiang et al. (2013b) also found that Chinas annual mean wind speed and the maximum wind speed is declining during 1956–2004 through observation data. From a regional perspective, the overall wind speed is constantly declining in North China Plain (Rong and Liang, 2008 ), and wind speed drops faster in winter than in summer. Wind speed is also declining in Northwest China (Ding et al., 2014a and Zhang et al., 2014a ), Qinling region (Jiang et al., 2013a ), Northeast China (Jin et al., 2012 ) and the Qinghai–Tibetan Plateau (Yang et al., 2014 ). He et al. (2013) found a huge spatial difference in the decrease of wind speed in Heihe River basin. Zhang et al. (2014c) found a downward trend in wind speed in 1961–2000 and the wind speed began to increase after 2000 in Southwest China. Other studies on wind speed change in provinces (Zhu et al., 2012 and Guo et al., 2015 ) and cities (Geng, 2014 and Tao et al., 2014 ) also discovered the decline trend. Additionally, the reduction of sand storms in recent years (Zeng et al., 2010 ) also suggests the decline of wind speed.
Based on the previous work noted above, wind speed change in China has a huge discrepancy in different areas. Considering the trend and variability of annual mean wind speed and the spatial difference, based on Chinas terrain feature, the wind speed change regionalization in China (1961–2012) is completed—county administrative as the basic unit.
2. Data and methods
2.1. Data source
Data used in this paper mainly include meteorological data and topographic data. Meteorological data are from Daily Surface Meteorological Observation Data Sets 3.0 of China provided by National Meteorological Information Center of China Meteorological Administration. The data sets include daily observation data of 756 national-level meteorological stations from 1951 to the present, and the elements include daily maximum wind speed, daily mean wind speed, daily extreme wind speed etc. As most of Chinas meteorological stations were established in 1951–1960, in order to obtain maximum number of stations which have continuous observation, data from 1961 to 2012 are used. The number of available wind speed observation stations amounts to 565 after removing stations with missing observation data over one year or more during 1961–2012. Other missing data are replaced by the average value of adjacent years. Topographic data are from Global 30 Arc-Second Elevation (GTOPO30) data sets provided by the United States Geological Survey with a spatial resolution of 1 km.
2.2. Calculation methods
In this paper, the trend of wind speed and trend in variability of annual mean wind speed are calculated and used to diagnose the wind speed change and its regionalization.
For the original wind speed series, considering the disturbance of periodic vibration, we use 5-year running mean (Shi et al., 2014 ). For running average series yi with sample size of n , ti is used to represent corresponding time so as to develop a simple linear regression equation between yi and ti :
|
|
( 1) |
The regression coefficient b represents the linear trend, which can be calculated through the least square method ( Shi et al., 2014 ). Calculation of the variability value is as follows:
The absolute residuals series fi of yi and the linear regression series is
|
|
( 2) |
The of absolute residuals series fi is called mean variability value, and the calculation formula is
|
|
( 3) |
Where is the original wind speed. For the absolute residuals series fi :
|
|
( 4) |
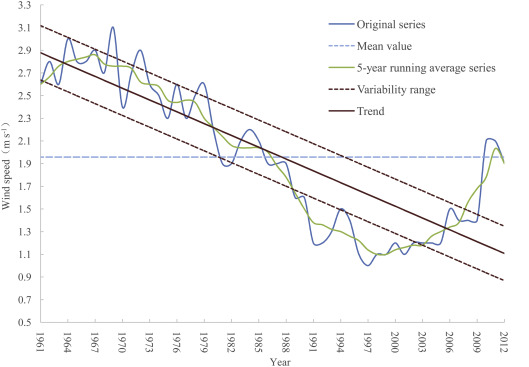
Taking Wuhan station for example, after conducting 5-year running mean for annual mean wind speed series (1961–2012), we can obtain the following information (Fig. 1 ): trend of the annual mean wind speed is 0.35 m s−1 per decade; variability of annual mean wind speed is 0.08 m s−1 per decade.
|
|
|
Fig. 1. Annual mean wind speed series of Wuhan station during 1961–2012. |
2.3. Confidence test
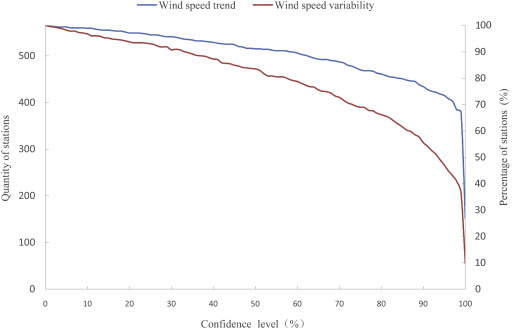
The significant confidence level of the trend is calculated by F -test method ( Liu et al., 2009 ). According to Fig. 2 , for the trend of wind speed, 66% meteorological stations are significant at the confidence level of 99%, and 77% are at the confidence level of 90%.
|
|
|
Fig. 2. Meteorological stations with significant trends under different confidence level. |
However, the rate is low for the trend of wind speed variability. Thirty-six percents are significant at the confidence level of 99%. And more than 50% are significant at the confidence level of 90%.
Under the confidence level of 90%, 68% of the meteorological stations show significant decreasing trends in wind speed, 8% are rising. For the wind speed variability, 30% are increasing, 25% are decreasing.
3. Results and analysis
3.1. Wind speed trend
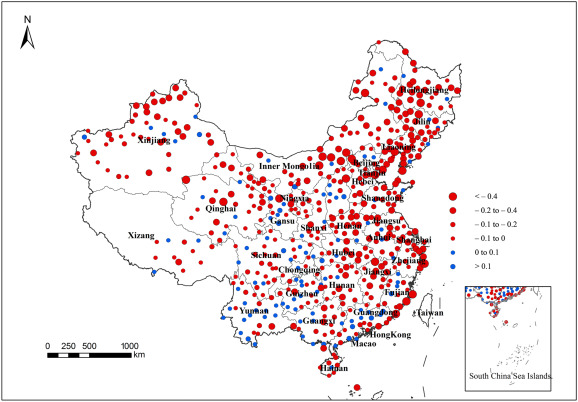
For spatial distribution, wind speed is significantly declining in Northwest China, North China, Northeast China, Circum-Bohai-Sea, southeastern coastal, Central China, and northwest South China (Fig. 3 ). Regions where wind speed is rising are mainly localized in Southwest China and southeast South China, and the rising rate is less than 0.1 m s−1 per decade of most stations (Table 1 ).
|
|
|
Fig. 3. Distribution of wind speed trend in China (1961–2012) (unit: m s−1 per decade). |
| Geographical scale | Distribution feature | ||
|---|---|---|---|
| Regional | Declining rate is high in Northwest China, North China, Northeast China, and southeastern coastal | Declining rate is low in Central China | Rising rate is low in Southwest China (Chongqing, Guizhou, etc.) and northern Guangdong |
| Local | Rising rate is low in southern Gansu and central Shanxi | Rising rate is low in northern Hubei, northern Fujian, southwestern Hunan | Declining rate is low in central–southern Sichuan and western Guangxi |
3.2. Trend in wind speed variability
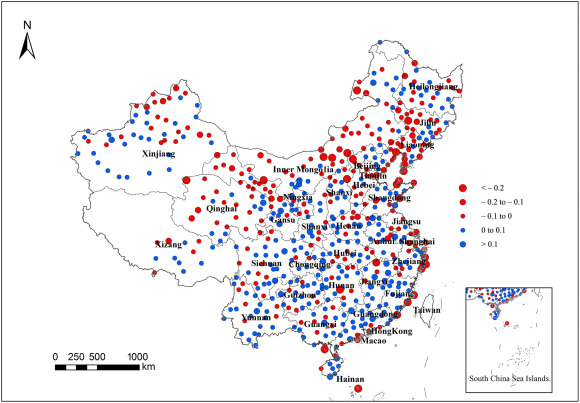
Trend in wind speed variability show the pattern of declining in north and rising in south and the number of increasing stations is as same as that of decreasing stations (Fig. 4 ). Variability of wind speed is declining in Northwest China, North China, Northeast China, southeastern coastal areas, and it is rising in most areas of Southwest China, South China, and Central China. More local details are shown in Table 2 .
|
|
|
Fig. 4. Distribution of trend in wind speed variability in China (1961–2012) (unit: m s−1 per decade). |
| Geographical scale | Distribution feature | |
|---|---|---|
| Nationwide | Declining in northern China and coastal areas | Rising in southern China |
| Regional | Declining rapidly in northwest of North China, North China and northeast of South China | Rising rapidly in South China and Southwest China |
| Local | Rising in northern Xinjiang, southern Gansu, Shanxi, and Heilongjiang | Declining in southern Hubei, northern Jiangxi, southern Hunan |
It can be seen from the above analysis that both trends in wind speed and wind speed variability have large discrepancies in different regions. It is based on those regional differences that we complete wind speed change regionalization (1961–2012).
4. Wind speed change regionalization
4.1. Principle of regionalization
The following basic principles are considered in the regionalization:
- Maintaining integrate boundary of the county-level administrative units, namely, regionalization boundary shall be determined based on the border line of administrative units.
- Spatial distribution continuity. Therefore, appropriate choice should be made according to spatial scope of regionalization to maintain the integrity of regionalization results.
- Combination of key indicator and auxiliary indicator. When determining the boundaries of regionalization, trends in wind speed and wind speed variability are the key indicators, while the change rate is auxiliary indicator, both of which should be taken into comprehensive consideration. Near the boundary, trend of wind speed or trend in wind speed variability will usually appear alternatively, so prior consideration should be given to the side with a larger change rate.
- Consistency of large-scale terrain unit. Because of the gradient pattern of three landforms in China, the regional features of climate change will be affected by large-scale terrain. Wind speed change regionalization boundary should be determined comprehensively by referring to the differentiation of large-scale terrain.
4.2. Indicators of regionalization
The indicators and standards of regionalization are trend of wind speed and wind speed variability. In view of the particularity of wind speed trend—about 81% of the meteorological stations show declining trend, this paper uses wind speed trend and considers the ratio and adopts three thresholds. The whole China is divided into substantial declining zone (>0.18 m s−1 per decade), declining zone (0.12–0.18 m s−1 per decade), slightly declining zone (0.06–0.12 m s−1 per decade) and very slightly declining zone (<0.06 m s−1 per decade). For wind speed variability regionalization, we calculate the average trend in wind speed variability of the region. The whole China is divided into variability increasing region (>0.02 m s−1 per decade), variability inconspicuous region (−0.02 to 0.02 m s−1 per decade), and variability decreasing region (<−0.02 m s−1 per decade). We also take the topographic data and the influence of large-scale geomorphic factors into consideration.
According to the regionalization principles and indicators, GIS spatial superposition method is adopted for the regionalization. After dividing regions based on the trend in wind speed and wind speed variability, we apply GIS spatial superposition method to analyze and compare the boundary of the two zones and superpose the results.
4.3. Regionalization results
4.3.1. Level-I regionalization
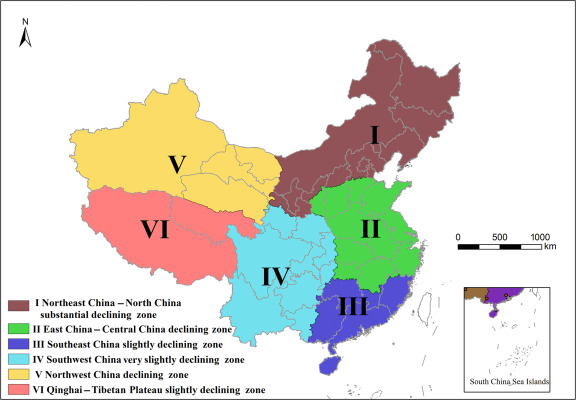
Wind speed trend (Fig. 3 ) is adopted as the key indicator for level-I regionalization. This regionalization takes the county administrative unit of China as the basic unit and takes the topographic data of China as the auxiliary reference indicators. China is divided into six zones, Northeast China–North China substantial declining zone, East China–Central China declining trend, Southeast China slightly declining zone, Southwest China very slightly declining zone, Northwest China declining zone, Qinghai–Tibetan Plateau slightly declining zone (Fig. 5 ).
|
|
|
Fig. 5. Level-I regionalization of wind speed in China (1961–2012). |
4.3.2. Level-II regionalization
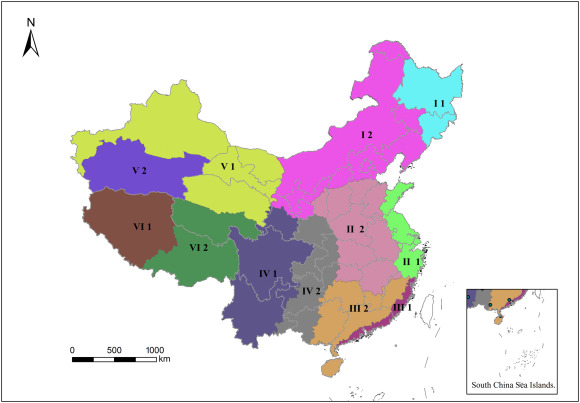
Based on level-I regionalization, regarding county administrative unit of China as basic unit and reference Chinas basic terrain and taking the calculation result of trend in wind speed variability as the key indicator for level-II regionalization of wind speed change in China (1961–2012), China is divided into twelve regions. According to indicators of level-II regionalization, we combine level-I regionalization with level-II regionalization and name them according to geomorphic feature (Fig. 6 ).
|
|
|
Fig. 6. Level-II regionalization wind speed in China (1961–2012). I 1: Lesser Khingan–Changbai Mountains–Sanjiang Plain wind speed fluctuation inconspicuous region; I 2: Greater Khingan– North China Plain–Loess Plateau wind speed fluctuation decreasing region; II 1: Huaihe River basin–North Jiangxi–East Hunan–mountains in North China wind speed fluctuation decreasing region; II 2: Zhejiang–Shanghai–Jiangsu–Shandong Peninsula wind speed fluctuation inconspicuous region; III 1 Hills and mountains in Nanling Mountains–South Jiangxi–North Fujian wind speed fluctuation decreasing region; III 2: Coastal Guangdong and Fujian wind speed fluctuation increasing region; IV 1: Eastern Qinling Mountains–mountains in western Hubei–Yunnan–Guizhou Plateau wind speed fluctuation increasing region; IV 2: Mountains in western Qinling Mountains–Sichuan basin–Hengduan Mountains wind speed fluctuation inconspicuous region; V 1: Mountains in North Xinjiang–Qilian Mountain–Inner Mongolian Plateau wind speed fluctuation decreasing region; V 2: Mountains in South Xinjiang wind speed fluctuation increasing region; VI 1: Southeast Qinghai–Tibet Plateau wind speed fluctuation decreasing region; VI 2: Northwest Qinghai–Tibet Plateau wind speed fluctuation inconspicuous region. |
5. Discussion and conclusions
5.1. Discussion
Wind speed of China is declining for the past 50 years with large spatial discrepancy, which is consistent with Wang et al. (2004) and Jiang et al. (2013b) . This paper makes the regionalization to reveal the regional differentiation of wind speed change in China. Decline of wind speed may have many causes. For example, climate change influences traditional patterns of air circulation (Ding et al., 2014b ) and causes the decline of wind speed. Forest vegetation recovery and growth in some areas (Liu et al., 2012 ) make the Earths surface more rough (Li et al., 2011 ), which may cause the decline of wind speed. As Chinas overall temperature rises significantly (Yu et al., 2011 and Han et al., 2013 ), especially for areas at high elevation (Ma et al., 2013 ), wind speed presents an opposite change. But does wind speed drop most sharply in such areas where temperature rises rapidly? By studying the temperature change of the past 50 years, Shi et al. (2014) found that temperature in North China is rising significantly while it shows a lower rising trend in southern China especially in Yunnan–Guizhou Plateau. Wind speed in North China is, however, declining significantly while it shows a slower declining trend in southern China. So we suspect that decline of wind speed in China for the past 50 years may be related to the overall warming trend as warming causes the reduction of the temperature gradients. In the region where temperature gradients are getting small, the wind speed declines significantly. Under global warming, the increase in the pressure over the mainland China (Wang et al., 2004 ) and the vertical differences in temperature change (Sun and Ding, 2011 ) may cause the reduction of the pressure gradients which can lead to the overall declining of wind speed with influence of local circulation.
Migration of meteorological station (Li and Yan, 2009 ) and urbanization may account for declining of wind speed as well. Studies have found the solution to the problem of wind speed homogeneity (Cao et al., 2010 ). The results of regionalization show that the wind speed declines very significantly in East China where many big cities located. Meteorological stations are usually migrated from urban to suburban areas. Since wind speed in suburban areas is usually higher than that in urban areas (Xin et al., 2009 ), the migration of meteorological stations influence the calculation of wind speed trend. Urbanization in China is accelerating in the past few decades and the scale of city is expanding with buildings of mixed heights, which increases the resistance of air circulation and results in lower wind speed in urban areas.
Works currently completed here in mainly focus on regional rule of wind speed change. In the next step, we will make in-depth discussion on regional difference of genetic mechanism of wind speed change in half a century, such as the impact of monsoon region and non-monsoon region on wind speed change regionalization in China, etc. Besides, we will focus on the impact of change in extreme climate/weather events on wind speed change regionalization. Considering the change of extreme wind speed, and to further reveal regional differentiation of wind speed, the relations between the regularity and disaster and environmental risk can provide theoretical basis for China to better deal with climate change.
6. Conclusions
- For the trend of wind speed, most stations show declining trends. There is a significant decline in North China, Circum-Bohai-Sea, and southeastern coastal areas. Regions where wind speed is rising mainly located in Southwest China, and southeast part of South China.
- For the trend in wind speed variability, its regionality is also significant. For North China and southeastern coastal areas, decreasing trend is observed. In most areas of Southwest China, South China, and Central China, there is increasing trend.
- By using the trend of wind speed as main indicator and the trend in wind speed variability as secondary indicator, and taking account both county administrative boundary and topographic feature as the auxiliary reference indicators, China is divided into six zones as level-I regionalization, i.e., Northeast China–North China substantial declining zone, East–Central China declining zone, Southeast China slightly declining zone, Southwest China very slightly declining zone, Northwest China declining zone, Qinghai–Tibetan Plateau slightly declining zone. Inside those six level-I zones, level-II regionalization is defined which has twelve zones.
Acknowledgements
We express our thanks to the anonymous reviewers and editors for their constructive comments and suggestions. This work was supported by the National Basic Research Program of China (2012CB955404 , 2012CB955402 ) and the National Natural Science Foundation of China (41321001 ).
References
- Cao et al., 2010 L. Cao, X. Ju, X. Liu; Penalized maximal F test for the homogeneity study of the annual mean wind speed over China ; Meteorol. Mon., 36 (10) (2010), pp. 52–56 (in Chinese)
- CCCNARCC, 2011 CCCNARCC (The Compilation Committee of China’s National Assessment Report on Climate Change); Chinas National Assessment Report on Climate Change (II); Science Press, Beijing (2011)
- Ding et al., 2014a C.-X. Ding, J.-P. Yan, M.-M. Li; Climate change and response characteristics to wind speed in northwestern China; Bull. Soil Water Conserv., 34 (4) (2014), pp. 134–137 (in Chinese)
- Ding and Liu, 2014 Y.-H. Ding, Y.-J. Liu; Analysis of long-term variations of fog and haze in China in recent 50 years and their relations with atmospheric humidity; Sci. China Earth Sci., 57 (1) (2014), pp. 36–46
- Ding et al., 2014b Y.-H. Ding, Y.-J. Liu, S.-J. Liang, et al.; Interdecadal variability of the East Asian winter monsoon and its possible links to global climate change; Acta Meteorol. Sin., 72 (5) (2014), pp. 835–852 (in Chinese)
- Geng, 2014 X.-Y. Geng; Changes in wind speed and its causes in Nanjing during the period of 1960–2004; J. Qinghai Meteorol., 1 (2014), pp. 12–18 (in Chinese)
- Guo et al., 2015 W. Guo, L.-P. Zhao, J.-Y. He, et al.; Analysis of Shanxi province in recent 50 years the change of wind speed and mutation characteristics; Sci. Technol. Innov., 3 (2015), pp. 1–3 (in Chinese)
- Han et al., 2013 C.-H. Han, Z.-X. Hao, J.-Y. Zheng; Regionalization of temperature changes in China and characteristics of temperature in different regions during 1951–2010; Prog. Geogr., 32 (6) (2013), pp. 887–896 (in Chinese)
- He et al., 2013 X.-Q. He, B. Zhang, Y.-F. Zhao, et al.; Temporal and spatial characteristics of average wind speed changes in Heihe river; Bull. Soil Water Conserv., 33 (4) (2013), pp. 242–247 (in Chinese)
- Hu and Zhou, 2009 Y.-D. Hu, Z.-J. Zhou; Climatic characteristics of haze in China; Meteorol. Mon., 35 (7) (2009), pp. 73–78 (in Chinese)
- IPCC, 2013 IPCC; Climate Change 2013: the Physical Science Basis; Cambridge University Press, Cambridge and New York (2013)
- Jiang et al., 2013a C. Jiang, F. Wang, Y.-X. Liu, et al.; Spatial-temporal variation and mutation of wind speed in the northern and southern regions of the Qin-ling Mountains; Sci. Geogr. Sin., 33 (2) (2013), pp. 244–250 (in Chinese)
- Jiang et al., 2013b Y. Jiang, Y. Luo, Z. Zhao; Maximum wind speed changes over China; Acta Meteorol. Sin., 27 (1) (2013), pp. 63–74 (in Chinese)
- Jin et al., 2012 W. Jin, G.-Y. Ren, Y. Qu, et al.; Change in surface mean wind speed of Northeast China during the period of 1971–2010; Arid Zone Res., 29 (4) (2012), pp. 648–653 (in Chinese)
- Kousari et al., 2013 M.R. Kousari, H. Ahani, H. Hakimelahi; An investigation of near surface wind speed trends in arid and semiarid regions of Iran; Theor. Appl. Climatol., 114 (1–2) (2013), pp. 153–168
- Li et al., 2011 J. Li, F. Hu, L. Liu, et al.; On estimation of surface roughness for wind energy resources assessment; Resour. Sci., 33 (12) (2011), pp. 2341–2348 (in Chinese)
- Li and Yan, 2009 Z. Li, Z.-W. Yan; Homogenized daily mean/maximum/minimum temperature series for China from 1960–2008; Atmos. Ocean. Sci. Lett., 2 (4) (2009), pp. 237–243
- Liu et al., 2009 S.-X. Liu, J.-X. Qiu, X.-G. Mo; Wind velocity variation from 1951 to 2006 in the North China Plain; Resour. Sci., 31 (9) (2009), pp. 1486–1492 (in Chinese)
- Liu et al., 2012 Y.-B. Liu, W.-M. Ju, J.-M. Chen, et al.; Spatial and temporal variations of forest LAI in China during 2000–2010; Chin. Sci. Bull., 57 (22) (2012), pp. 2846–2856
- Ma et al., 2013 Z.,-F. Ma, J. Liu, S.-Q. Zhang, et al.; Observed climate changes in Southwest China during 1961–2010; Adv. Clim. Change Res., 4 (1) (2013), pp. 30–40
- McVicar et al., 2008 T.R. McVicar, T.G.V. Niel, L.-T. Li, et al.; Wind speed climatology and trends for Australia, 1975–2006: capturing the stilling phenomenon and comparison with near-surface reanalysis output; Geophys. Res. Lett., 35 (20) (2008), pp. 288–299
- McVicar et al., 2012 T.R. McVicar, M.L. Roderick, R.J. Donohue, et al.; Global review and synthesis of trends in observed terrestrial near-surface wind speeds: implications for evaporation; J. Hydrol., 416 (3) (2012), pp. 182–205
- Pirazzoli and Tomasin, 2003 P.A. Pirazzoli, A. Tomasin; Recent near-surface wind changes in the central Mediterranean and Adriatic areas; Int. J. Climatol., 23 (8) (2003), pp. 963–973
- Ren et al., 2005 G.-Y. Ren, G. Guo, M.-Z. Xu, et al.; Climate changes of Chinas mainland over the past half century; Acta Meteorol. Sin., 63 (6) (2005), pp. 942–956 (in Chinese)
- Rong and Liang, 2008 Y.-S. Rong, J.-Y. Liang; Analysis of variation of wind speed over North China; Sci. Meteorol. Sin., 28 (6) (2008), pp. 655–658 (in Chinese)
- Shi et al., 2014 P.-J. Shi, S. Sun, M. Wang, et al.; Climate change regionalization in China (1961–2010); Sci. China Earth Sci., 57 (11) (2014), pp. 2676–2689
- Song et al., 2014 L.-C. Song, R. Gao, Y. Li, et al.; Analysis of Chinas haze days in the winter half year and the climatic background during 1961–2012; Adv. Clim. Change Res., 5 (5) (2014), pp. 1–6
- Sun and Ding, 2011 Y. Sun, Y.-H. Ding; Responses of south and east Asian summer monsoons to different land-sea temperature increases under a warming scenario; Chin. Sci. Bull., 56 (25) (2011), pp. 2718–2726
- Tao et al., 2014 Y. Tao, W.-G. Xiang, J.-X. He, et al.; Analysis of annual maximum wind speed variation characteristics in Jiangmen; J. Chengdu Univ. Inf. Technol., 29 (6) (2014), pp. 94–98 (in Chinese)
- Wan et al., 2010 H. Wan, X.L. Wang, V.R. Swail; Homogenization and trend analysis of Canadian near-surface wind speeds; J. Clim., 23 (5) (2010), pp. 1209–1225
- Wang et al., 2004 Z.-Y. Wang, Y.-H. Ding, J.-H. He, et al.; An updating analysis of the climate change in China in recent 50 years; Acta Meteorol. Sin., 62 (2) (2004), pp. 228–236 (in Chinese)
- Wang et al., 2015 Y. Wang, Y.-P. Liu, J.-B. Li, et al.; The effect of PM2. 5/PM10 variation based on precipitable water vapor and wind speed; J. Catastrophol., 30 (1) (2015), pp. 5–7 (in Chinese)
- Xin et al., 2009 T.-E. Xin, J.-S. He, H.-R. Wei, et al.; Observation and study of wind velocity variation with altitude over the EXPO land; Shanghai. Plateau Meteorol., 28 (1) (2009), pp. 127–135 (in Chinese)
- Yang et al., 2014 C.-Y. Yang, W.-Z. Shen, N.-F. Lin; Climate change and its regional differences over the Tibet Plateau; Arid. Land Geogr., 37 (2) (2014), pp. 290–298 (in Chinese)
- Yu et al., 2011 H.-Y. Yu, S.-H. Liu, L.-N. Zhao, et al.; Characteristics of air temperature and precipitation in different regions of China from 1951 to 2009; J. Meteorol. Environ., 27 (4) (2011), pp. 1–11 (in Chinese)
- Zeng et al., 2010 S.-L. Zeng, Y.-F. Chen, S.-G. Wang, et al.; Decadal change of spring sand-dust storm in northwest and inner Mongolia of China and its cause; J. Desert Res., 30 (5) (2010), pp. 1200–1206 (in Chinese)
- Zhang et al., 2014a K.-X. Zhang, S.-M. Pan, L.-G. Cao; Spatial and temporal trends of average wind speed in Hexi area in 1961–2010; Sci. Geogr. Sin., 34 (11) (2014), pp. 1404–1408 (in Chinese)
- Zhang et al., 2014b R.-H. Zhang, Q. Li, R.-N. Zhang; Meteorological conditions for the persistent severe fog and haze event over eastern China in January 2013; Sci. China Earth Sci., 57 (1) (2014), pp. 26–35
- Zhang et al., 2014c Z.-B. Zhang, Y. Yang, X.-P. Zhang, et al.; Wind speed changes and its influencing factors in southwestern China; Acta Ecol. Sin., 34 (2) (2014), pp. 471–481 (in Chinese)
- Zhu et al., 2012 B. Zhu, C.-H. Li, P.-L. Ma, et al.; Analysis of wind speed changing trends in Gansu province; J. Arid Land Resour. Environ., 26 (12) (2012), pp. 90–96 (in Chinese)
Document information
Published on 15/05/17
Submitted on 15/05/17
Licence: Other
Share this document
Keywords
claim authorship
Are you one of the authors of this document?
