Abstract
A finite element method for the solution of the up-to-second-order wave diffraction-radiation problem in the time-domain is proposed. The solver has been verified against available analytical solutions, and validated using experimental data available for the HiPRWind semisubmersible platform (designed for floating wind turbines). To validate, the wave diffraction-radiation solver is coupled to body dynamics and mooring solvers in the time-domain. The HiPRWind movements and mooring forces have been compared for a large number of test cases, including decay tests, monochromatic waves, and bichromatic waves obtaining good correlation for both body movements and mooring forces.
1. Introduction
There is a growing interest in the industry of Floating Offshore Wind Turbines (FOWT) due to their ability to access the vast quantities of wind resources available over deep waters. Despite the existence of full scale prototypes which are already operating, such as the Hywind in Norway [1] or the Windfloat in Portugal [2], the industry still faces design and operational challenges which require the development of new modeling tools. In this work, we propose a model to analyse the up-to-second-order response of floating structures, which have been validated through experimental tests conducted for the HiPRWind semisubmersible FOWT model. A review on floating offshore wind technology can be found in [3,4,5].
The hydrodynamics of the semisubmersible concept for FOWTs has received attention in recent literature. For instance, [6] and [7] focused on slow-drift and mean-drift forces of semisubmersible platforms. A comparison of a semisubmersible against the SPAR concept can be found in [8,9,10], and simulations in the Time-Domain (TD) considering different models for the hydrodynamic loads were carried out in [11].
One of the main concerns regarding semisubmersible platforms are the slow-drift forces. For semisubmersible platforms with catenary mooring lines these forces are usually within the range of the surge natural frequency, leading to large displacements. This is because even though the wave frequencies are usually larger than the natural frequencies, second-order effects contain low frequency components that might cause the slow-drift.
Second-order forces can increase the surge response of semisubmersible platforms, even becoming larger than the first-order response. To estimate these slow drift forces, Newman’s approximation can be used which only depends on the first order solution. However it has been shown in [7] that this does not provide the necessary precision for this type of problem. Therefore, the second-order effect must be taken into account to accurately compute slow-drift motions, and the mooring system should be designed accordingly.
The impact of slow-drift forces on the design of the mooring systems and difficulties in estimating the corresponding forces, is a problem that requires substantial further research. The design of the mooring system is based on loads induced by the excursions. These can be predicted on an extensive set of time-domain simulations comprising different environmental conditions (combinations of waves, current, and wind conditions) which aim to represent the metocean statistics of the specific location. For these simulations, a wave diffraction-radiation solver in the frequency-domain is usually used to evaluate the added masses, potential damping, and wave excitation forces.
Quadratic transfer functions (QTFs) obtained by frequency domain solvers are usually used as inputs for second-order time-domain simulations. These QTFs depend on the linear first-order response amplitude operators (RAOs), and when the mooring lines are not linear (like the catenary lines used for semisubmersible platforms), these must be linearised. Therefore, QTFs obtained in the frequency-domain do not contain information about the nonlinearities contained in the mooring system. To overcome this shortcoming, a time-domain solver could be used. While the former are computationally more efficient for linear problems, the latter accounts for these nonlinearities in a natural way.
Apart from the importance of second order effects on the dynamic response of floating structures, recent works have emphasized the importance of the second-order effects on the surge response of FOWT. Coulling et al. [12] concluded that particular attention must be paid to the motion and load responses of the platforms associated with the second-order difference-frequency forces of environmental wave loads, as the exclusion of the second-order dynamic analysis leads to a reduction of the platform mean excursions. Other works [13,14] have recently assessed the effects of second-order hydrodynamics on semisubmersible FOWT which are usually neglected in the dynamic behaviour. These forces lead to large oscillations that strain the mooring system or to vibrations that cause fatigue damage to the moored structure. Luptom and Langley state in [6] that slow-drift forces might be less important for FOWT than for larger and better known floating structures such as those used in the oil industry. An accurate estimation of these forces is mandatory to assess its impact.
More recently, Lopez-Pavon et al. [7] and Simos et al. [15] focused on the estimation and verification of second-order wave induced forces on the HiPRWind semisubmersible platform. This work concludes with the following observations:
- 1. Accurate calculation of second-order forces may be difficult to achieve and in some cases, different numerical codes (based on different approximations for these forces) may render divergent results.
- 2. The experimental verification of the slow-drift effects is quite difficult. Accurate measurement of low-frequency forces is hard to obtain and indirect verifications based on the resonant motions of the floating body depend on other factors such as the viscous damping of the small-scale model, the geometric characteristics of the mooring system, etc.
In this work, a Finite Element Method (FEM) that solves the up-to-second-order wave diffraction-radiation problem in the time-domain is proposed. In this model, non-linear forces such as those arising from the mooring lines can be introduced into the dynamics of the floater with no need of linearization. First, mathematical and numerical models for the wave diffraction-radiation are presented. Then the model is verified by comparing the results with available second-order analytical solutions. A model of the HiPRWind platform is calibrated using decay tests and analysed in monochromatic, bichromatic, and irregular waves in order to validate the proposed numerical approach. Finally conclusions are drawn regarding the model presented and the results obtained.
2. Up-to-second-order diffraction-radiation governing equations
The potential flow governing equations for the up-to-second-order wave problem are obtained by applying Taylor expansion on the boundary surfaces of a time-independent domain. This approach enables an approximation of the free surface on and the mean wetted surface of a floating body at time t. Then, a perturbed solution based on the Stokes expansion procedure is applied to the velocity potential, the free surface elevation, and the floater motion. Retaining terms up to second order, the resulting equations are:
|
|
, | (1) | ||
|
|
, | (2) | ||
|
|
, | (3) | ||
|
, | (4) | ||
| (5) | ||||
| (6) | ||||
where superscripts and denote the components at the first-order and up-to-second-order solution (first-order plus second-order); is the up-to-second-order incident wave velocity potential; is the up-to-second-order incident free surface elevation; and are the up-to-second-order diffraction-radiation wave velocity potential and free surface elevation; is the free surface pressure; is the mean wetted body surface; is the local velocity induced at point P by the body ith order movements; is the ith order fluid velocity induced by the diffracted-radiated waves; is the ith order fluid velocity induced by the incident waves; is the normal vector to the body surface at point P.
The fluid pressure at a point P on the body surface is given by:
|
(7) |
where , , and stand for the ith order hydrostatic, incident wave induced, and diffracted-radiated waves induced pressures. Each pressure component is further decomposed as:
|
(8) |
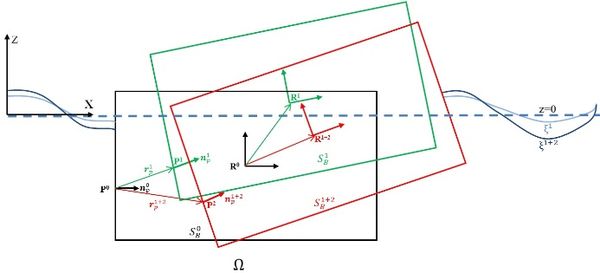
where represents the displacement of point P induced by the ith order body movement (see Figure 1). Further details on obtaining the governing equations can be found in Servan-Camas and Garcia-Espinosa [16], and Servan-Camas [17].
The body dynamics of the floating body are governed by the equation of motion:
|
|
(9) |
where is the mass matrix of the body; is the hydrostatic restoring matrix (approximates the integral of the hydrostatic pressure); is the vector of the hydrodynamic forces induced by dynamic pressures plus any other external forces; and represents the movements of the six degrees of freedom of the body.
Loads acting on the body are obtained by direct pressure integration on the body surface underneath the mean water level, with the exception of hydrostatic forces, which are obtained via the corresponding hydrostatic restoring matrices. Also, the second-order loads ( and ) due to the change of the wetted surface induced by the first order solution are accounted for:
|
|
(10) | |
|
|
where is the vector from the centre of gravity of the floater G to any point P on the wet surface.
3. Numerical model
3.1. Finite element formulation
This section presents the formulation based on the Finite Element Method (FEM) to solve the system of equations governing the wave diffraction-radiation problem. This formulation has been developed to be used in conjunction with unstructured meshes in order to enhance geometry flexibility and speed up the initial modelling time.
Let be the finite element space for interpolating functions, when constructed in the usual manner. From this space, it can be constructed that subspace , which incorporates the Dirichlet conditions for the potential . The space of test functions, denoted by , is constructed as , but with functions vanishing on the Dirichlet boundary. The weak form of the problem can be written as follows:
Find , by solving the discrete variational problem:
|
(11) |
where , , and are the potential normal gradients corresponding to the Neumann boundary conditions on bodies; the radiation boundary; the free surface; and the bottom surface of the domain. At this point, it is useful to introduce the associated matrix form of Eq.(11):
|
|
(12) |
where is the standard Laplacian matrix, and , , and , and are the vectors resulting from integrating the corresponding boundary condition terms. The seabed boundary for the refracted and radiated potential is imposed by taking .
3.2. Free surface boundary conditions
Combining the kinematic (Eq. (2)) and dynamic (Eq. (3)) free surface boundary conditions, the free surface condition up to second order reads:
|
|
(13) |
where superscripts 1+2 have been omitted (and will be from this point on), and are the source terms from the first-order solution. This condition is implemented as a Neumann boundary condition that fulfils the flux boundary integral:
|
(14) |
where is the corresponding boundary mass. The terms and are given by Eqs. (5) and (6) respectively, then:
|
(15) |
Eq. (13) is discretized in time using the following numerical scheme:
|
(16) |
where for the specific case , the above scheme becomes a fourth order compact Padé scheme. Once the velocity potential is solved at the new time step, the free surface elevation is computed using the following fourth-order in time numerical scheme:
|
|
(17) |
3.3. Radiation condition and wave absorption
Waves represented by are born at the bodies and propagate in all directions away from them. The waves need to either be dissipated or to leave the domain so they will not bounce back at the outer boundary and interact with the bodies. A Sommerfeld radiation condition at the edge of the computational domain is introduced:
|
(18) |
where is the surface bounding the domain horizontally; is the normal vector of pointing outwards from the domain; and is a prescribed wave phase velocity. This radiation condition will let waves moving at velocity to escape the domain. The numerical scheme used to implement the radiation condition is
|
(19) |
The prescribed phase velocity will be set for radiating those waves with the smallest frequency (largest wavelengths) considered in each specific case. The typical value of is the phase velocity of longer incident waves. However, waves with higher frequencies (smaller phase velocities) will not leave the domain through , so that they will be reflected. Therefore, wave absorption is introduced into the dynamic free surface boundary condition by varying the pressure such that:
|
|
(20) |
Eq. (20) increases pressure when the free surface is moving upwards, while decreasing the pressure when the free surface is moving downwards. Then energy is transferred from the waves to the atmosphere and waves are damped. However, the coefficient will be set to zero in the analysis area (near the bodies), so that damping will have no effect on the solution of the wave-body interaction problem. Further details can be found in Servan-Camas and Garcia-Espinosa [16] and Servan-Camas [17].
4. Mooring models
Two different computational models have been implemented in the seakeeping solver to simulate the mooring lines. The first one is an elastic catenary solver, and the second is a non-linear FEM dynamic cable solver. In the following sections, a brief description of the mathematical model is given. Details of the numerical implementation of the mooring solver, the body dynamics solver, and their coupling can be found in [17,18,19,].
4.1. Elastic Catenary model
The elastic catenary formulation is based on the model proposed in [20]. Each mooring line is analysed in a local coordinate system located at the anchor. The local z-axis is oriented vertical and the local x-axis is oriented horizontally from the anchor to the position of the fairlead. When a portion of the mooring line rests on the seabed, the equations for the horizontal and vertical distances between the anchor and a given point on the line, and , can be written as,
|
|
(21) | |
|
|
(22) |
being the catenary arc length; the horizontal component of the effective tension; static friction coefficient; catenary weight per unit length in water; E the Young modulus; A the cross section area; and portion of the length of cable resting on the seabed.
The equation for the effective tension in the line at any point of the line is written as follows:
|
(23) |
The above formula calculates the total load on the system from all of mooring lines. The restoring load is found by first translating each fairlead tension from its local coordinate system to the global frame, and then adding the tensions from all lines.
4.2. Dynamic cable model
The dynamic equations for a mooring cable with length L, negligible bending and torsional stiffness can be formulated as [18]:
|
|
(24) |
where is the water density; is the added mass coefficient; is the mass per unit length of the unstretched cable; is the position vector; is the Young's modulus; is the cross-sectional area of the cable; is the strain; are the external loads applied on the cable including the self-weight; hydrostatic loads; drag forces and seabed interaction; and is the length along the unstretched cable.
The boundary conditions of the mooring cable are given by
|
|
(25) | |
|
|
(26) |
where is the second derivative of the position vector at the fairlead connection point.
The above non-linear equation is solved using the standard Finite Element Method. Details of the mathematical and numerical dynamic model are provided in Gutierrez-Romero et al. [18].
5. Numerical model verification
5.1. Verification case 1: mean drift forces on a hemisphere
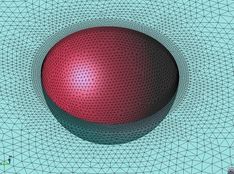
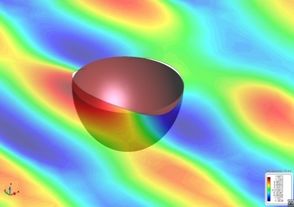
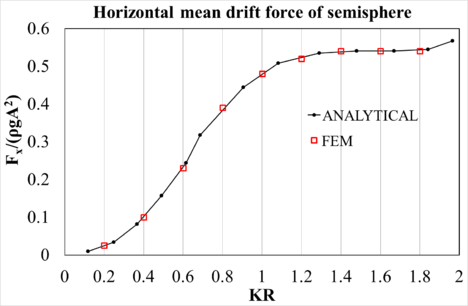
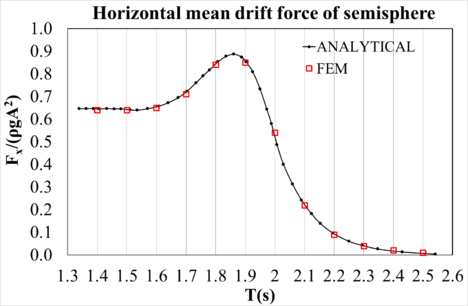
This case consists of estimating the mean drift forces on a hemisphere. In this work, mean drift forces are obtained by averaging the time series of the corresponding second-order force. The analytical solution for the fixed hemisphere was obtained by Fernandes and Levy [21], and for the freely floating hemisphere was obtained by Kudou [22] and reported by Pinkster [23]. In this section, the numerical results are compared with the analytical solution. The details of the hemisphere particulars are given in Table 1. Both fixed and free floating cases were analysed. Figure 2 (left) shows the mesh used for the calculations. It can be observed that mesh refinement is required in the area of the waterline in order to obtain accurate results of mean drift forces. Figure 2 (right) shows a snapshot of the wave elevation around the hemisphere in one of the cases run. Finally, figure 3 (above) compares the analytical results with the numerical results in the case of the fixed hemisphere, while figure 3 (below) compares the results in the free floating case. Good correlation is observed for the whole range of waves analysed.
| Depth | Infinite |
| Mass | Displacement |
| Radius | 1 m |
| CG coordinates [m] | (0,0,0) |
| Number of tetrahedrons | 274283 |
| Number of triangles | 22082 |
|
|
Figure 3: Mean drift forces on Hemisphere. |
5.2. Verification case 2: diffraction of second-order monochromatic waves by semisubmerged horizontal rectangular cylinder
5.2.1. Problem description
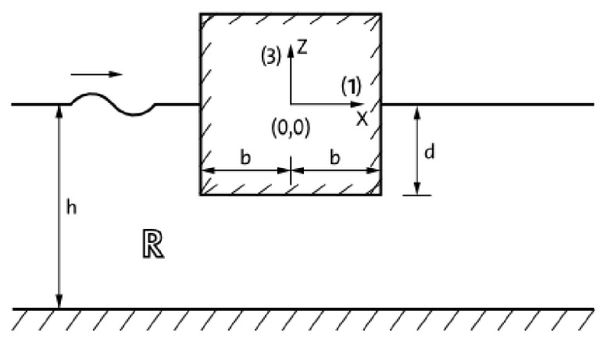
This test case deals with the solution to the diffraction problem of second-order monochromatic surface waves by a semisubmerged horizontal cylinder of rectangular cross section. The boundary-value problem is resolved and the results are compared with the analytical solution obtained by the method of matched Eigen function expansions presented in [24]. Horizontal and vertical forces and the moment about the heel of the prismatic cylinder are analysed for different monochromatic waves. An illustration of this problem is shown in figure 4. Relevant geometric parameters are: depth (h = 1 m), half beam (b = 1 m), and draught (d = 0.2 m).
The situation considered for analysis is the diffraction of waves by a fixed horizontal cylinder of rectangular cross section. Analysis is undertaken with the following assumptions: the fluid is inviscid and incompressible, the seabed and the cylinder are impervious, and the excitation is provided by normally incident plane waves of small amplitude and frequency. Several cases are run for different wave periods (T = 0.897, 1.003, 1.07, 1.16, 1.445, 2.299, 4.17, and 6.37 seconds), and the simulation time is about 30 seconds, with an initialization time of 10 seconds. All movement is restrained so that the body is completely fixed, therefore, wave diffraction occurs but not radiation.
5.2.2. Mesh generation
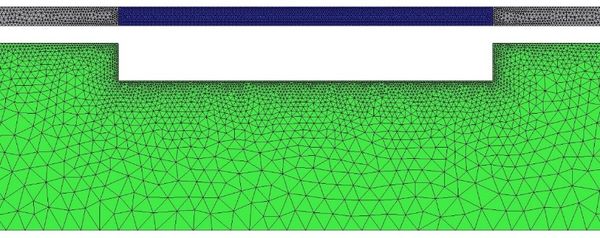
Mesh properties for the present analysis are summarized in Table 2. Figure 5 shows an isometric view of the mesh used for the present analysis at the region close to the surface of the body.
| Minimum element size | 0.01 m |
| Maximum element size | 0.1 m |
| Number of elements | 121687 |
| Number of nodes | 22940 |
5.2.3. Verification of results
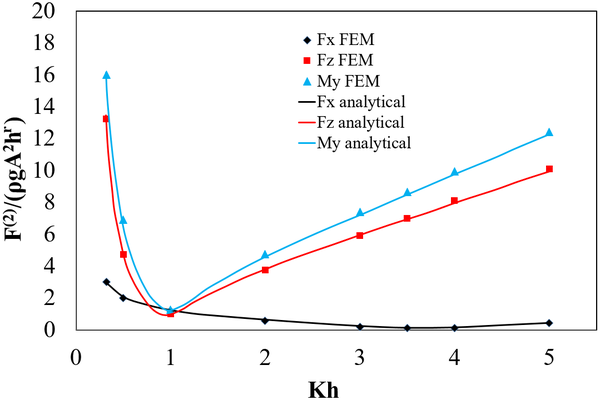
Figure 6 shows the amplitude of the second-order horizontal force , vertical force forces, and moment about y axis , for both the analytical results reported in [25] and the numerical results obtained in this work. The second-order components of the forces and moments (double frequency component) are normalized with , where is the density of the fluid, the gravity, the square of the wave amplitude, and the water depth. Results are plotted against the dimensionless wave number ( ). As can be observed, good correlation is obtained for the analysed range of wave numbers.
5.3. Verification case 3: diffraction of second-order bichromatic waves by bottom mounted circular cylinder
5.3.1. Problem description
This test case deals with the diffraction of a bottom mounted vertical cylinder under monochromatic waves with water depth , radius of the cylinder . More details can be found on [25].
5.3.2. Convergence analysis
A convergence analysis has been carried out to assess the convergence of the present numerical approach to the mathematical model. Table 3 provides the unstructured mesh details for each case tested. The wave frequencies chosen for this analysis are and . Time step is calculated such that , being the characteristic element size at the floating line.
Table 4 provides the dimensionless force for the sum-frequency along with the wave direction, the difference between two consecutive discretization sizes, and the relative difference respect to the corresponding force. Differences have been calculated instead of errors due to the lack of an exact solution to compare with. The results are given in Table 4 and show that the convergence rate is approximately of second order, although care must be taken since convergence tests on unstructured meshes contain uncertainties due to the irregularities in the shape of the elements.
| Characteristic element size [m] | Number of elements | Number of nodes | ||||
| Floating line | Body and free surface | Volume | [s] | |||
| Mesh 1 | 0.1 | 0.2 | 0.4 | 0.0587 | 727221 | 125926 |
| Mesh 2 | 0.071 | 0.1414 | 0.2828 | 0.0494 | 983719 | 169908 |
| Mesh 3 | 0.05 | 0.1 | 0.2 | 0.0415 | 1683943 | 289527 |
| Mesh 4 | 0.035 | 0.0707 | 0.1414 | 0.0349 | 3475047 | 594852 |
| Mesh 5 | 0.025 | 0.05 | 0.1 | 0.0294 | 8203778 | 1399855 |
| Mesh 1 | Mesh 2 | Mesh 3 | Mesh 4 | Mesh 5 | |
| 0.1 | 0.071 | 0.05 | 0.035 | 0.025 | |
| 2.498 | 2.348 | 2.229 | 2.159 | 2.141 | |
| Difference:
|
- | 0.150 | 0.119 | 0.070 | 0.018 |
| Relative difference:
|
- | 6.39% | 5.34% | 3.24% | 0.84% |
5.3.3. Verification of results
Table 5 shows a comparison for the non-dimensional amplitude for the sum-frequency and difference-frequency forces along the wave direction. In the previous analysis, Mesh 4 allows to obtain a relative difference below of 5% (see Table 4), therefore it has been selected to be used in this verification. Compared to numerical and semi-analytical solutions obtained by other authors, the results in this work are within the range of those reported elsewhere.
| sum-freq | diff-freq | sum-freq | diff-freq | sum-freq | diff-freq | |
| Shao and Faltinsen [26] | 1.868 | 0.861 | 2.190 | 0.788 | 2.088 | 0.759 |
| Kim and Yue [27] | 1.853 | 0.856 | 2.182 | 0.788 | 2.094 | 0.765 |
| Eatock Taylor and Huang [26] | 1.883 | 0.849 | 2.294 | 0.769 | 2.114 | 0.777 |
| Moubayed and Williams [28] | 1.783 | 0.840 | 2.091 | 0.761 | 1.998 | 0.734 |
| Present work | 1.815 | 0.852 | 2.248 | 0.765 | 2.159 | 0.740 |
6. Validation against the HiPRWind model
6.1. Case description
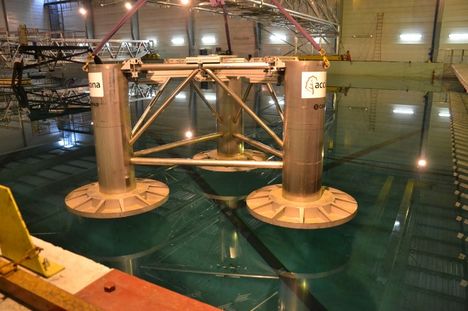
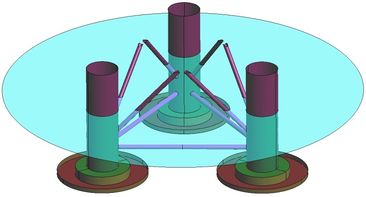
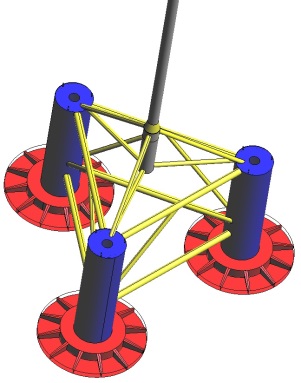
The floating platform geometry considered in this paper has been provided by the HiPRWind FP7 project (EU 7th RTD FP under grant agreement no. 256812) [29] and is composed of three buoyant columns connected with bracings. Model tests were carried out at Ecole Centrale Nantes’ facilities. A model built in stainless steel to scale of was used in the tests (see figure 7). These experiments were devised by Simos et al. [15] in order to validate an alternative frequency-domain method to obtain the second-order response of the floater from the measured motions. Results related to mooring loads are presented here for the first time.
Figure 8 shows an overview of the HiPRWind CAD model generated. Table 6 provides the platform details in full scale, as well as the water depth used in this study.
| Depth | 100 m |
| Operation design draft | 15.5 m |
| Distance between column centres | 35 m |
| Column diameter | 7 m |
| Heave plates diameter | 20 m |
| Displacement | 2332 T |
| XG | 0 m |
| YG | 0 m |
| ZG | -4.46 m |
| Radius of gyration (pitch) | 22.38 m |
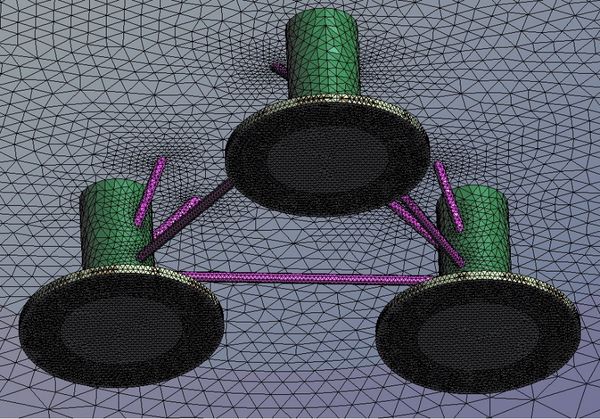
Figure 9 shows a view of the mesh used for this case study. This mesh consists of tetrahedral 643603 elements and 119350 nodes. The cylindrical domain has a radius of 500 meters, a height of 100 m water depth, and the absorption area starts 50 meters from the centre of the platform.
6.2. Model calibration
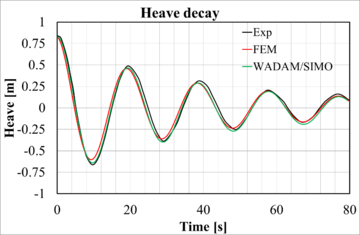
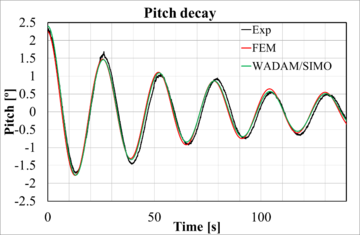
In order to predict seakeeping in real conditions with a potential flow solver, viscous effects are to be incorporated via external forces. These external forces are modelled by simplified formulas accounting for the overall viscous effects acting on the platform. In this work, the viscous effects have been included in the computational solver by means of linear and quadratic models. This model has been calibrated using the experimental information of the extinction tests for surge, heave and pitch motions.
|
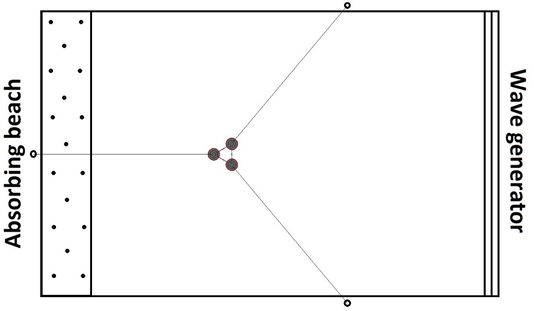
Figure 10 shows the layout of the experimental set-up for these tests. Three elastic lines were used to keep the model in position during the extinction experiments. These lines have a small linear weight distribution so the catenary effect is negligible. The location of the end points for each line is given in Table 7. Pretension of 550kN was applied to each line.
| [m] | [m] | ||
| Line 1 | 20.8 | ||
| Line 2 | 20.8 | ||
| Line 3 | 20.8 |
The linear stiffness matrix corresponding to the mooring system is:
The viscous damping forces have been divided into two groups. The first group corresponds to the bracings of the structure. The corresponding forces are applied in the centre of gravity of the platform and depend on the velocity of the platform. The second group corresponds to the heave plates and columns, and calibration forces are applied in the centre of the heave plates using Morison elements that take into account the relative velocity between the platform and the incident waves. Table 8 provides a summary of the coefficients of the damping terms obtained in the calibration phase. A similar calibration process for the BEM frequency domain solver WADAM [30] has also been performed by a third party, resulting in reasonably similar calibration values.
| FEM | WADAM/SIMO | ||
| Applied at CG | Surge linear damping: [KN/(m/s)] | 75 | 70 |
| Heave added mass: [t] | 1200 | 1000 | |
| Heave linear damping: [KN/(m/s)] | 110 | 110 | |
| Applied at the centre of each
heave plate base |
Heave linear damping: [KN/(m/s)] | 76 | 50 |
| Heave quadratic damping: [KN/(m/s)2] | 805 | 600 |
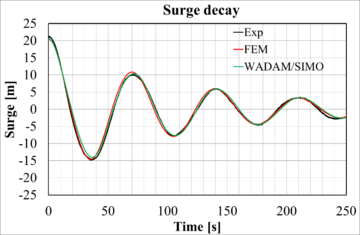
Figure 11 shows experimental versus numerical results after calibration of the surge, heave, and pitch decay tests. Good correlation has been reached for the three degrees of freedom. The natural periods obtained by the FEM solver are given in Table 9. Natural periods obtained by the BEM model and experiments have an error margin of 1 second.
| Surge | Heave | Pitch |
| 70 s | 19 s | 26 s |
6.3. Catenary mooring
Three catenary lines were used as mooring lines for the rest of the experiments. The location of the end points for each line is given in Table 10. Table 11 provides the mooring line details.
| (x,y,z) [m] | Anchor point (x,y,z) [m] | |
| Line 1 | (-325.73, 0.00, -80.00) | (-23.73, 0.00, 10.00) |
| Line 2 | (206.79, -248.00, -80.00) | (15.24, -18.17, 10.00) |
| Line 3 | (206.79, 248.00, -80.00) | (15.21, 18.17, 10.00) |
| Length | 330 m |
| Section | m2 |
| Equivalent Young modulus | Pa |
| Linear weight in water | 1453 N/m |
6.4. Validation test 1: monochromatic waves
In this section, Response Amplitude Operators (RAOs) of the computational model presented in this work are compared with those obtained in the experiments. It should be noted that the experimental data shows a change in the platform response throughout the experiment, meaning, the results of the spectral analysis depend on the time interval used. If the period of time used for calculating the RAOs is chosen towards the end of the experiment, an increase in the response in the low frequencies is observed which raises the question of whether longer waves are suitable for analysis.
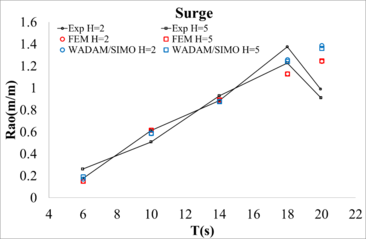
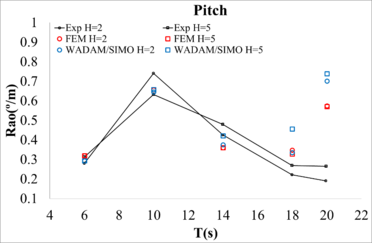
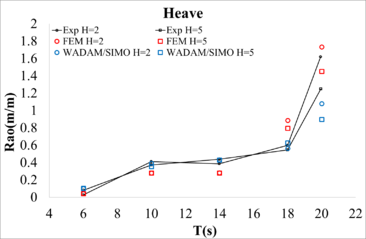
Experimental RAOs were obtained for full scale wave heights of and , including the elastic lines used for the calibration. The experimental RAO was obtained using a time interval of ten wave cycles, starting at 500 seconds, and using a Fast Fourier Transform (FFT) to filter low frequency components induced by the model basin. The numerical RAOs were obtained using a time interval of ten wave cycles, starting at 100 seconds, and using 50 seconds of initialization. Figure 12 compares the RAOs in surge, heave, and pitch, respectively, against the numerical results obtained by the FEM and WADAM/SIMO solvers. While sufficient correlation is found for the lower periods, the correlation is not as good for the longer ones. This could be caused by the fact that the distance from the wave generator to the platform is 15.10 meters, while the wavelength ranges from 2.84 m to 26.34 m, and, longer waves may not have time to fully develop.
|
| Figure 11: Comparison between experimental and numerical decay tests. |
The experimental data shows that differences between the RAOs for the two wave heights can be large. We find two possible causes: due to the non-linearities introduced by the mooring system, and/or due to the experimental uncertainties.
|
| Figure 12: Comparison of RAOs obtained from experiments and numerical simulations. |
6.5. Validation test 2: bichromatic waves
A number of tests were carried out with bichromatic waves in order to analyse the second-order response of the platform. The incident wave periods range between 5.5 and 21 seconds. The wave frequency difference ranges from 0.0128 Hz to 0.0167 Hz. The latter frequency is intentionally close to the surge resonant frequency as the focus of the analysis will be on the surge response to the slow drift.
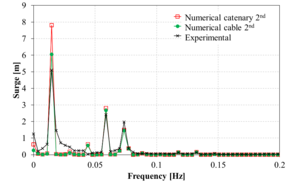
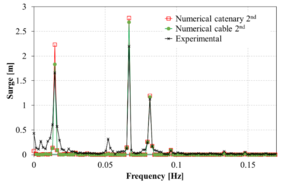
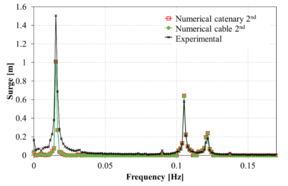
Table 12 provides the experimental test matrix, including incident wave height (), frequency (), and the frequency difference and sum. All these cases have been simulated in the time-domain using the FEM model proposed in this work for the diffraction-radiation problem. The different cases have been analysed using the quasi-static elastic catenary and the non-linear FEM dynamic cable models. Once the simulations were carried out, the time series were transformed via FFT to the frequency domain in order to enable the comparison of results with the experimental data. No filtering was undertaken on the experimental and numerical data.
When analysing the wave elevation in the experiments, it was found that the wave energy spectrum was not bichromatic, showing energy spread around the frequency pair under analysis. In order to better reproduce the experiment, a set of waves reproducing the free surface elevation of the experiment was used, instead of a pure bichromatic wave.
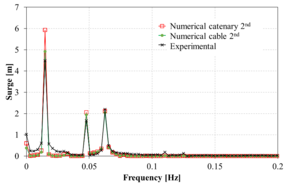
Figure 13 compares the spectrum of the surge movement obtained in the experiments against those obtained numerically using the FEM solver. Overall, in the range of the incident wave frequencies, the numerical results correlate reasonably well with the experimental ones. However, in the low frequency range, larger differences are noted in some cases. Considering the difficulty of matching the RAOs in the monochromatic wave tests mentioned above, the correlation of the bichromatic wave test is acceptable.
When comparing the quasi-static catenary model with the dynamic cable model, it is observed that both models provide reasonably similar results, although the catenary model predicts larger movements. This could be due to the lack of energy dissipation of the catenary model itself, while in the dynamic cable model Morison forces in the mooring lines are taken into account, leading to energy dissipation.
(a): Case 1 |
(b): Case 2 |
(c): Case 3 |
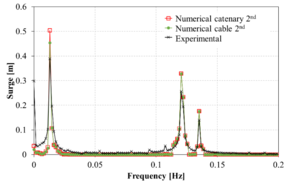
(d): Case 4 |
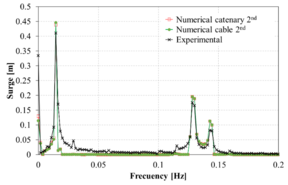
(e): Case 5 |
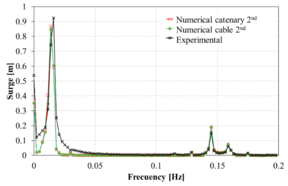
(f): Case 6 |
| Figure 13 (a)-(p): Comparison between the experimental, catenary and cable model for surge response to bichromatic waves. | |
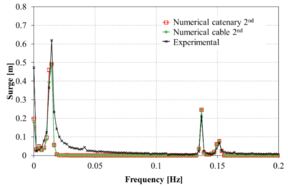
(g): Case 7 |
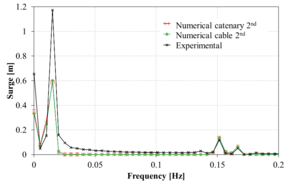
(h): Case 8 |
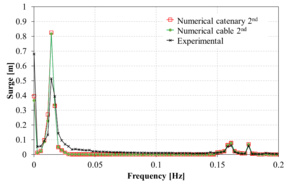
(i): Case 9 |
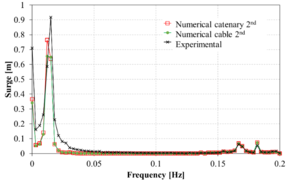
(j): Case 10 |
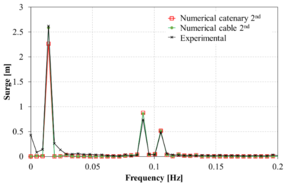
(k): Case 11 |
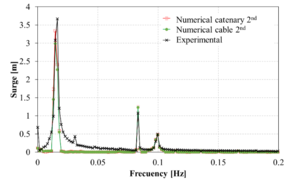
(l): Case 12 |
| Figure 13: (continued) | |
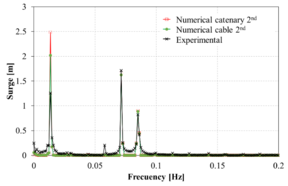
(m): Case 13 |
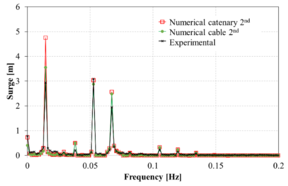
(n): Case 14 |
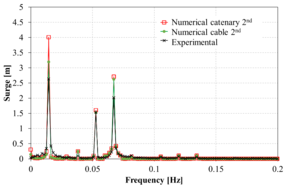
(o): Case 15 |
(p): Case 16 |
| Figure 13: (continued) | |
Table 13 provides data regarding the CPU time required for simulating the bichromatic wave tests. On average, the ratio of CPU time to real time is in the order of 30.5.
| Case | Incident wave 1 | Incident wave 2 | Freq. difference | Freq. Sum | ||||
| [m] | [Hz] | [m] | [Hz] | [Hz] | [s] | [Hz] | [s] | |
| 1 | 5.63 | 0.0582 | 4.32 | 0.0735 | 0.0153 | 65.4 | 0.1318 | 7.59 |
| 2 | 5.27 | 0.0667 | 3.54 | 0.0813 | 0.0146 | 68.3 | 0.1480 | 6.76 |
| 3 | 2.80 | 0.1053 | 1.62 | 0.1220 | 0.0167 | 59.9 | 0.2272 | 4.40 |
| 4 | 2.13 | 0.1205 | 1.27 | 0.1351 | 0.0147 | 68.2 | 0.2556 | 3.91 |
| 5 | 1.88 | 0.1300 | 1.14 | 0.1429 | 0.0128 | 78.0 | 0.2729 | 3.66 |
| 6 | 1.50 | 0.1449 | 0.92 | 0.1587 | 0.0138 | 72.4 | 0.3037 | 3.29 |
| 7 | 1.67 | 0.1370 | 1.02 | 0.1515 | 0.0145 | 68.8 | 0.2885 | 3.47 |
| 8 | 1.35 | 0.1515 | 0.84 | 0.1667 | 0.0152 | 66.0 | 0.3182 | 3.14 |
| 9 | 1.22 | 0.1613 | 0.77 | 0.1754 | 0.0141 | 70.7 | 0.3367 | 2.97 |
| 10 | 1.11 | 0.1667 | 0.70 | 0.1818 | 0.0152 | 66.0 | 0.3485 | 2.87 |
| 11 | 2.83 | 0.0909 | 2.10 | 0.1053 | 0.0144 | 69.7 | 0.1962 | 5.10 |
| 12 | 3.37 | 0.0833 | 2.44 | 0.0997 | 0.0163 | 61.2 | 0.1830 | 5.46 |
| 13 | 4.59 | 0.0714 | 3.16 | 0.0850 | 0.0135 | 73.8 | 0.1564 | 6.39 |
| 14 | 5.64 | 0.0526 | 5.16 | 0.0672 | 0.0145 | 68.9 | 0.1198 | 8.35 |
| 15 | 2.82 | 0.0526 | 5.16 | 0.0672 | 0.0145 | 68.9 | 0.1198 | 8.35 |
| 16 | 3.44 | 0.0476 | 6.03 | 0.0625 | 0.0149 | 67.2 | 0.1101 | 9.08 |
| Case | Catenary mooring | Cable mooring | ||||
| Simulation Time [s] | CPU Time [s] | Ratio
[s/s] |
Simulation Time [ST(s)] | CPU Time [s] | Ratio
[s/s] | |
| 1 | 775.02 | 36227.18 | 46.74 | 1200.03 | 72016.11 | 60.01 |
| 2 | 1115.14 | 23947.44 | 21.47 | 1115.14 | 19757.59 | 17.72 |
| 3 | 1279.19 | 28688.95 | 22.43 | 1279.19 | 32642.45 | 25.52 |
| 4 | 1615.12 | 36035.17 | 22.31 | 1615.12 | 41652.91 | 25.79 |
| 5 | 1046.01 | 25104.81 | 24.00 | 1046.01 | 27602.47 | 26.39 |
| 6 | 935.09 | 29797.70 | 31.87 | 935.09 | 24044.09 | 25.71 |
| 7 | 982.07 | 25378.13 | 25.84 | 982.07 | 25797.82 | 26.27 |
| 8 | 896.05 | 30768.33 | 34.34 | 896.05 | 30533.34 | 34.08 |
| 9 | 854.08 | 30032.72 | 35.16 | 854.08 | 23306.34 | 27.29 |
| 10 | 830.08 | 31300.66 | 37.71 | 830.08 | 38213.82 | 46.04 |
| 11 | 710.02 | 53935.90 | 37.98 | 710.02 | 37674.61 | 53.06 |
| 12 | 1613.07 | 46106.76 | 28.58 | 1613.07 | 39654.95 | 24.58 |
| 13 | 1813.12 | 28062.74 | 15.48 | 1813.12 | 24148.93 | 13.32 |
| 14 | 1052.09 | 26884.85 | 25.55 | 1052.09 | 25070.24 | 23.83 |
| 15 | 1052.09 | 41201.61 | 39.16 | 1052.09 | 37945.54 | 36.07 |
| 16 | 836.06 | 29020.15 | 34.71 | 836.06 | 23880.50 | 28.56 |
| Mean value | 30.21 | 30.89 | ||||
6.6. Validation test 3: irregular waves
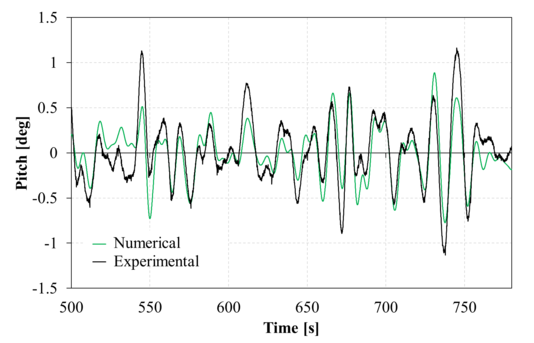
Two tests of irregular waves are used to validate the capability of the present FEM solver to predict the seakeeping of the HiPRWind, as well as the behaviour of the mooring. The simulation time was 784.7 seconds, and the time interval used for the analysis range from 500 s to 784.7 s. No filtering was used during the analysis process, to the experimental data or to the numerical results. Table 14 provides the particulars of the target wave spectrums. The model discretization used in this test is the same as for the bichromatic tests, but only the cable model is used to simulate the mooring lines.
|
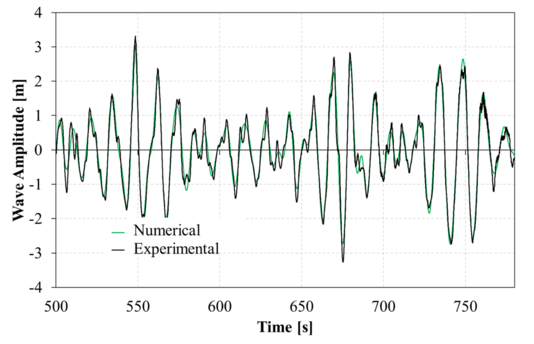
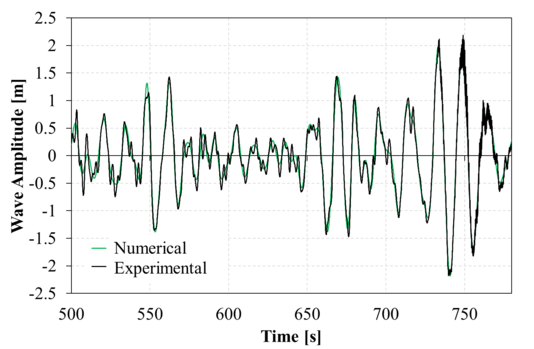
| Figure 14: Comparison between experimental and second order numerical incident wave elevation for the time range analyzed. Up: Irregular 1; down: Irregular 2. |
The incident wave field was determined by means of a FFT analysis of the incident wave elevation reported by the experiments within the analysis time interval. Figure 14 compares the resulting second order numerical incident wave elevation with the experimental one, finding good correlation between them.
|
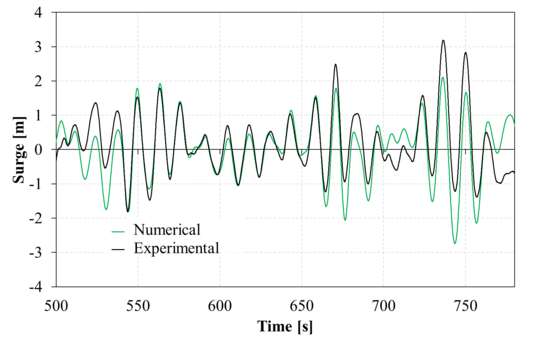
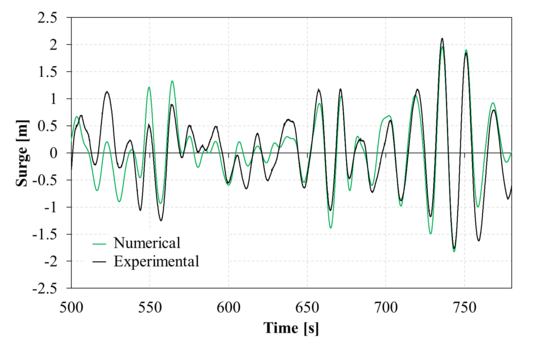
| Figure 15: Comparison between experimental and second order numerical surge movements for the time range analyzed. Up: Irregular 1; down: Irregular 2.
|
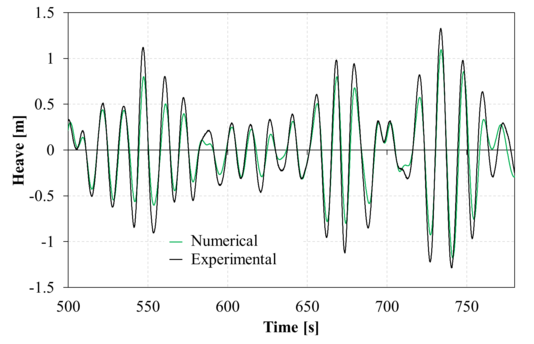
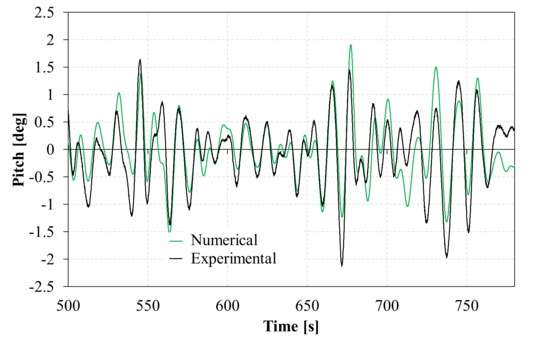
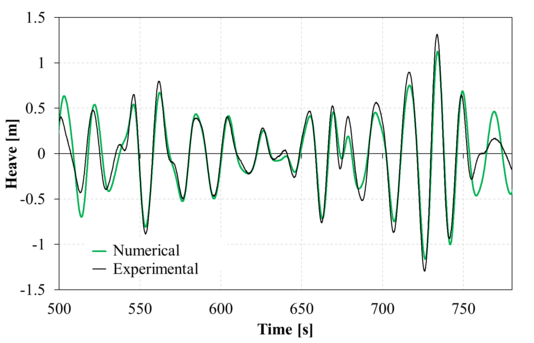
Figure 15 compares the second-order numerical and experimental surge response within the analysis time interval. Good correlation is found, although some deviation in the low frequency can be observed. Figure 16 compares the second-order numerical and experimental heave response within the analysis time interval. Again a fair agreement is found, although the numerical solution shows larger amplitudes in the higher frequencies. Figure 17 compares the second-order numerical and experimental pitch response within the analysis time interval. Just like in surge, a good correlation is found, although some deviation in the low frequency can be observed. Regarding the phase agreement, all movements show a good phase correlation between the numerical and experimental results.
|
| Figure 16: Comparison between experimental and second order numerical heave movements for the time range analyzed. Up: Irregular 1; down: Irregular 2.
|
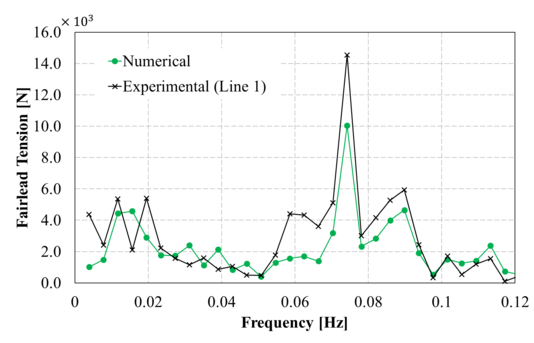
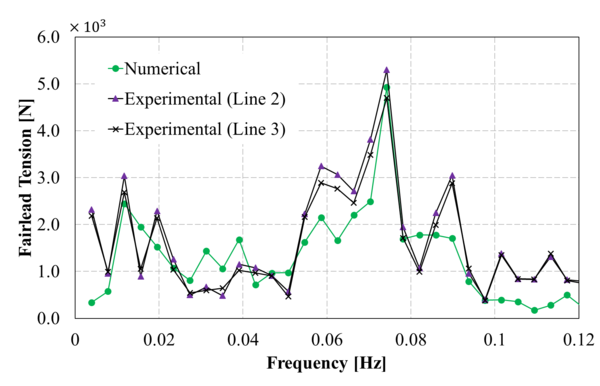
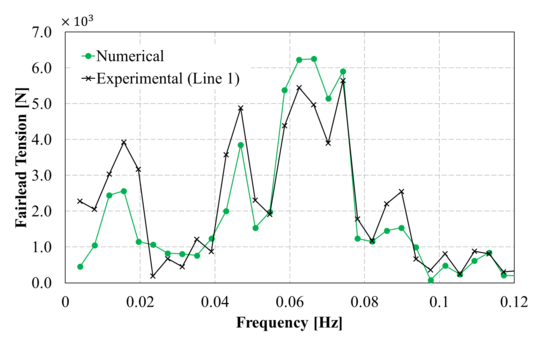
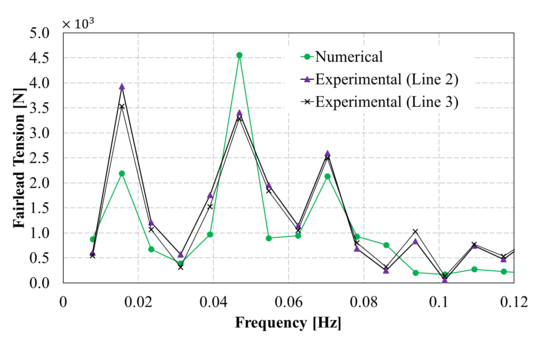
Figure 18 and 19 provide a spectral analysis of the loads induced by the mooring lines on the platform. The numerical results obtained follow the trend of the experiments well, although the amplitude at some frequencies do not match the experimental ones.
|
| Figure 17: Comparison between experimental and second order numerical pitch movements for the time range analyzed. Up: Irregular 1; down: Irregular 2. |
| Case | [s] | |
| Irregular 1 | 2.50 | 16 |
| Irregular 2 | 4.00 | 13 |
6.7. Viscous effects on mean wave forces and wave drift damping.
For semi-submersible platforms, when wave drift forces become small, viscous effects may contribute to drift forces. This effect is third order, meaning that it will become more important as the wave amplitudes increase (see [31]). In the case of the HiPRWind, we can break down the contribution of the viscous effects to the mean force on two main components. The first due to the viscous forces generated at the heave plates in combination with the pitch movement, which provides a horizontal component with non-zero mean value. The second component comes from the variation of the free surface elevation at the columns waterline, which also leads to a non-zero mean horizontal force. The contribution of these forces has been estimated a posteriori, and it has been compared to the mean wave force for two case studies: bichromatic wave case 1, and irregular waves with and . In both cases we found that the contribution of the viscous effects to the mean drift were in the order of magnitude of the wave mean drift. Therefore, this effect should be taken into account in order to evaluate the mean excursion of the platform. However, the non-zero frequency response should not be affected.
|
| Figure 18: Comparison between experimental and second order numerical line 1 loads in the frequency domain. Up: Irregular 1; down: Irregular 2. |
A posteriori estimation of the wave drift damping was calculated for all case studies analysed in this work. It was assumed that the major contribution to this damping is due to the columns. For this estimation, the damping of one column was approximated by the damping of a vertical circular cylinder reported in Fig 5.22 of [32]. An estimation for the HiPRWind wave drift damping in bichromatic waves provides a value of about 7% of the surge viscous damping at the most, while being completely negligible for the irregular wave cases. Therefore the wave drift damping can be considered negligible compared to the viscous damping, and no significant change in the results should be expected if it was considered in the simulations.
|
| Figure 19: Comparison between experimental and second order numerical line 1 loads in the frequency domain. Up: Irregular 1; down: Irregular 2.
|
Conclusions
A FEM model for the second-order wave diffraction-radiation problem in the time-domain has been developed. The model has been verified against analytical solutions, comparing mean drift loads for a floating hemisphere, second-order forces for a semi-submerged horizontal rectangular cylinder, and second-order forces induced on a bottom mounted cylinder. In all cases, the numerical results obtained correlate well with the analytical results.
Furthermore, the computational solver has been validated against experiments for the HiPRWind model carried out at the EC Nantes’ facilities. First, the model viscous damping was calibrated to reproduce decay tests for surge, heave, and pitch. A good match between the experiments and the calibrated model was obtained. Secondly, RAOs were compared using the monochromatic wave tests, the numerical results correlate well with the experiments for shorter waves, but not for longer waves, potentially due to the distance of the platform to the wave generator. Thirdly, the surge response of the HiPRWind subject to bichromatic waves were performed and compared to the experiments. Taking into account the experimental difficulties associated with measuring second-order quantities accurately, it has been found that the computed movements of the platform are in reasonable correlation with the experimental data. In the fourth and final stage, a validation of irregular waves under two different condition were carried out and the up to second-order movements amplitudes predicted numerically were compared with the experiments, showing good phase correlation, and reasonable correlation in amplitude.
With regards to the modelling of the mooring lines, results obtained for bichromatic waves correlate well with the experimental results. Both the quasi-static catenary model and the nonlinear FEM dynamic cable provide reasonably similar results. For irregular waves, the loads induced by the dynamic cable on the structure and the experimental results share a similar pattern for the frequency range analysed.
In conclusion, the second-order time-domain FEM model presented in this work, along with the mooring models used, are a good alternative for solving the second-order seakeeping of floating platforms.
Acknowledgements
The authors acknowledge EC Nantes whose facilities (used under the EU MARINET program) made this work possible.
The authors thank Acciona Energía and Fraunhofer Institute, and especially Raul Manzanas, for providing the data regarding the FP7 project HiPRWind, and the “Universidad Politécnica de Madrid” for granting access to EU MARINET SEMISO project experimental results.
Thanks to Carlos Lopez Pavon for providing the numerical results obtained using WADAM/SIMO and shown in this work.
The research leading to these results has received funding from the Spanish Ministry for Economy and Competitiveness under Grants ENE2014-59194-C2-1-R and ENE2014-59194-C2-2-R (X-SHEAKS).
The authors also fully acknowledge the support of NVIDIA Corporation for the donation of a TeslaK20 GPU used for this research.
References
[1] Hanson, T. D., Skaare, B., Yttervik, R., Nielsen, F. G. and Havmoller, O., 2011, “Comparison of Measured and Simulated Responses at the First Full Scale Floating Wind Turbine HYWIND,” Presented at EWEA 2011, European
Wind Energy Association, Brussels, Belgium.
[2] Roddier, D., Cermelli, C., Aubault, A. and Weinstein, A. “Windfloat: A Floating Foundation for Offshore Wind Turbines,” J. Renewable Sustainable Energy 2010, 2(3), 033104. doi: http://dx.doi.org/10.1063/1.3435339
[3] Maine International Consulting LLC, 2012, “Floating Offshore Wind Foundations: Industry Consortia and Projects in the United States, Europe and Japan,” Overview Report, Bremen ME.
[4] Breton S.P. and Moe H. Status, plans and technologies for offshore wind turbines in Europe and North America. Renew Energy 2009; 34:646-54.
[5] Strach-Sonsalla M. and Muskulus M. Prospects of Floating Wind Energy, International Journal of Offshore and Polar Engineering, 2016. 26:81-87.
[6] Lupton, R.C. and Langley, R.S. Scaling of slow-drift motion with platform size and its importance for floating wind turbines. Renewable Energy 2017; 101: 1013-1020. Doi: https://doi.org/10.1016/j.renene.2016.09.052
[7] Lopez-Pavon, C., Watai, R. A., Ruggeri, F., Simos, A. N. and Souto-Iglesias, A. Influence of Wave Induced Second-Order Forces in Semisubmersible FOWT Mooring Design. Journal of Offshore Mechanics and Arctic Engineering 2015; 137 / 031602-1.
[8] Peiffer, A., Aubault, A. and Weinstein, J., 2011, “A Generic 5 MW Windfloat for Numerical Tool Validation & Comparison Against a Generic Spar,” ASME Paper No. OMAE2011-50278.
[9] Liu, Y., Li, S., Yi, Q. and Chen, D. Developments in semi-submersible floating foundations supporting wind turbines: A comprehensive review. Renewable and Sustainable Energy Reviews 2016; 60:433–449.
[10] Liua M., Xiaoa, L., Lua, H. and Shia J. Experimental investigation into the influences of pontoon and column configuration on vortex-induced motions of deep-draft semi-submersibles. Ocean Engineering 2016; 123: 262–277.
[11] Philippe, M., Babarit, A. and Ferrant, P. Aero-Hydro-Elastic Simulation of a Semi-Submersible Floating Wind Turbine. J. Offshore Mech. Arct. Eng 136(2), Paper No: OMAE-13-1006; doi: 10.1115/1.4025031.
[12] Coulling, J.A., Goupee, J.A., Robertson A.N. and Jonkman, J.M. Importance of Second-order difference wave diffraction forces in the validation of FAST semi-submersible floating wind turbine model. ASME 2013 32nd International Conference on Ocean, Offshore and Arctic Engineering Nantes, France June 9-14, 2013.
[13] Bayati, I., Joknman, J., Robertson, A. and Platt, A. The effects of second-order hydrodynamics on a semisubmersible floating offshore wind turbine. Journal of Physics: Conference Series 524 (2014) 012094 doi:10.1088/1742-6596/524/1/012094.
[14] Matos, V.L.F, Simos, A.N. and Sphaier, S.H. Second-order resonant heave, roll and pitch motions of a deep-draft semi-submersible: Theoretical and experimental results. Ocean Engineering 2011. 38: 2227–2243.
[15] Simos, A. N., Ruggeri, F., Watai, R. A., Souto-Iglesias, A., Lopez-Pavon, C. Slow-drift of a floating wind turbine: An assessment of frequency-domain methods based on model tests, Renewable Energy, Volume 116, Part A, February 2018, Pages 133-154, ISSN 0960-1481, https://doi.org/10.1016/j.renene.2017.09.059
[16] Servan-Camas, B. and García-Espinosa, J. Accelerated 3D multi-body seakeeping simulations using unstructured finite elements. J Comput Phys 2013; 252:382e403.
[17] Servan-Camas, B. A time-domain finite element method for seakeeping and wave resistance problems. School of Naval Architecture and Ocean Engineering, Technical University of Madrid; 2016 [Doctoral thesis]. http://oa.upm.es/39794/1/BORJA_SERVAN_CAMAS.pdf
[18] Gutiérrez-Romero, J.E., Serván-Camas, B., García-Espinosa, J. and Zamora-Parra, B. Non-linear dynamic analysis of the response of moored floating structures. Marine Structures 2016; 49:116-137.
[19] Compassis. SeaFEM Theory Manual. Retrieved from www.compassis.com/soporte. 2016.
[20] Jonkman, J.M. Dynamic modelling and loads analysis of an offshore floating wind turbine, Technical report NREL/TP-500-41958; November 2007.
[21] Fernandes, A. C. and Levy, L. A. P. Cálculo de esforços de onda de primeira e segunda ordem em navios e plataformas flutuantes através de integração azimutal analítica, Congresso da SOBENA (1990). Río de Janeiro, Rj, Brazil.
[22] Kudou, K. The drifting force acting on a three-dimensional body in waves, J.S.N.A. Japan 1977; Vol. 141.
[23] Pinkster, J. A. Low frequency second order wave exciting forces on floating structures. Wageningen: Netherlands Ship Model Basin 650 (1981).
[24] Suliz, W. Diffraction of second-order surface waves by semisubmerged horizontal rectangular cylinder. J. Waterway, Port, Coastal, Ocean Eng. 1993; Vol 119, 160-171.
[25] Eatock Taylor, R. and Huang, J. B. Semi-analytical formulation for second-order diffraction by a vertical cylinder in bichromatic waves. Journal of Fluids and Structures 1997; 11, 465 – 484.
[26] Shao, Y.L. and Faltinsen, O.M. Numerical Study on the Second-Order Radiation/Diffraction of Floating Bodies with/without Forward Speed. 25th Workshop on Water Waves and Floating Bodies 2010, Harbin, China.
[27] Kim, M.H. and Yue, D.K.P. The complete second-order dif fraction solution for an axisymmetric body. Part 2 :
bichromatic incident waves and body motions. J. Fluid Mech 1990, 211: 557-593.
[28] Moubayed, W.I. and Williams, A.N. Second-Order Hydrodynamic Interactions in An Array of Vertical Cylinders in Bichromatic Waves. Journal of Fluids and Structures 1995, 9: 61-98.
[29] The HiPRWind Project. (2017, June 01). Retrieved from http://hiprwind.eu/
[30] Sesam user manual: Wadam, Det Norske Veritas, 2010. Retrieved from https://projects.dnvgl.com/sesam/manuals/Wadam_UM.pdf
[31] Faltinsen, O. M. Sea loads on ships and offshore structures. Cambridge University Press, 1990.
Document information
Published on 01/01/2018
DOI: 10.1016/j.marstruc.2017.12.001
Licence: CC BY-NC-SA license
