Abstract
By employing the lattice-Boltzmann method (LBM) with respect to Bhatnagar–Gross–Krook (BGK) collision model, a 2-D computational study is performed to investigate the flow structures, force coefficients and vortex-shedding characteristics behind a single-square cylinder and two side-by-side cylinders at different spacing conditions (1.0 ⩽ T/D ⩽ 4.5). The flow patterns around the square cylinders are determined using the contour plot. Significant observations from this study are as follows: (a) a flip flop regime is observed for T/D = 1.0, whereas a wiggling/Flutter shielding pattern is observed at T/D = 3.5 and a synchronized flow pattern is observed for the spacing ratio of T/D = 4.5, (b) the frequencies observed for the smaller spacing ratios (T/D = 1.0; 3.5) having numerous peaks in the spectra. Subsequently the frequencies were observed at T/D = 4.5 having a single dominating peak frequency, (c) the main motivation for the significant variation in flow patterns is due to the changes in mean drag coefficients, root mean square values of the aerodynamic coefficients and Strouhal number, (d) it is observed that the formation of vortex strongly depends on the spacing ratios between the cylinders. From the results, it is identified that the cylinders at higher spacing ratios (T/D = 4.5) produce minimum oscillation when compared to the smaller spacing ratios.
Keywords
Lattice Boltzmann method; Side-by-side arrangement; Bhatnagar–Gross–Krook collision model; Vortex shedding
Nomenclature
L- fractional length of the test cylinder
(U = (u1, u2))- flow velocity
Re- Reynolds number
T- center-to-center transverse spacing (pitch) (m)
T/D- transverse Pitch Ratio
U- free stream velocity
Cd- drag coefficient
St- Strouhal number
Cl- lift coefficient
St- Strouhal number
t- time
c- damping parameters
k- stiffness
f- vortex shedding frequency
- unitary velocity along the direction “i”
D′- space dimensions (D’2Q9 Lattice)
Q- number of particles in the computational node adopted
- velocity flow field
- pressure field
Lx- longitudinal length of the computational domain
Ly- vertical length of the computational domain
1. Introduction
The fluid flow over the structures has been widely investigated by many researchers especially tubes employed in heat exchangers, wind turbines etc. In the view of controlling the vortex shedding and thus reducing the flow-induced vibration, it becomes a challenging problem in the field of fluid dynamics. The vibration induced by the fluid flow can be classified according to the nature of the fluid structure interaction, as shown in the following Table 1.
| Mechanism causing vibration | |
| 1. | Additional added masses |
| 2. | Inertial coupling effect |
| 3. | Instability due to parallel flow |
| 4. | Induced vibration due to turbulence |
| 5. | Induced vibration due to ocean wave |
| 6. | Sonic fatigue |
| 7. | Induced vibration due to vortex shedding |
| 8. | Galloping and flutter |
| 9. | Induced vibration due to fluid elastic instability |
| 10. | Multi-phase buffeting |
| 11. | Acoustic resonance |
| 12. | Hydraulic transients |
| 13. | Environmental excitation |
| 14. | Transmitted mechanical vibration |
Among that, four excitation mechanisms were observed to be significant for the induced vibrations during fluid structure interaction, Blevins [4], which were as follows, (a) Turbulent Buffeting, (b) Vortex Shedding, (c) Acoustic Resonance, and (d) Fluid elastic instability.
The fluid-flow is broadly classified into three, i.e. internal, external and free shear flow. The present study is about the Flow induced vibration (FIV) due to the external flow of fluid over the bluff bodies i.e. square cylinders. Basically interaction between the fluids and the structures is more of a complex phenomenon to study. Shiels et al. [24] found that the Flow induced vibration (FIV) of an elastically constrained 2-D circular cylinder has become a significant problem in studying the interaction between the fluids and structures. For these types of problems, Cheng and Zhou [6] suggested the novel surface perturbation technique to control the factors which are involved in the fluid–structure interactions such as vortex shedding, flow-induced vibrations and vortex-induced noises. From the view of various researchers, some possible sources for the Flow induced vibration (FIV) and its analyzing techniques are stated below. The Flow Induced Vibration (FIV) is developed due to an alternating low-pressure, caused by the vortex shedding, behind a submerged cylinder, Lee et al. [12]. From the studies of Pettigrew et al. [22], it was identified that the occurrences of vibration induced in the tube bundles by the cross flow are mainly due to the fluid elastic instability. Ajith Kumar and Gowda [2], and Korkischko and Meneghini [18] suggested that the total number of cylinders and its arrangements were one of the parameters which had significant impact on the induced vibration due to fluid flow. Kang et al. [17], proposed an axial-flow-induced vibration model to evaluate the sensitivity to spring stiffness on the Flow Induced Vibration (FIV) of the bluff bodies. The important parameters of the heat exchangers to withstand the Flow Induced Vibration (FIV) are damping, mass per unit length, mass ratio, etc., which must be significantly evaluated at the stage of designing, Gelbe et al. [8]. Ostanek and Thole [20] investigated the near wake flow developed through the arrays of staggered pin fins in a heat exchanger. Zhou [30] experimentally investigated the flow behind three side-by-side circular cylinders using different techniques, including Particle Image Velocimetry, Hot-Wire Anemometry, Laser-Illuminated Flow Visualization and Laser Doppler Anemometry. Biswas and Ahmed [5], investigated the self-excited lateral vibration of a pipe due to an internal fluid flow and applied an integral minimum principle of Pontryagin to analyze the optimum flow velocity for lesser pipe vibration i.e. to maximize the fluid transport efficiency whereas, it is important to maximize the flow velocity while minimizing the lateral vibration of the pipe. Perotin and Granger [21], stated that the dynamic behavior of the tube equipped with all the linear and non-linear supports, deduced from an identified turbulent excitation, which provides a highly satisfactory validation for the regularized inverse identification process. Kim and Cho [23], applied a mode frequency analysis, subroutine of Structural Routine in ANSYS, to carry out the analysis of the natural frequency and relative amplitude of the tube. Jubran et al. [13], applied the newly developed joint time–frequency analysis (JTFA) techniques and in particular, the modulated Gaussian wavelet to identify the characteristics of the Flow Induced Vibration (FIV) of an elastically mounted single cylinder subjected to cross flow. Ajith Kumar et al. [3] analyzed the flow-induced oscillations of a square section cylinder under interference conditions using a data-mining tool called ‘decision tree’. Wu et al. [29], investigated the high-frequency perturbation effects on the performance, to suppress the Flow Induced Vibration (FIV) in the bluff bodies. The component failures due to excessive Flow Induced Vibration (FIV) continue to affect the performance and reliability of the equipments; such failures are very costly in terms of repairs which lead to loss of production, Pettigrew et al. [22]. Besides the study on circular cylinders under different conditions, the investigations of flow characteristics around the square cylinders/structures were also important phenomena. Some of the investigations performed on square cylinders are as follows, and Kolar et al. [19] conducted a phase averaging along with investigating the influence of vortices near the gap and at the outer shear layers on a set of square cylinders by employing the 2-component laser Doppler velocimetry at the Reynolds number of 23,100 and T/D = 2. In turn, Agrawal et al. [1] performed the numerical study on fluid flow over the square cylinders for the Reynolds number of 73, by employing linear stochastic estimation technique, whereas it is observed that the configuration of in-phase and anti-phase occurs in the flip flop regime with equal probabilities. In this article, the study is restricted to a 2D incompressible fluid flow around the square cylinders. In the current study, a numerical analysis is done by employing Lattice Boltzmann method along with a BGK collision model for single relaxation time, to identify the fluid flow characteristics and vibration excitation in the square cylinders side-by-side configuration at different spacing ratios. Further the observed results are validated with the previous work being discussed.
2. Computational analysis
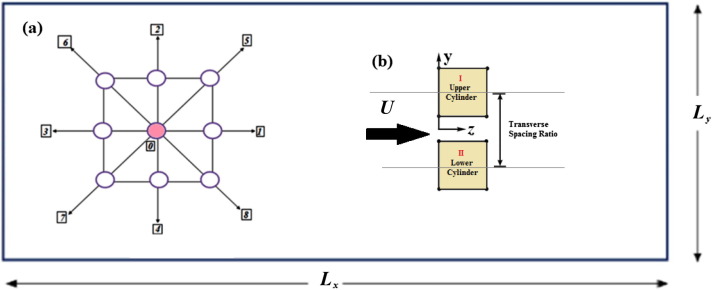
The aim of the computational study is to predict the vibration response of the side-by-side square cylinders arranged in different spacing condition. The schematic representation of the square cylinders arranged in side-by-side configuration with the applied conditions is shown in Fig. 1.
|
|
|
Figure 1. (a) Computational node with eight moving particles (representing 1–8) along with a single particle at rest (0). (b) Numerical model of square cylinders arranged in side-by-side configuration subjected to cross-flow.
|
In turn, the lattice-Boltzmann method (LBM) is employed in the current study to simulate the interaction of fluid flow with mounted square cylinders at three different transverse spacing ratios. In which represent the unitary velocity along the direction i of a D’2Q9 lattice, the D’ represents the space dimensions and Q the number of particles in the computational node adopted for the study. Where, the unitary cell is a square developed by quad, =1.0, in turn the principal direction by the quad, = , diagonals and by single = 0. Let designate the particle dispensation in the ‘i’ direction of the plot , at the time t. The Lattice Boltzmann equation with respect to Bhatnagar–Gross–Krook (BGK) collision model is written as follows:
|
|
(1) |
In this study employing single relaxation times that are fixed in lattice units, may be evaluated by scaling every relaxation time with the Mach number in the same way as the stress relaxation time, in lattice units. The acceptable incompressible limit exists if the modes are assigned for a fixed Reynolds number Re , instead of an explicit relaxation time. This Reynolds number may differ from the usual Reynolds number associated with the shear viscosity, but establishes the relaxation time as a function of Reynolds number, Mach number, and spatial resolution by the similar formula that relates the stress relaxation time to the accustomed Reynolds number. The is an equilibrium distribution that can be contemplated as a D2Q9 Gaussian quadrature of Maxwell–Boltzmann continuous distribution function [X. He, L.S. Luo] is given as
|
|
(2) |
where = 1/9 of the principal axis particle, i = 1, 2, 3, 4; wi = 1/36 of the diagonals particles, i = 5, 6, 7, 8; and = 4/9 for the rest of the particle respectively. For the D2Q9 lattice = is the square for the LB sound velocity. In each time step, the velocity flow field and the pressure respectively are deliberated by employing
|
|
(3) |
|
|
(4) |
In order to extend the results upon an infinite number of cylinders, in this case a recurrent boundary condition is applied on the lateral sides of the cylinders (Fig. 1). A bounce–back condition is employed for simulating the flow adherence at the boundaries of the solids, in which, by necessitate that for all the b-area at the fluid domain closest to the solid-boundaries also for all the domains in the direction ‘i’, where a rough surface developed with respect to the discreteness of the considered discrete circles, which needed to enlarge the simulation domain until the results observed from simulation become insentient to the effects of discreteness. To overcome the stability related problems occurring in other methods during the simulation, as per the X. He, L.S. Luo [10] demonstration, Lattice Boltzmann equation is considered to be a special form of discrete Boltzmann continuous equation. According to that, some attempt has been taken in consideration for the lattice Boltzmann simulations, in re to implement the irregular lattices and/or varying the mesh size. For varying the mesh size an interpolation is required, which results in the increase in the stability related problems, where, the present study is restricted to uniform D2Q9 lattice. The Reynolds number is calculated by using
|
|
(5) |
In which L represents the frontal length of the test cylinder, where is the LB kinematic viscosity in D2Q9 lattice. The complete force exerted by the fluid on the surface of square cylinders having the surface boundary is deliberated as,
|
|
(6) |
whereby deliberating the momentum variation at each area in the fluid domain adjacent to the boundary surface, taking into account the particles in the direction of ‘i’ indicating the surface, prior to the propagation, which bounce back in the ‘−i ’ direction, besides propagation, . In turn, in this case the drag and the lift forces are in x and y directions with respect to , where the flow pattern is proportional with respect to main flow (x) direction, the lift force is found to be zero. Normally, it is happened with respect to the immersed cylinders at smaller Reynolds number. Whenever Reynolds number increased, the vortex shedding behind the bluff bodies producing an oscillating lift and amplitude similar to the frequency of the vortices developed, and the average Drag Cd and Lift coefficient Cl is deliberated with respect to the time average as
|
|
(7) |
|
|
(8) |
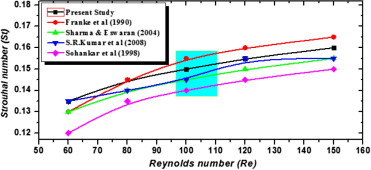
The code employed in this study is validated by comparing the results of single square cylinder with results of previous studies. By employing a parabolic velocity inlet profile the variation in St with respect to the Re is plotted in Fig. 2
|
|
(9) |
where f represents the vortex shedding frequency, and in turn the observed results were found to be in good agreement with the results of previous studies, which shows the reliability of the code employed along with the spatial and temporal resolutions.
|
|
|
Figure 2. Variation in the St with respect to Re for a single square cylinder. [7] and [25]
|
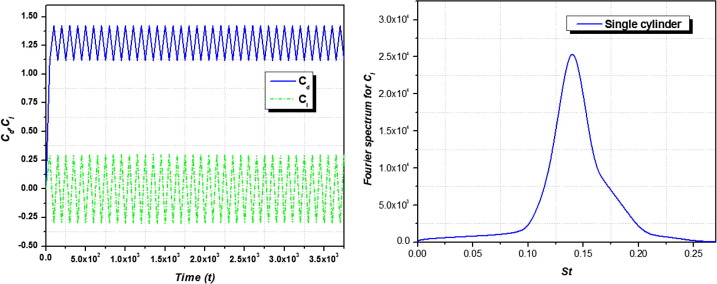
The drag and lift coefficients along with spectral analysis of the single square cylinders at Re = 100 are given in Fig. 3. It clearly shows that the excitation behavior of the single square cylinder in the range of 0.28, and further the Fourier spectrum of the lift coefficients clearly state the peak at 2.5 ∗ 10e4.
|
|
|
Figure 3. (a) Cd, Cl of an mounted square cylinder at Re = 100; (b) Fourier spectrum of Cl at Re = 100.
|
2.1. Problem description and mesh system
In the article, single and two square cylinders are investigated at different interference cylinders arranged symmetrically with respect to the Cartesian coordinates at Re = 100. The transverse spacing ratio between the cylinders varies from T/D = 1.0, 3.5, 4.5 respectively. The schematic representation of the computational area is shown in Fig. 1(b) along with the boundary conditions, where the entire computational area is defined as , where Lx = 1000 and Ly = 300 regarding the boundary condition, and a no-slip boundary condition is applied on the cylinder surface. In turn a Dirichler boundary condition employed on the inlet is , where at the outlet of computational area the boundary condition is , whereas at the other lateral boundaries, a slip boundary condition is applied as and (U = (u1; u2)) represents the velocity of the fluid. The spatial ability is further tested by changing the number of respective grid points (12, 24 & 48) that delineate the cylinder, also comparing the St values for different Re in Table 2. Regarding the 12-point grid the computational domain consists of 400 × 100 points along the longitudinal and transverse directions, gaining a blockage ratio of 0.16, where it is apparent that the difference in the St between the three resolution for a range of Re is found to be less (<5%) and further the drag coefficient and vibration amplitude indicating a difference of 2.2% and 0.5%, respectively between the grid points of 24 and 48. From the result, it is observed that at the convergence has taken place at the grid having 24 points.
| Re = 60 | Re = 80 | Re = 100 | Re = 120 | Re = 150 | Cd | Cl | ||
|---|---|---|---|---|---|---|---|---|
| St | 12 points | 0.1334(0.6%) | 0.1396(0.6%) | 0.1456(0.6%) | 0.1515(0.6%) | 0.1556(0.5%) | 1.377(1.2%) | 0.381(1.0%) |
| 24 points | 0.1351(0.6%) | 0.1412(0.5%) | 0.1462(0.5%) | 0.1522(0.6%) | 0.1571(0.5%) | 1.383 | 0.386 | |
| 48 points | 0.1367 | 0.1412 | 0.1467 | 0.1521 | 0.1576 | – | – |
Ensuing test with square cylinders in the cross flow satisfied with the observed results. Initially, it was recognized that the deviation in the results between the 12 and 24 grid point is found to be small, which suggests that the 24 grid point might be suitable for the computation. The maximum value was observed for the normalized u′ (longitudinal velocity component) and v′ (transverse velocity component) in the flip flop regime of 25% and 36% for the 12 points grid, and in turn for the 24 grid point the flip flop regime is observed to be 26% and 37%. Besides, the test on lift and drag coefficient shows a converged result within 2%. Certainly upon increasing the resolution to 48 grid points for all the phenomena discussed in this article shows an excellent agreement with the observed value of St. From the above test results, the ability of producing better results on a 24 grid point is proved for all the ensuing computations. To assure the mesh independency, a mesh refinement study is determined for the numerical resolution. Two cases of grid system are employed, named respectively as G1 and G2 considered for the mesh independence study, and the mesh generation parameters are shown in Table 3. At the period of mesh refinement, the time integration is performed by employing the predictor – corrector method, where the non-dimensional time integration interval is set to 0.001 for the grids G1 & G2 respectively. In Table 3, the global parameters of the calculated values for the test cylinders are mentioned. From Table 3, it is observed that the mesh changes from G1 to G2, bestow the test results observed, at low Reynolds number the agreeable spatial and temporal resolutions for the simulations can be obtained by employing the grid G2 at . The total mesh employed in the grid G2 for the case of square cylinder with two interfering cylinders arranged in staggered configuration in upstream at different spacing ratios consists of, total 65,544 elements with 34,342 nodes.
| Condition | Grid system | Elements | Nodes |
|---|---|---|---|
| Single cylinder | 12 | 50,162 | 25,285 |
| 24 | 54,598 | 28,527 | |
| Two cylinders at 1.0 | 12 | 52,578 | 26,039 |
| 24 | 65,226 | 33,065 | |
| Two cylinders at 3.5 | 12 | 54,768 | 26,894 |
| 24 | 65,431 | 34,326 | |
| Two cylinders at 4.5 | 12 | 54,758 | 26,886 |
| 24 | 65,544 | 34,342 |
3. Results and discussion
3.1. Drag and lift coefficients
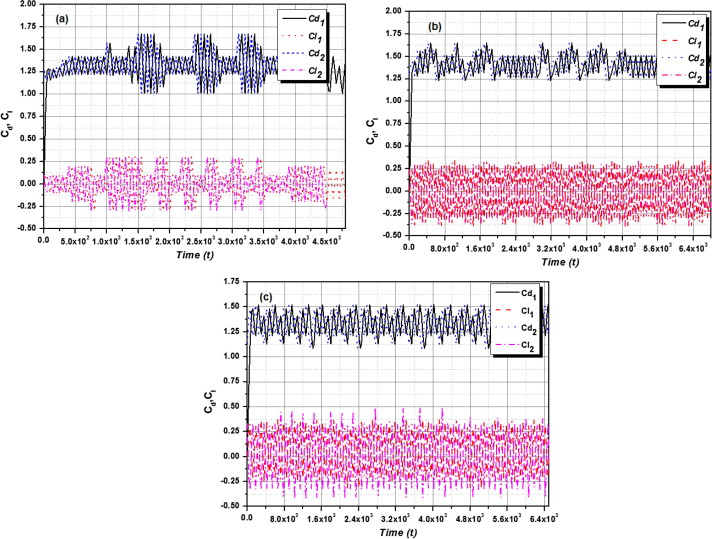
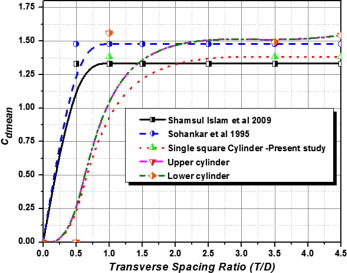
In the interest of compendiousness, three groups of drag and lift force time histories represented with respect to the transverse spacing ratios T/D = 1.0, 3.5, 4.5 respectively in Fig. 4(a–c). Whereas the solid green line represents the drag coefficient, the stretched line represents the lift coefficient. From the results, it was observed that irregular vortex shedding and non periodic frequencies of lift and drag coefficients occurred at the smaller transverse spacing ratio shown in Fig. 4(a). The mean value for the drag coefficient Cd mean is represented in Fig. 5 as a function of T/D, whereas, it is compared with the results of previous work observed for a single cylinder, it shows that, the calculated drag coefficient is decreasing at the initial stage and then slowly increasing with respect to the increase in the transverse gaping ratios T/D, in which at smaller spacing ratios the free shear layer developed in the outer wake may affect the adjacent cylinder resulting in the increase of maximum vibration amplitude.
|
|
|
Figure 4. (a) Drag and Lift force coefficient response of the mounted side-by-side square cylinders at T/D = 1.0 (Upper cylinder; Lower cylinder); (b) Drag and Lift force coefficient response of the mounted side-by-side square cylinders at T/D = 3.5 (Upper cylinder; Lower cylinder); (c) Drag and Lift force coefficient response of the mounted side-by-side square cylinders at T/D = 4.5 (Upper cylinder; Lower cylinder).
|
|
|
|
Figure 5. Mean drag coefficient with respect to change in the Transverse spacing ratios (T/D) at Re = 100.
|
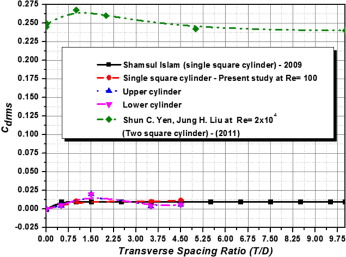
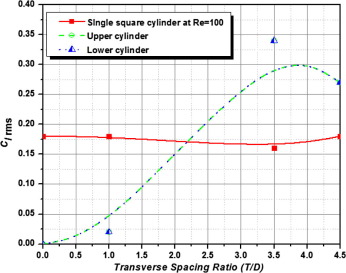
The vibration amplitude and wake patterns were briefly discussed in the following sections. In turn, a significant variation in the mean drag coefficients between the test cylinders in the transverse gap ratios ranges between 1.0 and 3.5, which shows that the fluid flow acquaintance shows a significant transformation in the flow patterns in the respective regimes. The Cdrms, & Clrms, are the root mean square values (rms) of drag and lift coefficients respectively ( Figure 6 and Figure 7), where the variation in the rms values of drag and lift for the cylinders at smaller gaping ratios such as 1.0, and 3.5 represents that the developed free shear layers from the test cylinders were reattached with the adjacent surface or the structures. Whereas the spacing ratio at 4.5 increases the rms values of the drag coefficients test cylinder start to decrease. This shows that the effects are due to the variation in the vortex formation and vortex shedding. At smaller transverse gaping ratios, the rms values of the lift coefficient are observed to be vey less. When the test cylinders initiate to shed the vortices with respect to the spacing ratios, the rms values are found to be increasing after the spacing ratios of 3.5, whereas at certain gaping ratios, the root mean square value (rms) of lift coefficient is increasing in the initial stage and then starts to decrease with respect to increase in the gaping ratio T/D.
|
|
|
Figure 6. Variation of Cd rms values with respect to change in the Transverse spacing ratios (T/D) at Re = 100.
|
|
|
|
Figure 7. Variation of Cl rms values with respect to change in the Transverse spacing ratios (T/D) at Re = 100.
|
3.2. Spectral frequency
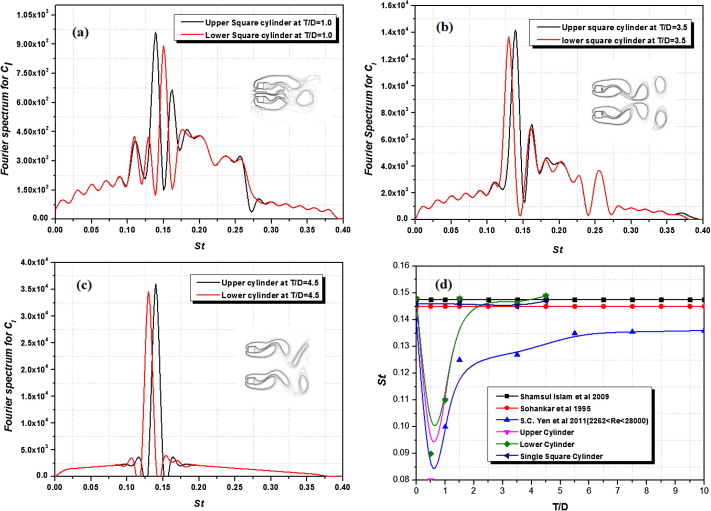
The Fourier spectrum analysis for the lift the coefficients is carried out at three different spacing ratios as T/D = 1.0, 3.5, & 4.5 respectively to identify the Strouhal number. Further, the Strouhal number is obtained by identifying the spectral domination in the respective spectra. The results of the Fourier spectral analysis for the mounted side by side square cylinder at T/D = 1.0 are represented in Fig. 8(a)). Similarly the subsequent results at T/D = 3.5 & 4.5 are represented in Fig. 8(b) and (c) respectively. Besides, a single domination peak is observed for the mounted square cylinder at T/d = 4.5, which represents the vortex shedding frequency. In turn for smaller gap ratios, there is a definite peak observed at the spectra, and it gives a primary non dimensional vortex shedding frequency in the test cylinders. At higher spacing ratios the vortex shedding frequency is observed to be a single dominant peak in the spectral area of Fig. 8(c). Further the changes in the Strouhal number with respect to the spacing ratio T/D at Re = 100 are validated with the results of previous work in single and multiple square cylinders arranged in side-by-side configuration [26], [27] and [28] is shown in Fig. 8(d). This reveals that, the Strouhal number observed for the single cylinders was found to be almost equal at Re = 100, and further the Strouhal number with respect to the cylinders arranged in side by side configuration is found to be decreasing with increase in the spacing ratio until it reaches T/D = 3.5.
|
|
|
Figure 8. (a) Fourier Spectrum for Cl at T/D = 1.0; Re = 100; (b) Fourier Spectrum for Cl at T/D = 3.5; Re = 100; (c) Fourier Spectrum for Cl at T/D = 4.5; Re = 100. (d) Variation in the St with respect to T/D.
|
3.3. Pressure coefficient
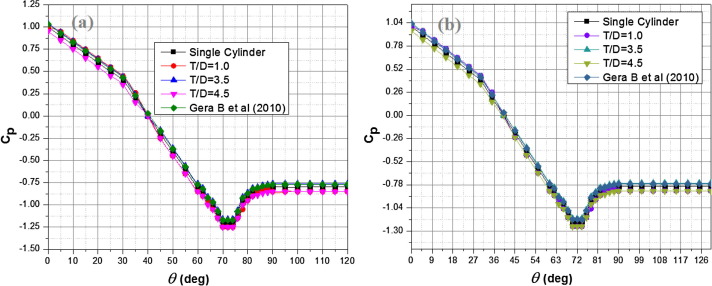
The mean pressure coefficient (Cp) distribution on the surface of the test cylinder is analyzed and the observations are shown in Fig. 9. Besides from the stagnation point the angle (θ) is measured in clockwise direction. The present study on square cylinders, the pressure distribution at different range of Reynolds number shows in general of having good agreement with the empirical data of the referenced research work [9]. Subsequent to the point at, where the slope of the pressure coefficient is observed to be changing it curve length, in general the observed behavior of the pressure coefficient on the surface of the test cylinders. On the other hand, the base pressure coefficient is difficult for computation because of its correlation with the shedding frequency, length of the large scale vortex formation and the span wise vorticity of the Karman vortices along with the cylinder aspect ratio.
|
|
|
Figure 9. Pressure coefficient of the square cylinders at different spacing ratios: (a) lower cylinder, (b) Upper cylinder.
|
3.4. Flow structures
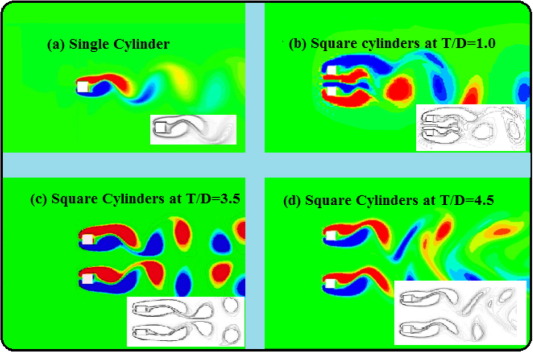
The vortex shedding is one of the significant phenomena for the induced vibration during the fluids–structure interaction. Whenever it is formed, the vortices were alternatively shed in the top and bottom of the cylinder surfaces. Besides there are always some physical changes accompanied with the vortex shedding during the fluid flow over structures. In this article, the different flow pattern observed for the mounted side by side square cylinder was discussed as follows. Basically the flip flop flow regime is observed to be a narrow and wide wake behind the test cylinders respectively. In the present study by employing LBM, for the case of T/D = 1.0; Re = 100 (Fig. 10(b)), the results reproduce the characteristic feature of the flip flop regime exactly by exploring the bi-stable characters of the flow. It was identified that for certain period of times, the vortices observed behind the one cylinder are found to be maximum 3-times on the stream as compared to the adjacent test cylinder. Besides, an interesting fact was observed for the simulation with lesser resolution, and the flow will become unstable within a fewer steps of computation due to its unstable characters in the flow regime.
|
|
|
Figure 10. (a) Flow characteristics of single square cylinder, (b) Flow characteristics of mounted side by side square cylinders at T/D = 1.0, (c) Flow characteristics of mounted side by side square cylinders at T/D = 3.5, (d) Flow characteristics of mounted side by side square cylinders at T/D = 4.5.
|
The instability in the regime is appeared due to the interaction of the fluid flow between the test cylinders with respect to the wakes in the adjoining. From Fig. 10(c), an irregular flow pattern is observed that is for the mounted side by side square cylinders at T/D = 3.5, whereas, it is found out that the free shear layer in the inner area is reattached to the surface of the lower test cylinder. As the result of free shear layer in the outer area is alternatively flutter near the lower cylinder, this type of fluid flow pattern is mentioned as wiggling/flutter shielding fluid flow pattern. In the case of wiggling/flutter shielding flow pattern, the St is observed to be smaller than the single square cylinder. Fig. 10(d) reveals to be a finest agreement of synchronized regime with respect to the vortex shedding locked at in-phase, whereas, the shedding of vortex is observed at the initial stage of simulation due to the fact that fluid flow starts from the rest [11]. Besides the relative distance between the observed vortices is compared, which reveals that the interaction of the inner vortices is found to be stronger than the outer one. This shows that the effects of outer vortices on the structures are nearly suppressed with respect to the inner vortices.
4. Conclusion
In this study a 2-D Numerical investigation is performed to analyze the fluid flow characteristics over a single-square cylinder and two side-by-side square cylinders for different spacing ratios at Reynolds numbers (Re = 100). The flow behaviors and flow patterns were examined in detail, and the aerodynamic coefficients along with the vortex-shedding frequency are determined. Further the significant observations throughout the study were as follows, and there were four different fluid flow patterns observed for the test cylinders arranged in various spacing conditions:
- A flip flop regime is observed for T/D = 1.0, whereas a wiggling/Flutter shielding pattern is observed at T/D = 3.5 and a synchronized flow pattern is observed for the spacing ratio of T/D = 4.5
- The frequencies observed for the smaller spacing ratios (T/D = 1.0; 3.5) have numerous peaks in the spectra. Subsequently the frequencies observed at T/D = 4.5 have a single dominating peak frequency.
- The main motivation for the significant variation in flow patterns is due to the changes in mean drag coefficients, root mean square values of the aerodynamic coefficients and Strouhal number.
- It is perceptible that the formation of vortex strongly depends on the spacing ratios between the cylinders. From the results, it is identified that the cylinders at higher spacing ratios (T/D = 4.5) produce minimum oscillation when compared to the smaller spacing ratios.
Acknowledgment
Authors gratefully acknowledge the support of research grant (No. SB/FTP/ETA-389/2012) awarded by the Department of Science and Technology (DST), Government of India.
References
- [1] A. Agrawal, L. Djenidi, R.A. Antonia; Investigation of flow around of a pair of side-by-side square cylinders using the lattice Boltzmann method; Comput. Fluids, 35 (2006), pp. 1093–1107
- [2] R. Ajith Kumar, B.H.L. Gowda; Flow-induced vibration of a square cylinder without and with interference; J. Fluids Struct., 22 (2006), pp. 345–369
- [3] R. Ajith Kumar, V. Sugumaran, B.H.L. Gowda, C.H. Sohn; Decision tree: a very useful tool in analyzing flow-induced vibration data; Mech. Syst. Signal Process., 22 (2008), pp. 202–216
- [4] R.D. Blevins; Flow –Induced Vibration; (second ed.)Van Nostrand Reinhold, New York (1990)
- [5] Saroj K. Biswas, N.U. Ahmed; Optimal control of flow-induced vibration of pipeline; Dyn. Control, 11 (2001), pp. 187–201
- [6] L. Cheng, Y. Zhou; Surface perturbation technique for flow-induced vibration and noise control; J. Sound Vib., 310 (2008), pp. 527–540
- [7] R. Franke, W. Rodi, B. Schonugh; Numerical calculation of laminar vortex-shedding flow past cylinders; J. Wind Eng. Ind. Aerodyn., 35 (1990), pp. 237–257
- [8] H. Gelbe, M. Jahr, K. Schroder; Flow-induced vibrations in heat exchanger tube bundles; Chem. Eng. Process., 34 (1995), pp. 289–298
- [9] B. Gera, Pavan K. Sharma, R.K. Singh; CFD analysis of 2D unsteady flow around a square cylinder; Int. J. Appl. Eng. Res., 1 (3) (2010), pp. 602–610
- [10] X. He, L.S. Luo; Theory of lattice Boltzmann method: from the Boltzmann equation to the lattice Boltzmann equation; Phys. Rev. E, 56 (1997), pp. 6811–6817
- [11] S. Hiejima, T. Nomura, K. Kimura, Y. Fujino; Numerical study on the suppression of the vortex induced vibration of a circular cylinder by acoustic excitation; J. Wind Eng. Ind. Aerodyn. (1997), pp. 325–335
- [12] Hyun-Boo Lee, Tae-Rin Lee, Yoon-Suk Chang; Numerical simulation of flow-induced bidirectional oscillations; J. Fluids Struct., 37 (2013), pp. 220–231
- [13] B.A. Jubran, M.N. Hamdan, N.H. Shabaneh; Wavelet and chaos analysis of flow induced vibration of a single cylinder in cross- flow; Int. J. Eng. Sci., 36 (1998), pp. 843–864
- [14] K. Karthik Selva Kumar, L.A. Kumaraswamidhas; Experimental investigation on flow induced vibration excitation in the elastically mounted circular cylinder in cylinder arrays; Fluid Dyn. Res., 47 (2015), p. 015508
- [15] K. Karthik Selva Kumar, L.A. Kumaraswamidhas; Experimental investigation on flow induced vibration excitation in the elastically mounted square cylinders; J. Vibroeng., 17 (2015), pp. 468–477
- [16] K. Karthik Selva Kumar, L.A. Kumaraswamidhas; Large eddy simulation of turbulent fluid flow over circular tube bundle; Roman. J. Acoust. Vibr., 12 (2) (2015), pp. 116–125
- [17] H.S. Kang, K.N. Song, H.K. Kim, K.H. Yoon; Axial-flow-induced vibration for a rod supported by translational springs at both ends; Nucl. Eng. Des., 220 (2003), pp. 83–90
- [18] I. Korkischko, J.R. Meneghini; Experimental investigation of flow-induced vibration on isolated and tandem circular cylinders fitted with strakes; J. Fluids Struct., 26 (2010), pp. 611–625
- [19] V. Kolar, D.A. Lyn, W. Rodi; Ensemble-averaged measurements in the turbulent near wake of two side-by-side square cylinders; J. Fluid Mech., 346 (1997), pp. 201–237
- [20] J.K. Ostanek, K.A. Thole; Wake development in staggered short cylinder arrays within a channel; Exp. Fluids, 53 (2012), pp. 673–697
- [21] L. Perotin, S. Granger; An inverse method for the identification of a distributed random excitation acting on a vibrating structure Part 2: flow-induced vibration application; Mech. Syst. Signal Process., 13 (1) (1999), pp. 67–81
- [22] M.J. Pettigrew, C.E. Taylor, N.J. Fisher, M. Yetisir, B.A.W. Smith; Flow-induced vibration: recent findings and open questions; Nucl. Eng. Des., 185 (1998), pp. 249–276
- [23] Sang-Nyung Kim, Yeon-Sik Cho; The analysis of flow-induced vibration and design improvement in KSNP steam generators of UCN #5, 6; KSME Int. J., 18 (1) (2004), pp. 74–81
- [24] D. Shiels, A. Leonard, A. Roshko; Flow-induced vibration of a circular cylinder at limiting structural parameters; J. Fluids Struct., 15 (2001), pp. 3–21
- [25] A. Sharma, V. Eswaran; Heat and fluid flow across a square cylinder in the two- dimensional laminar flow regime; Num. Heat Transf. A, 45 (2004), pp. 247–269
- [26] Shams ul Islam, Chao Ying Zhou, Farooq Ahmad; Numerical simulations of cross-flow around four square cylinders in an in-line rectangular configuration; World Acad. Sci., Eng. Technol., 33 (2009), pp. 09–28
- [27] Shun C. Yen, Jung H. Liu; Wake flow behind two side-by-side square cylinders; Int. J. Heat Fluid Flow, 32 (2011), pp. 41–51
- [28] A. Sohankar, C. Norberg, L. Davidson; Low-Reynolds number flow around a square cylinder at incidence: study of blockage, onset of vortex shedding and outlet boundary condition; Intl J. Num. Meth. Fluids, 26 (1998), pp. 39–56
- [29] W. Wu, J. Yuan, L. Cheng; Multi-high-frequency Perturbation effects on flow-induced vibration control; J. Sound Vib., 305 (2007), pp. 226–242
- [30] Y. Zhou; Vortical structures behind three side-by-side cylinders; Exp. Fluids, 34 (2003), pp. 68–76
Document information
Published on 12/04/17
Licence: Other
Share this document
Keywords
claim authorship
Are you one of the authors of this document?

