Abstract
Wedge shaped blocks spillways are an innovative solution that allows spilling over the downstream shoulder of earth and rock-fill dams in a safe way. However, they have been barely used as main spillway due to the lack of practical design criteria. An innovative procedure for computer-aided design of wedge shaped blocks spillways is presented in this paper. It includes the design of the drainage and supporting layer considering its seepage capacity and stability. The leakage flow through the joints between blocks is estimated by means of a numerical model calibrated and validated from experimental results. Stability against sliding of the downstream shoulder or the drainage layer is ensured, considering the properties of the granular material selected by the designer and non-linear resistance laws. The procedure will also suggest the shape of a toe protection.
Keywords: Dam, spillway, ACB, wedge-shaped-block, protections, CFD
Resumen
Los aliviaderos de bloques en forma de cuña son una solución innovadora que permite el vertido sobre el espaldón de presas de escollera y tierras de una manera segura. Sin embargo, apenas se ha utilizado esta tecnología como vertedero principal debido a la falta de unos criterios prácticos de diseño. En este trabajo se presenta un procedimiento innovador para el diseño asistido por ordenador de aliviaderos de bloques en forma de cuña, incluyendo el diseño completo del drenaje considerando su capacidad de evacuación de caudales infiltrados entre bloques y su estabilidad. El caudal infiltrado se estima por medio de un modelo numérico calibrado y validado a partir de resultados experimentales. El procedimiento propone un diseño que garantiza la estabilidad del propio espaldón de la presa ante deslizamiento en masa considerando las propiedades del material de construcción y leyes de filtración no lineales. El procedimiento también permite definir una protección para el pie de presa tipo repié de escollera.
Palabras clave: Presa, aliviadero, ACB, bloque en forma de cuña, protecciones, CFD
1. Introduction
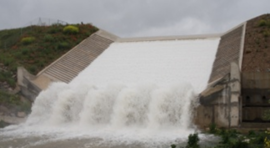
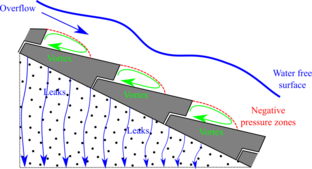
Wedge shaped blocks (WSB) are an innovative solution to protect the downstream shoulder of earth and rock-fill dams and levees against superficial erosion in overtopping scenarios in a cost effective way. The stability of WSB is based on the positive and negative pressure distribution over the block sides, which ensures its stability together with the overlapping of contiguous blocks (Figure 1).
This technology was born in the late 60s of the XX century in the former USSR [1]. Further investigations were carried out in the last thirty years in U.K [2], USA [3], Portugal [4] and Spain [5]. Based on these investigations WSB have often been used as a protection against accidental overtopping, but in a limited way as main spillway, due to the lack of a practical procedure to ensure a proper behavior for high discharge rates [6].
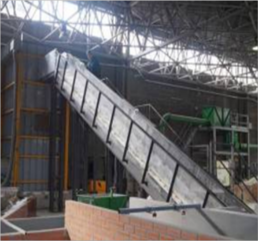
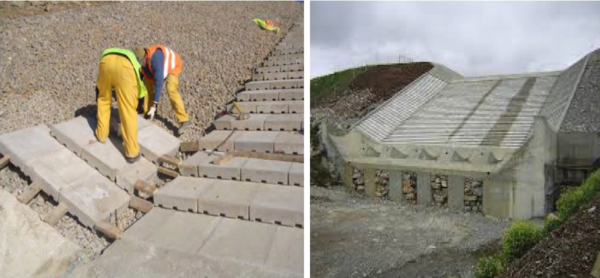
WSB are precasted and placed over the downstream shoulder of the dam (Figure 2), one by one without any sealing; therefore leakage toward the shoulder is expected in normal operation. The wedged shape of blocks and the placement of drainage orifices ensure stability against overtopped flows [7].
|
|
| Figure 1. Left: operation scheme of WSB. Right: example of WSB spillway (Barriga dam, Spain) | |
|
| Figure 2. Left: detail of the construction of WSB protection, note that each block had three drainage orifices. Right: Downstream view of WSB spillway of Barriga Dam |
This paper shows a procedure for computer-aided design of WSB spillways, which ensures the stability against sliding of the downstream dam shoulder with a sloping toe protection. It also allows defining the appropriate thickness of the drainage layer (according to the type of dam), to avoid its saturation.
2. Drainage flow
2.1 Introduction
One of the most important aspects to design WSB spillways is the estimation of the expected leakage flow through the joints between adjacent blocks and the orifices. It depends on three parameters: the slope of the spillway, the overtopping flow and the size of the WSB, which in turn determines the length of joints per surface unit.
If this drainage flow is not properly conveyed to the downstream toe, the downstream shoulder can be saturated and generate uplift on the lower side of the WSBs leading to instability. This affects the stability of the downstream shoulder and therefore the whole dam safety.
We used physical tests to calibrate and validate a numerical model that allowed obtaining results beyond the limited discharge rates and geometry of the laboratory facilities.
2.2 Numerical model
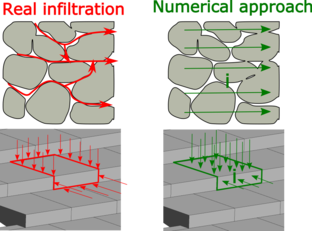
The numerical method is based on a mathematical approach in which the blocks and joints are considered as a continuum with a head loss law. This method is widely used for the numerical modeling of seepage into porous materials, and is based on the assumption that water can flow through the whole granular media, without taking into account the shape and distribution of the ducts or the solid impermeable areas of the stones. Then a head loss law () is fixed to properly simulate the head loss that takes place when the water flows through the real ducts of the porous medium, considering the following expression:
where is the hydraulic gradient, the coefficient of permeability and the seepage velocity.
In the same way, a WSB spillway can be considered as ducts (joints and orifices), embedded in a solid and impermeable matrix (body of the block), so the infiltration process can be reproduced with an appropriate head loss law, where coefficient is constant for any slope and drainage flow, because it only depends on the size and shape of blocks that define the permeability of the system composed of joints, orifices and block bodies. Figure 3 shows a schematic drawing of this numerical approach.
|
| Figure 3. Schematic drawing of numerical approach |
The finite element code used to solve this numerical approach was one of the applications implemented in the open source environment Kratos Multi-Physics [8-9], which solves according to an Eulerian framework with a fixed mesh the full Navier-Stokes equations, modified by addition of the head loss law () as dissipation term, to take into account porous fluid regions and clear fluid regions in the calculus domain. For the improvement of the simulation efficiency an edge based approach and a level set technique to track the evolution of the free surface is implemented. Turbulence is simulated without a specific model for this purpose, due to the Orthogonal Sub-scales Stabilization implemented [10-11]. The complete description of the numerical approach used was described by Larese et al. [12]. This application has already been successfully applied to several problems in dam hydraulics [13-15].
2.3 Calibration and validation of the head loss law
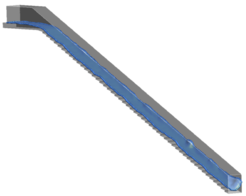
A calibration and validation process was performed to achieve an appropriate and reliable expression for the head loss law. For both, physical and numerical tests were carried out (Figure 4).
|
|
| Figure 4. Example of numerical and physical tests of calibration and validation process | |
The physical tests were performed at the CEDEX laboratory by staff of the Technical University of Madrid. The test facility consisted on a WSB spillway with height 4.7 m, width 0.5 m and downstream slope 2:1. The discharge flows tested were 200 and 240 l/s/m, and the infiltration length gauged was 6.5 m (32 rows). The measurement uncertainty of the devices for recording drainage flow is lower than 3 l/s/m. The tested blocks were the patented model ACUÑA (Figure 5), scaled to set 3 blocks per row.
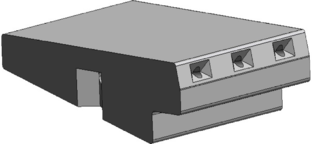
|
| Figure 5. Design of block tested ACUÑA [16] |
The numerical tests were performed in 3D, with the same mesh of finite elements, featuring mesh 650 000 tetrahedral elements with maximum element size of 0.01 m around the blocks and 0.045 m for the rest of the calculation domain.
For calibration, one physical test with discharge flow 240 l/s/m was performed. In parallel, several numerical simulations were run with different values of coefficient , and the same discharge flow (240 l/s/m). The results of the leakage flow for each numerical simulation were compared with those obtained from the physical test (Figure 6). The value of coefficient , which achieved the minimum discrepancy between physical and numerical results (0.43 l/s/m) was selected as the final solution of the calibration process ().
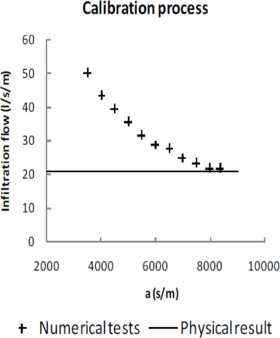
|
| Figure 6. Calibration process. Comparison between physical infiltration result and numerical results for several values of |
For validation, two numerical tests were carried out with discharge flow of 160 and 200 l/s/m and the value of coefficient previously obtained. The resulting infiltration flow rates were compared to those obtained in corresponding physical tests. The discrepancies between physical and numerical infiltration flow were 1.77 l/s/m and 0.87 l/s/m, which represent 13.3 % and 5.0 % of the infiltration flow, both within the measurement uncertainty range of the recording devices.
2.4 Results
Once the calibration and validation processes were completed, a set of 3D numerical simulations were carried out in order to obtain infiltration results for several configurations of the spillway, beyond the limited capabilities of the laboratory facilities. In this way four spillway slopes (1.5, 2.0, 2.5 and 3.0), five discharge flows (200, 300, 400, 600, 1000 l/s/m) and four lengths of spillway (8, 16, 32, 48 rows) were simulated. Figure 7 shows these results.
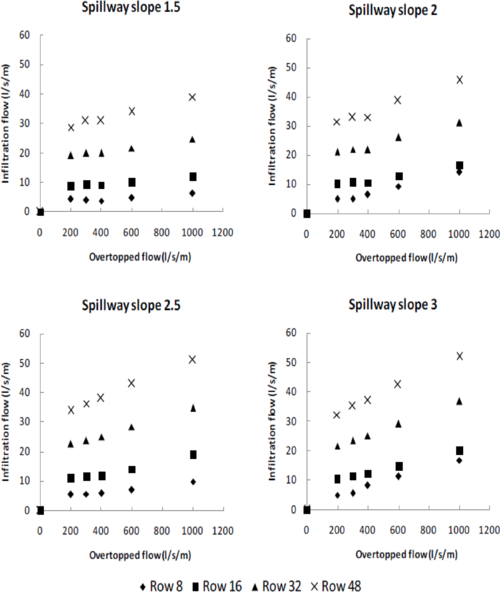
|
| Figure 7. Numerical infiltration results from several spillway slopes and several lengths of spillway (8, 16, 32, 48 block rows) |
These numerical tests allow determining the infiltrated flow for the common range of slopes of rockfill and earth dams (1.5-3) and a maximum limit of 48 rows, for homothetic blocks to that tested applying Froude scaling.
3. Calculation procedure
3.1 Solutions proposed to each type of dam
The way to drain the infiltration flow is a key aspect to design WSB spillways and depends on the type of dam.
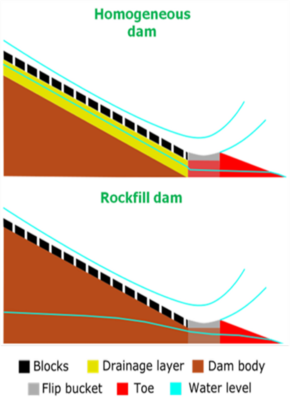
The dam body of homogeneous dams consists of an impervious material. Therefore, a drainage layer must be placed so to avoid uplift pressure on the bottom side of the blocks, with an adequate hydraulic capacity to drive the infiltration flow to the toe without becoming pressurized (Figure 8).
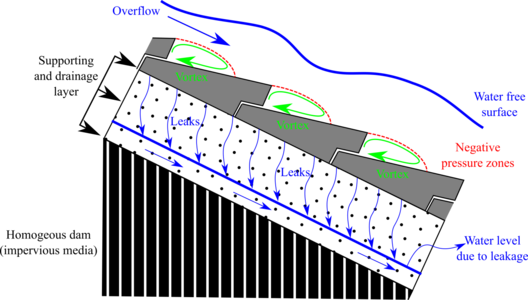
|
| Figure 8. Scheme of operation of WSB over homogeneous dam |
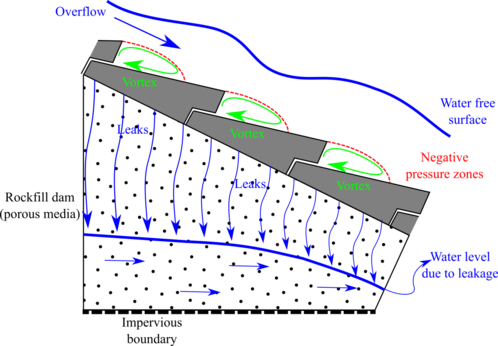
The shoulder of rockfill dams is highly permeable and leakage can flow through towards the impervious boundary defined by the foundation (Figure 9). In order to keep away blocks from uplift pressure the rockfill permeability must be sufficient to avoid contact between the bottom side of the blocks and the water free surface of the seepage net.
|
| Figure 9. Scheme of operation of WSB over rockfill dam |
The design procedure ensures that there is no water pressure under the blocks, which could affect its stability. In order to achieve this goal two solutions were proposed according to the type of dam (Figure 10).
|
| Figure 10. Schematic drawing of solutions proposed to ensure an unpressured supporting under the blocks |
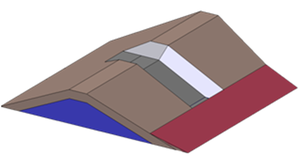
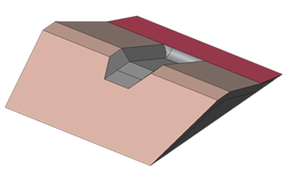
For both, the design includes a flip bucket to drive separately the overtopped flow and the infiltration flow. The flip bucket structure was successfully used in Barriga Dam [17], and consists of a concrete perimeter frame filled with porous material, depending on the type of dam. Moreover the flip bucket structure helps to support the blocks. Also for both solutions, a toe protection is disposed to drain the infiltration flow (Figure 11).
|
|
| Figure 11. 3D schematic drawing of proposed solution | |
3.2 Calculation algorithm
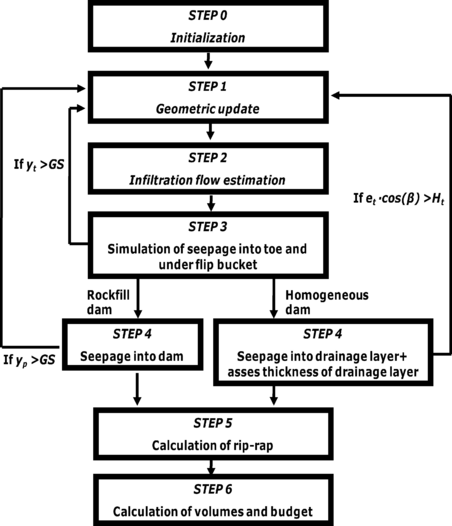
The design procedure proposed has as cornerstone the numerical drainage tests showed previously. Based on it an algorithm for designing the whole spillway for a previously chosen block size was developed, and its flowchart is shown in Figure 12. The algorithm reaches the solution through a process of successive attempts and can be programmed for automation.
The main steps of the algorithm are summarized below.
STEP 0 - Initialization
- Calculation of the stable saturated slope for the toe protection [18], according to:
where: is safety factor against mass sliding of toe protection; : saturated specific weight of the material; : toe slope angle; : specific weight of water and : friction angle.
- Calculation of an initial height of training walls from broad crested weir discharge equation:
where: : unit discharge flow; : total discharge flow; : width of spillway; : height of training walls without safety factor; : height of training walls considering safety factor; : safety factor and : gravity acceleration.
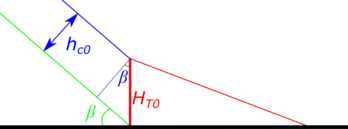
- Calculation of initial height of toe according to the expression:
where : initial height of toe; : initial height of training walls and : dam slope angle. A scheme of the geometrical meaning of the previous equation is shown in Figure 13.
|
| Figure 13. Scheme of relation between parameters : initial height of toe; : initial height of training walls and : dam slope angle |
- Calculation of homothetic factor
where: : homothetic factor; : mass of block selected for design and : mass of block tested to obtain infiltration data
STEP 1 – Geometric update
- Updating of toe height
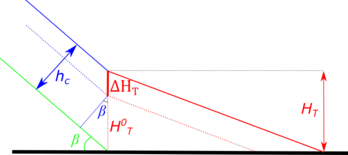
where: updated height of toe; : height of toe for the previous iteration and : increase of height fixed by designer (Figure 14). For the first run of step 1 ; .
- Updating of training walls height:
where : toe height; : training walls height and : dam slope angle. The geometrical relation between parameters is shown in Figure 14.
|
| Figure 14. Scheme of relation between parameters : height of toe for the previous iteration; : increase of height fixed by designer; : training walls height and : dam slope angle |
- Definition of geometry solution according to the height and slope of toe and the dam geometry defined by the designer.
STEP 2 – Infiltration flow estimation
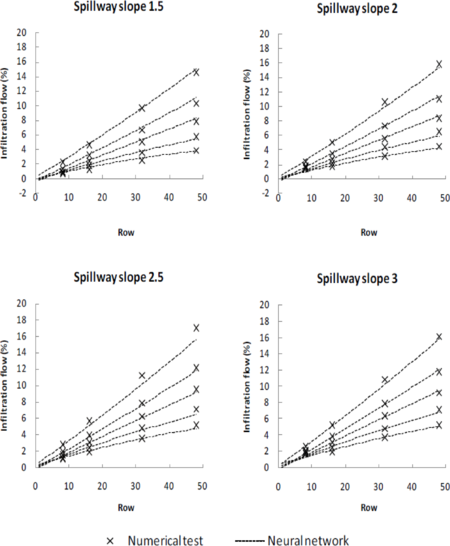
- Calculation of infiltration flow according to the designed solution. The infiltration flow depends on a) the length of the lined zone with blocks, b) the slope, and c) the block size. This calculation is based on the results of the numerical infiltration tests showed in section 2.4. They were used to train a neural network that allows computing an estimate of the infiltration flow for any combination of slope and discharge within the considered ranges of variation. This approach is beneficial because it avoids the need to fit a separate expression for each combination of slope and discharge, and provides an estimate for intermediate values. In addition, since the input data have low noise, the training procedure is straightforward. The maximum discrepancy between the numerical results and the estimates of the neural network was 1.26% (Figure 15). This approach is homologous to that followed in a previous work to obtain a general expression to compute the discharge flow in gated spillways on the basis of a numerical modelling campaign [19]. In this case, the library “nnet” [20] was used for the training process.
|
| Figure 15. Comparison of infiltration flows obtained from numerical tests and neural network |
STEP 3 – Simulation of seepage into toe and under flip bucket
- Simulation of seepage into toe and under flip bucket considering non-linear resistance laws [21] and checking of saturation rate:
- If the following expression is true then go back to step 1 and increase toe height.
where : maximum saturation rate input; : height of toe and : maximum seepage level under the flip bucket structure.
- If the following expression is true then go to step 4
STEP 4 – Seepage simulation
- Simulation of seepage into dam body considering non-linear resistance laws [21] and checking of saturation rate, (only for rockfill dam).
- If the following expression is true then go back to step 1 and increase toe height.
where : maximum saturation rate input; : height of toe and : maximum seepage level into the dam.
- If the following expression is true then go to step 5
- Simulation of seepage into drainage layer considering non-linear resistance laws [21] and checking of saturation rate and stability against mass sliding, (only for homogenous dam).
- If the following expression is true then increase thickness of drainage until unfulfilling the expression
where : maximum saturation rate input and : saturated percentage of the drainage layer.
- If the following expression [22] is true then increase thickness of drainage until reaching safety factor value.
where : safety factor against mass sliding of drainage layer; : saturated specific weight of the material; : dam slope angle; : specific weight of water; : friction angle; : dry specific weight of the material; : maximum saturation rate input; : seepage level into drainage layer; : thickness of drainage layer; \lambda: homothetic factor; : mass of block selected for design; : gravity acceleration; : lengthwise of block tested to obtain infiltration data and : cross length of block tested to obtain infiltration data
- If the following expression is true then go back to step 1 and increase toe height.
where : thickness of drainage layer; : dam slope angle and : toe height.
- If the following expression is true then go to step 5
STEP 5 – Calculation of rip-rap
- Calculation of diameter of rip-rap as optional superficial erosion protection for toe. This algorithm uses Knauss expression [23] with safety factor 2 to obtain the diameter of stone.
where: : seepage flow; : toe slope; : gravity acceleration and : rip-rap average diameter.
Another expression among those developed in the technical literature could be used by the designer to obtain the diameter of stone.
STEP 6 – Calculation of volumes and budget
- Calculation of volumes of materials and final budget.
3.3 Implementation
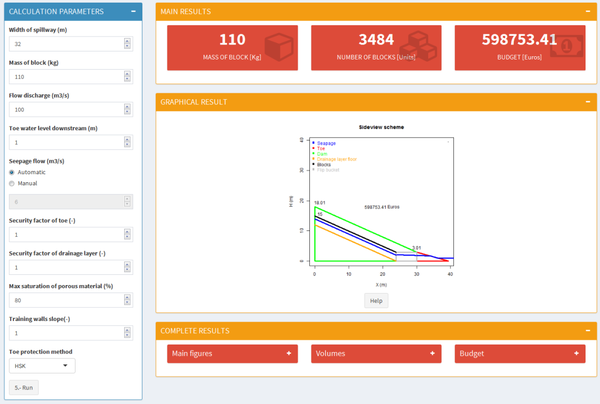
In order to achieve the automation of the previously exposed algorithm an interactive tool was created in Shiny by Rstudio [24-26]. This tool is able to find a design solution, carrying out the process of the algorithm in a few seconds. The software needs several input parameters and gives back the needed output parameters (Table 1) to the complete design of the WSB spillway.
| INPUT | OUTPUT |
| Type of dam | Toe slope |
| Downstream slope of dam | Toe height |
| Seepage properties of materials | Saturation rate under flip bucket |
| Discharge flow | Number of blocks |
| Toe water level at downstream | Height of training walls |
| Mass of block | Volumes of materials and budget |
| Width of spillway | Thickness of drainage layer (only for homogeneous dam) |
| Slope of training walls | Saturation of drainage layer (only for homogeneous dam) |
| Maximum saturation rate of porous materials | Rip-rap diameter (optional) |
| Safety factor of toe against mass sliding | |
| Safety factor of drainage layer against mass sliding (only for homogeneous dam) | |
| Cost of materials | |
| Valley shape |
The tool allows handling these input and output parameters in a friendly way, due to an interactive interface, shown in Figure 16.
|
| Figure 16. Interactive interface of the tool to handle input and output parameters |
It should be noted that there is an option in the tool to carry out an economical optimization of a WSB spillway, regarding the provider’s range of blocks and several widths of discharge channel.
4. Summary and conclusions
A design procedure for WSB spillways based on numerical modeling of infiltration was presented. This procedure defines the appropriate geometry of the spillway to ensure the stability of the dam against sliding with a sloping toe protection, and to ensure the stability of blocks avoiding water pressure under it.
The design procedure is based on an iterative algorithm coded in R and implemented in an interactive tool based on Shiny.
This tool allows finding the design solution in a few seconds, finding an optimal economic solution from a range of blocks, and this is an important step forward to simplify and popularize the design of WSB spillways.
An accurate knowledge of infiltration flow has been found as the key issue to design WSB spillways, so future research will focus on expanding the ranges of variables studied until now, focused on expand results of slope and flow ranges.
Acknowledgments
The research was supported by the DIABLO project of the National R+D Plan of the Spanish Ministry of Economy and Competitiveness (RTC-2014-2081-5).
References
[1] Pravdivets Y.P., Slissky S.M. Passing floodwaters over embankment dams. Water Power & Dam Construction, 33(7):30-32, 1981.
[2] Hewlett H., Baker R., May R., Pravdivets Y.P. Design of stepped-block spillways. Construction Industry Research and Information Association, London, U.K, 1997.
[3] Frizell K.H. Protecting embankment dams with concrete stepped overlays. Hydro Review, 16(5), 1997.
[4] Relvas A.T., Pinheiro A.N. Inception point and air concentration in flows on stepped chutes lined with wedge-shaped concrete blocks. Journal of Hydraulic Engineering, 134(8):1042-1051, 2008.
[5] Caballero J., Salazar F., San Mauro J., Toledo M.A. Physical and Numerical modeling for understanding the hydraulic behaviour of Wedge-Shaped-Blocks spillways. I International Seminar on Dam Protection Against Overtopping, Madrid, 24-25 November 2014.
[6] Morán R. Wedge-shaped blocks: a historical review. II International Seminar on Dam Protection Against Overtopping, Ft. Collins, Colorado, USA, 7-9 September 2016.
[7] Caballero F.J., Toledo M.Á., Morán R., San Mauro J., Salazar F. Advances in the understanding of the hydraulic behavior of wedge-shape block spillways. II International Seminar on Dam Protection Against Overtopping, Ft. Collins, Colorado, USA, 7-9 September 2016.
[8] Dadvand P., Rossi R., Oñate E. An object-oriented environment for developing finite element codes for multi-disciplinary applications. Archives of Computational Methods in Engineering, 17(3):253–297, 2010.
[9] Rossi R., Larese A., Dadvand P., Oñate E. An efficient edge-based level set finite element method for free surface flow problems. International Journal for Numerical Methods in Fluids, 71(6):687-716, 2013.
[10] Codina R. Stabilization of incompressibility and convection through orthogonal sub-scales in finite element method. Computer Methods in Applied Mechanics and Engineering, 190:1579–1599, 2000.
[11] Principe J., Codina R., Henke F. The dissipative structure of variational multiscale methods for incompressible flows. Computer Methods in Applied Mechanics and Engineering, 199(13):791-801, 2010.
[12] Larese A., Rossi R., Oñate E. Finite element modeling of free surface flow in variable porosity media. Archives of Computational Methods in Engineering, 22(4): 637-653, 2015.
[13] Larese A., Rossi R., Oñate E., Toledo M.A., Morán R., Campos H. Numerical and experimental study of overtopping and failure of rockfill dams. International Journal of Geomechanics, 15(4):04014060, 2013.
[14] San Mauro J., Salazar F., Toledo M.A., Caballero F.J., Ponce-Farfan C., Ramos T. Physical and numerical modeling of labyrinth weirs with polyhedral bottom. Ingeniería del Agua, 20(3):127-138, 2016.
[15] Salazar F., San Mauro J., Oñate E., Toledo M.Á. CFD analysis of flow pattern in labyrinth weirs. I International Seminar on Dam Protection Against Overtopping, Madrid, 24-25 November 2014.
[16] ES 2595852 B2. Ministerio de Industria Energía y Turismo. Oficina Española de Patentes y Marcas. Tomo II: Invenciones, Boletín Oficial de la Propiedad Industrial, no. 4915, 8 de Mayo de 2017.
[17] Morán R., Toledo M.A. Design and construction of the Barriga Dam spillway through an improved wedge-shaped block technology. Canadian Journal of Civil Engineering, 41(10):924-927, 2014.
[18] Toledo M.A. Embankment dams slip failure due to overtopping. XIX International Congress on Large Dams, ICOLD, Florence, Italy 1997.
[19] Salazar F., Morán R., Rossi R., Oñate E. Analysis of the discharge capacity of radial-gated spillways using CFD and ANN–Oliana Dam case study. Journal of Hydraulic Research, 51(3):244–252, 2013.
[20] Venables W.N., Ripley B.D. Modern Applied Statistics with S. Fourth Edition, Springer, New York, 2002. ISBN 978-0-387-95457-8.
[21] Ergun S., Orning A.A. Fluid flow through randomly packed columns and fluidized beds. Industrial & Engineering Chemistry, 41(6):1179-1184, 1949.
[22] San Mauro J., Larese A., Salazar F., Irazábal J., Morán R., Toledo M.A. Hydraulic and stability analysis of the supporting layer of wedge-shaped blocks. II International Seminar on Dam Protection Against Overtopping, Ft. Collins, Colorado, USA, 7-9 September 2016.
[23] Knauss J. Computation of maximum discharge at overflow rockfiil dams, a comparison of different model test results. ICOLD congress New Delhi, 1979.
[24] RStudioTeam. RStudio: Integrated Development Environment for R. RStudio, Inc., Boston, MA. <URL: http://www.rstudio.com/>.
[25] R Core Team. R: A Language and Environment for Statistical Computing. R Foundation for Statistical Computing, Vienna, Austria. <URL: https://www.R-project.org/>.
[26] Chang W., Cheng J., Allaire J., Xie Y., McPherson J. Shiny: Web Application Framework for R. R package version 1.0.5, <URL: https://CRAN.R-project.org/package=shiny>.
Document information
Published on 08/02/19
Accepted on 05/11/18
Submitted on 03/06/18
Volume 35, Issue 1, 2019
DOI: 10.23967/j.rimni.2018.11.001
Licence: CC BY-NC-SA license
Share this document
Keywords
claim authorship
Are you one of the authors of this document?

