Abstract
In the operation of ships, assessing seakeeping performance is crucial. Historically, this has been done through experimentation in towing tank basins or numerical computations. However, with the rise of Artificial Intelligence (AI) and increased computational resources, there are many opportunities to use AI in predicting seakeeping performance. This research will utilize a pre-trained Artificial Neural Network (ANN) to evaluate the behaviour of fishing vessels in various operational scenarios. One of the key advantages of using these algorithms is the ability to predict a large number of scenarios quickly, compared to traditional methods. By analysing millions of variations in the principal dimensions of a fishing ship and different sea states, the study aims to identify the optimal seakeeping performance in challenging conditions, ultimately improving ship safety by examining principal form coefficients and dimensions. The research will also determine significant conclusions.
Keywords: Fishing ships optimization, artificial intelligence, artificial neural network, seakeeping optimization
1. Introduction
Dead ship condition (DSC) is known as the condition of a ship when subject to the waves without neither propulsive nor steering capabilities. This condition is one of the most dangerous ones in terms of safety at sea, and the danger increase as the seastate becomes more energetic. Based on the Spanish Comission for Maritime Accidents (Comisión de Accidentes e Incidentes Marítimos del Gobierno Español, CIAIM), the number of maritime accidents between 2010 and 2019 has increased [1], and a large percentage of this accidents happened in DSC. And most of the accidents under DSC had severe consequences (Table 1).
| Year | N* | DS* | VS* | S* | M* | I* |
|---|---|---|---|---|---|---|
| 2010 | 91 | 2 | - | - | - | - |
| 2011 | 101 | 3 | - | - | - | - |
| 2012 | 60 | 5 | 2 | 1 | 0 | 2 |
| 2013 | 123 | 7 | 1 | 1 | 3 | 2 |
| 2014 | 97 | 16 | 4 | 3 | 4 | 5 |
| 2015 | 204 | 87 | 1 | 50 | 4 | 32 |
| 2016 | 316 | 209 | 0 | 202 | 6 | 1 |
| 2017 | 298 | 181 | 0 | 177 | 2 | 2 |
| 2018 | 274 | 178 | 0 | 176 | 2 | 0 |
| 2019 | 283 | 208 | 1 | 196 | 6 | 5 |
| (*) N = Number of accidents; DS= Dead Ship; VS= Very severe; S= Severe; M= Moderate; I= Incident. | ||||||
Early 2020, after a long and demanding process, the second generation of intact ship stability criteria (SGISc) of the International Maritime Organization (OMI) were ultimate. [2]. And within the framework of the SGISc measure that provide orientation and limitations during navigation have been implemented to contribute to the design of safer ships [3]. A number of works regarding the implementation of the SGISc can be found in the literature. Among them we find Mata-Álvarez-Santullanol and Pérez-Rojas [4], where a set of 10 small fishing ships are analysed in terms of stability under DSC. In this work it is concluded that the SGISc provides orientation towards selecting among different options during the ship design stage. In Choi et al. [5] the probability of capsizing in DSC under the action of waves and wind is analysed. This analysis is also combined with a first order method to evaluate the fidelity when defining the potential scenarios leading to capsizing. Kubo et al. [6] developed a numerical model with coupled sway, heave, roll and pitch motions and validated it against model testing under artificial conditions of irregular waves and unsteady wind.
Gu et al. [7] remark that within the SGISc the IMO has included some method for directly evaluating the stability under DSC. The authors presented model testing and computational results to validate the latest concluding that more accurate numerical models need to be developed to evaluate stability in DSC, including the effects of drift and sway on roll motion. Shin and Chung [8] recently analysed thousands of tanker ships to transport oil derived chemical products under the SGISc concluding that the SGISc can provide clues to predict in advance the stability in DSC in the event of a ship engine failure. And Hu et al. [9] analysed the seakeeping response of a damaged ship (DTMB 5415) under beam waves in DSC using the method of volume of fluids. It was found that the roll motion amplitude of the damaged ship is smaller than that of the intact ship. Given the coupling motion of the wave excitation and the heeling moment produced by flooding water, various differences are observed in the value of the roll amplitude, and the flooding water effect turns into the damping of ship rolling.
The irruption of Artificial Intelligence in the last years is opening up new possibilities to cope with the seakeeping problem. Several works can be already found in the literature using machine learning techniques to predict the seakeeping performance of ships. Liu et al. [10] developed a Reservoir Computing capable of predicting the movements of the six degrees of freedom for the KVLCC2 ship under irregular seawaves. Taghva et al. [11] predicted heave roll and pitch response amplitude operators (RAOs) and added resistance in waves obtained by the strip theory for the S175 hull using artificial neural networks (ANNs). In [12,13] Cepowski continued that line of research applied to ferries and passenger ships. And in [14] Cepowski trained ANNs to predict the added resistance in waves using basic ship form factors. The ship database contained 14 different ships.
The operational requirements of ships have been traditionally assessed either by seakeeping computational models or by experimental tests. Both methods are time consuming and require the exact geometry and mass particulars of the ship, so they are not applicable in early design stages where only few form coefficients are known.
One of the most recent works in this line of research has been published by the authors of the present work [15]. In [15], Romero-Tello et al. trained ANNs to predict the seakeeping hydrodynamic loads. A large number of different ships were used for an extensive training, resulting on a dataset of more than 20.000 ships under different wave frequencies and directions. As a result, obtained an ANN capable of predicting the seakeeping hydrodynamic loads for any type of conventional displacement monohull ship.
2. Objectives
It would be desirable to be able to assess the safety of ships in the early design stages to analyse, for instance, DSCs, and try to minimize the effects on the crew, passage, and avoid capsizing. And the main objective of this work is to provide an answer based on AI techniques.
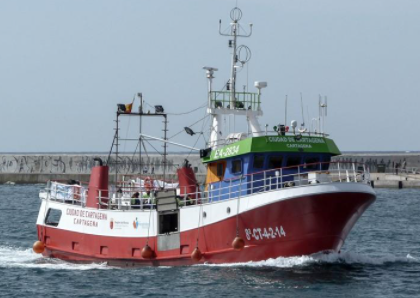
It this work, the operational parameters of an existing fishing ship (Ciudad de Cartagena, see Figure 1 and Figure 2) will be optimized using the DSC under different seastates. The ANNs developed in [15] will be used to predict the seakeeping loads based on the form coefficients of the new hulls obtained by parametric transformation of the original ship. Since the ANNs can predict thousand of ships per second, the optimization process can be carried out through an extensive analysis of the parametric space.
The objective is to find the ship with the best response to the DSC subject to predefined wave scenarios. This search will be carried out across millions of parametric transformations of the original ship. And the selection of the best ship will be based on the following key performance indicators (KPI): motion sickness incidence (MSI); vertical and horizontal root mean square (RMS) accelerations; and maximum roll and pitch angles (MRA and MPA).
This work is organized as follows: the case study is presented in section 3. Section 4 introduces the optimization methodology. Section 5 shows the results obtained from the optimization, as well as the ship selected as the best. Section 6 provides the conclusions of this work.
3. Case study
Figure 1 shows the original ship (Ciudad de Cartagena) to be used as case study. This is a fishing ship currently used as a school ship by the Universidad Politécnica de Cartagena (UPCT). Table 2 provides the main particulars under fully loaded conditions and Figure 2 provides the body plan.
|
| Figure 1. Ciudad de Cartagena general view |
| Overall length (m) | 24.000 |
| Waterline length (m) | 21.650 |
| Breadth (m) | 6.661 |
| Draft (m) | 2.980 |
| Block coefficient CB | 0.472 |
| Waterlines area coefficient CF | 0.852 |
| Midship area coefficient CM | 0.750 |
| Prismatic coefficient CP | 0.630 |
| Longitudinal position buoyancy centre XB (m) | 10.975 |
| Vertical position buoyancy centre KB (m) | 1.969 |

|
| Figure 2. Ciudad de Cartagena body plan |
During its operational life as a fishing ship, the fishing campaigns took place in the areas of the Mediterranean Sea and South Atlantic. And for this analysis, a period of one operational year will be used to determine the wave conditions in the areas. Table 3 shows the significant wave height (), peak period () and wave spectrum () selected based on [16].
| Zona | (m) | (s) | Wave spectrum |
|---|---|---|---|
| Mediterranean Sea | 2.347 | 6.0 | JONSWAP |
| South Atlantic | 3.570 | 8.8 | JONSWAP |
4. Optimization methodology
4.1. Pre-trained ANNs
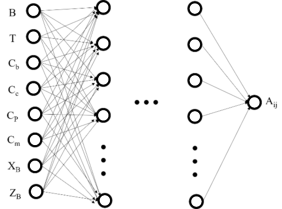
In this work, the ANN developed by Romero-Tello et al. [15] will be used to predict the seakeeping loads of convectional monohull ships. By seakeeping loads we refer to the wave radiation loads (added mass and damping), as well as the excitation loads (Froude-Krylov and diffraction wave loads), in the frequency domain. The ANN developed in Romero-Tello et al. [15] can predict these loads based only on the hull form coefficients, with no need of the exact hull geometry (Figure 3). And the average error when compared to traditional 3D frequency-domain seakeeping codes based on potential flow and the boundary element method (BEM) is below 5%. The dataset of ships used for training this ANN was composed of different hulls. This dataset was built out of 50 different conventional monohull ships (bulkcarriers, cruise ships, crude carriers, fishing ships, etc.), and then augmented by carrying out parametric transformations of L/B and B/T for each. The main advantage of using the ANN developed in Romero-Tello et al. [15] is the computational speed, which allows to compute the KPIs of two cases per second while keeping a good precision.
|
| Figure 3. ANN architecture for added mass prediction |
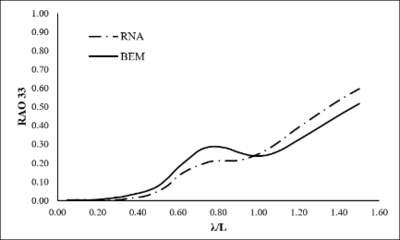
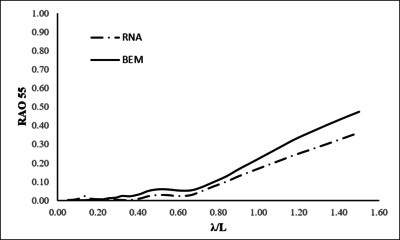
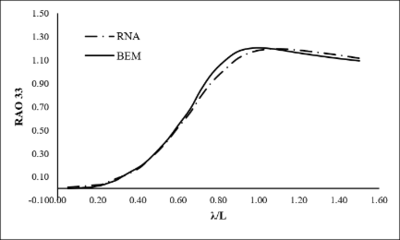
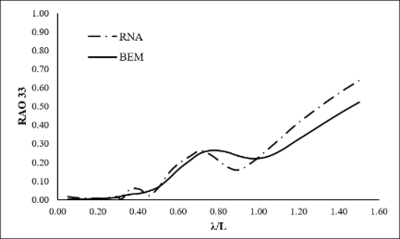
To assess the viability of the ANN, a comparison of the ANN and a BEM developed in Delhommeau [16] results for the original ship of the case study is carried out. It has to be said that the Ciudad de Cartagena was not used in the training of the ANN, so that the results are inferred from the results from other ships. Heave and pitch RAOs under head, following and beam seas are compared.
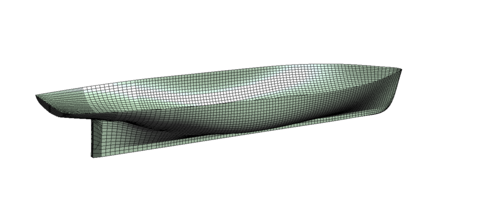
For the BEM computations, a mesh of 6400 elements has been generated for the Ciudad de Cartagena ship (Figure 4). Figures 5, 6 and 7 show a comparison between RAOs obtained by ANN and BEM computations for head waves, beam waves and following waves respectively. Heave (RAO33) and pitch (RAO55) response amplitude operator curves define the vessel response, for one particular degree of freedom, to one particular wave direction, amplitude and period.
|
| Figure 4. BEM mesh for Ciudad de Cartagena hull |
| ||
| Figure 5. RAOs comparison between ANN and BEM for head waves |
| ||
| Figure 6. RAOs comparison between ANN and BEM for beam waves |
| ||
| Figure 7. RAOs comparison between ANN and BEM for following waves |
4.2. Key performance indicators (KPIs)
Seakeeping stability criteria limit the maximum roll and pitch angles, as well as the maximum horizontal and vertical root mean square (RMS) accelerations. There exist a number of works investigating those criteria such as Rumawas et al. [17], Pattison and Sheridan [18], Ghaemi and Olszewski [19], and Stevens and Parsons [20]. They analyzed the seakeeping criteria provided by the North Atlantic Treat Organization (NATO) STANAG 4154, the NORDFORSK (Nordic Council of Ministers that provides funding for and facilitates Nordic cooperation on research and research infrastructure), and the USCG (United States Coast Guards, Cutters certification plan), which are provided in Tables 4, 5, and 6.
| Recommended criterium | Threshold | Location |
|---|---|---|
| Motion Sickness Incidence (MSI) | 20% | Any |
| Motion Induced Interruption (MII) | 1/m | Any |
| Roll | 4º | - |
| Pitch | 1.5º | - |
| Vertical acceleration (RMS) | 0.2 g | Bridge |
| Horizontal acceleration (RMS) | 0.1 g | Bridge |
| General criteria for ship operability | Merchant | Naval | Fast ship |
|---|---|---|---|
| Vertical acceleration RMS at bow | 0.275 g ( m) | 0.275 g | 0.65 g |
| 0.050 g ( m) | |||
| Vertical acceleration RMS at bridge | 0.15 g | 0.20 g | 0.275 g |
| Horizontal acceleration RMS in bridge | 0.12 g | 0.10 g | 0.10 g |
| Roll | 6.0 deg | 4.0 deg | 4.0 deg |
| Slamming probability | 0.03 ( m) | 0.03 | 0.03 |
| 0.01 ( m) | |||
| Greenwater probability | 0.05 | 0.05 | 0.05 |
| Acceleration and roll angle criteria | Vertical acceleration | Horizontal acceleration | Roll angle |
| Light manual work (RMS) | 0.20 g | 0.10 g | 6.0 deg |
| Heavy manual work (RMS) | 0.15 g | 0.07 g | 4.0 deg |
| Intellectual work (RMS) | 0.05 g | 0.05 g | 3.0 deg |
| Passengers (RMS) | 0.05 g | 0.04 g | 2.5 deg |
| Cruise line (RMS) | 0.02 g | 0.03 g | 2.0 deg |
| Criterium | Threshold | Location |
|---|---|---|
| Vertical acceleration | 0.4 g | Bow |
| Vertical acceleration | 0.2 g | Bridge |
| Horizontal acceleration | 0.2 g | Bridge |
| Motion Sickness Incidence (MSI) | 5 % under 30 min. exposition | Any |
| Motion Induced Interruption (MII) | 2.1 stops per minute | Any |
| Roll angle | 8.0 º | - |
| Pitch angle | 3.0 º | - |
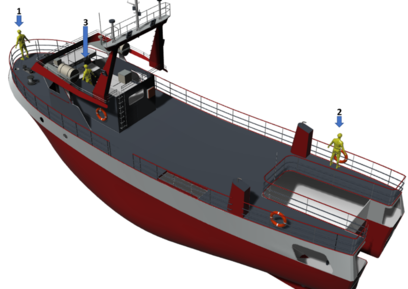
In this work for the optimization analysis considering DSC, the NORDFORSK 1987 criteria for heavy manual work (recommended for fishing ships) have been adopted because those are the most demanding. Along with the NORDFORSK criteria, we have included the STANAG maximum RMS pitch angle in order to also reduce the pitch movement. The KPIs are then computed at three different locations: point 1, bow; point 2, stern-starboard; and point 3, navigation bridge (Figure 8). Table 7 shows the dimensionless coordinates of the three locations to be analysed.
|
| Figure 8. 3D view of the locations to compute the KPIs on the Ciudad de Cartagena |
| Bow | 0.923 | 0.000 | 2.769 |
| Stern-board | 0.024 | 0.460 | 2.469 |
| Navigation bridge | 0.701 | 0.000 | 2.783 |
Next the KPI are described. The MSI KPI measures the percentage of sickness after two hours navigation. This is evaluated as:
|
|
(1) |
where:
- is the cumulative normal distribution,
- is the heave acceleration obtained from 0.784 ,
- is the i-th spectral moment,
- is the gravity acceleration,
- is a factor given by O’Hanlon and McCauley in 1974 [24] and depends on:
- ,
- .
The vertical and horizontal RMS accelerations are given by:
|
|
(2) |
|
|
(3) |
And maximum and significant roll and pitch angles are given by Eqs. (4) and (5), respectively
|
|
(4) |
|
|
(5) |
|
|
(6) |
where , , and are the zero, second, and fourth spectral moments.
4.3. Analysis
Before optimizing the operational parameters, it will be verified whether the selected criteria are fulfilled by the Ciudad de Cartagena. Then, geometrical transformation of the original hull will be performed to improve the seakeeping performance. Table 8 provide the ranges of variation of the form coefficients for the geometrical transformations (%, of initial values), where is the ship length, is the breadth, is the draft, is the displacement, is the flotation area, is the midship area, is the amidship area, and and are the horizontal and vertical position of the buoyancy centre respectively. is measured from free surface.
For each resulting combination, dimensionless form coefficients will be obtained, discarding unrealistic combinations such as those with block coefficient larger than one. These dimensionless hull form coefficients are the inputs for the ANN developed in Romero-Tello et al. [15]. Longitudinal and transversal distance from the gravity centre to the metacentric centre ( and ) are assumed to remain unchanged respect to the Ciudad de Cartagena.
| L (m) | B (m) | T (m) | Vol (m) | A (m) | A (m) | AC (m) | X (m) | Z (m) | |
|---|---|---|---|---|---|---|---|---|---|
| Initial value | 21.650 | 6.661 | 2.980 | 203.024 | 122.922 | 14.879 | 56.239 | 10.975 | -1.011 |
| Minimum value | 19.485 | 5.995 | 2.682 | 182.722 | 110.630 | 13.391 | 50.615 | 9.878 | -0.910 |
| Maximum value | 23.815 | 7.327 | 3.278 | 223.326 | 135.215 | 16.367 | 61.862 | 12.073 | -1.112 |
For each geometrical factors, equidistant values are obtained within the range of variation. And for each of them the KPI is obtained. Then the KPI evaluation process consists of the following steps:
- Step 1: Generate analysis cases within the range of parameter variations given in Table 8.
- Step 2: Obtain RAOs using the ANNs developed in Romero-Tello et al. [15].
- Step 3: Obtain spectral movements for each new ship: got the operational areas defined in Table 3, and for 7 wave directions covering from following to head waves.
- Step 4: Obtain the maximum value of each KPI evaluated at each analysis point given in Table 7, considering the two operational areas and wave directions every 30 degrees (Eqs. (7)-(11)). Where and refer to the Mediterranean Sea and the South Atlantic, respectively, and refers to each of the three analysis points on the vessel
|
|
(7) |
|
|
(8) |
|
|
(9) |
|
|
(10) |
|
|
(11) |
The optimal geometry is obtained after a ship selection process. This is as follows:
- 1. Select all ships fulfilling all stablished criteria.
- 2. In case there is none, select all ships improving the maximum value of each KPI compared to the initial vessel.
- 3. If none, select all ships improving the higher number of KPIs respect to the initial ship.
- 4. After the previous process, all selected ships will be ranked based on each KPI, from lowest to highest.
- 5. For each ship, the worst ranked position out of all KPI ranks will be taken, the candidate ships are ordered based on their position in the previously selected ranking.
- 6. Finally, the ship with the lowest rank is selected.
5. Results
First, it has been verified the fulfilment of the NORDFORSK criteria for the original ship under the wave conditions provided in Table 3. Table 9 provides the maximum values at the three analysis points of the ship. It is observed how the initial ship does not fulfil the selected requirements.
| Max. | Max. | |||
|---|---|---|---|---|
| Bow | Stern-board | Nav. bridge | ||
| MSI | 34.863 | 28.146 | 25.981 | 34.863 |
| Max. Horizontal acceleration (m/s2) | 7.419 | 5.740 | 7.243 | 7.419 |
| Max. Vertical acceleration (m/s2) | 1.433 | 1.121 | 1.134 | 1.433 |
| Max. Roll angle (º) | 54.768 | |||
| Max. Pitch angle (º) | 15.288 | |||
5.1. KPI evaluation and ship selection process
For each geometrical factors, four equidistant values are obtained within the range of variation. Then, 262,144 geometrical variations are considered. After discarding unrealistic combinations, the resulting dataset to be analysed is reduced to 190,080 combinations. Then the KPI are evaluated at the three locations, and for the seastates and wave directions defined for the operational areas. This results in 1,140,480 case scenarios simulated.
After obtaining all the KPIs for the 190,080 candidates, none of them fulfil all the four selected requirements. Then, it is found that 3,858 ships improved all maximum KPIs respect to the initial ship. Following the ranking method described for the ship selection process, it is found the best ship. Table 10 compares the geometrical particulars of the selected ship respect to the Ciudad de Cartagena. Table 11 provides the KPIs for the selected ship.
| Ciudad de Cartagena | Best ship | |
|---|---|---|
| LW (m) | 21.650 | 20.928 |
| B (m) | 6.661 | 5.995 |
| T (m) | 2.980 | 3.079 |
| Displacement (t) | 208 | 229 |
| CB | 0.472 | 0.578 |
| CF | 0.852 | 0.947 |
| CM | 0.750 | 0.725 |
| CP | 0.630 | 0.797 |
| XB / LW | 0.507 | 0.507 |
| KB / T | 0.661 | 0.639 |
| Max. | Max. | |||
|---|---|---|---|---|
| Bow | Stern-board | Nav. bridge | ||
| MSI | 29.464 | 28.987 | 22.164 | 29.464 |
| Max. Horizontal acceleration (m/s2) | 3.902 | 3.469 | 3.915 | 3.915 |
| Max. Vertical acceleration (m/s2) | 1.198 | 1.141 | 1.005 | 1.198 |
| Max. Roll angle (º) | 28.352 | |||
| Max. Pitch angle (º) | 14.901 | |||
5.2. Discussion of results
Table 12 compares the maximum KPI values for the Ciudad de Cartagena and the best selected ship. It is observed that a considerable improvement of the seakeeping performance is achieved.
| Ciudad de Cartagena | Best ship | |
|---|---|---|
| MSI | 34.863 | 29.464 |
| Max. Horizontal acceleration (m/s2) | 7.419 | 3.915 |
| Max. Vertical acceleration (m/s2) | 1.433 | 1.198 |
| Max. Roll angle (º) | 54.768 | 28.352 |
| Max. Pitch angle (º) | 15.288 | 14.901 |
The selected recommendations are appropriate to assess seakeeping performance since they stablished thresholds based on the work to be carried out on board. In the case study of this work, a fishing ship, those of heavy manual work are taken as appropriated.
6. Conclusions
A wise selection of the form coefficients in the early design stage of ships is key to ensure the seakeeping performance and safety of the ship, for instance, in dead ship conditions. In this context, the ANN developed in [15] can be used for fast evaluation of KPIs and hull form optimization, providing ship designer with a powerful tool to this end.
It has been shown how the ANN from Romero-Tello et al. [15] provides the capability of testing a very large number of hulls in a negligible time. In this work, approximately 200,000 ships have been evaluated under two operative conditions and three points of analyses ( cases) in 172 hours.
Out of the analyses carried out, it is observed that the most critical KPIs are the maximum roll angle and RMS horizontal acceleration. And the ship selected out of the optimization process improved the KPIs respect to the initial ship.
References
[1] CIAIM. Informe de 2019 de la Comisión de Investigación de Accidentes e Incidentes Marítimos. Ministerio de Transportes Movilidad y Agenda Urbana, Gobierno de España, 2019.
[2] IMO SDC 1/INF.8. Information collected by the correspondence group on intact stability regarding the second generation intact stability criteria development. Submitted by Japan, 13 November 2013.
[3] Petacco N., Gualeni P. IMO second generation intact stability criteria: General overview and focus on operational measures. Journal of Marine Science and Engineering, 8(7):494, 2020. https://doi.org/10.3390/jmse8070494
[4] Mata-Álvarez-Santullanol F., Pérez-Rojas L. Application of IMO second generation intact stability criteria for dead ship condition to small fishing vessels. Proceedings of the 12th International Conference on the Stability of Ships and Ocean Vehicles, , Glasgow, 14-19 June 2015.
[5] Choi J., Jensen J., Kristensen H., Nielsen U., Erichsen H. Intact stability analysis of dead ship conditions using FORM. J. Ship. Res., 61:167–176, 2017. https://doi.org/10.5957/JOSR.170005.
[6] Kubo T., Umeda N., Izawa S., Matsuda A. Total stability failure probability of a ship in beam wind and waves: Model experiment and numerical simulation. In: Belenky V., Spyrou K., van Walree F., Almeida Santos Neves M., Umeda N. (eds), Contemporary Ideas on Ship Stability. Fluid Mechanics and Its Applications, vol 119, pp. 591–603, Springer, Cham, 2019. https://doi.org/10.1007/978-3-030-00516-0_35
[7] Gu M., Lu J., Wang Th. Stability of a tumblehome hull under the dead ship condition. J. Hydrodyn. Ser. B., 27(3):452–457, 2015. https://doi.org/10.1016/S1001-6058(15)60503-0.
[8] Shin D.M., Chung J. Application of dead ship condition based on IMO second-generation intact stability criteria for 13K oil chemical tanker. Ocean Engineering, 238:109776, 2021. https://doi.org/10.1016/j.oceaneng.2021.109776.
[9] Hu L., Wu H., Yuan Z., Li W., Wang X. Roll motion response analysis of damaged ships in beam waves. Ocean Engineering. 227:108558, 2021. https://doi.org/10.1016/j.oceaneng.2020.108558
[10] Liu L., Yang Y., Peng T. Machine learning prediction of 6-DOF motions of KVLCC2 ship based on RC model. J. Ocean Eng. Sci., 2022 https://doi.org/10.1016/j.joes.2022.08.004.
[11] Taghva H.R., Ghassemi H., Nowruzi H. Seakeeping performance estimation of the container ship under irregular wave condition using artificial neural network. Am. J. Civil Eng. Archit., 6:147-153, 2018. https://doi.org/10.12691/ajcea-6-4-3.
[12] Cepowski T. Determination of optimum hull form for passenger car ferry with regard to its sea-keeping qualities and additional resistance in waves. Pol. Marit. Res., 15:3-11, 2008. https://doi.org/10.2478/v10012-007-0057-2.
[13] Cepowski T. On the modeling of car passenger ferry ship design parameters with respect to selected sea-keeping qualities and additional resistance in waves. Pol. Marit. Res., 16:3-10, 2009. https://doi.org/10.2478/v10012-008-0026-4.
[14] Cepowski T. The prediction of ship added resistance at the preliminary design stage by the use of an artificial neural network. Ocean Eng., 195:106657, 2020. https://doi.org/10.1016/j.oceaneng.2019.106657.
[15] Romero-Tello P., Gutiérrez-Romero J.E., Serván-Camas B. Prediction of seakeeping in the early stage of conventional monohull vessels design using artificial neural network. Journal of Ocean Engineering and Science, 8(4):344-366, 2023. https://doi.org/10.1016/j.joes.2022.06.033.
[16] Delhommeau G. Numerical simulation of hydrodynamics: Ships and offshore structures. Seakeeping codes AQUADYN and AQUAPLUS, Ecole Centrale de Nantes, 1993.
[17] Rumawas V., Asbjørnslett B.E., Klöckner C.A. Human factors evaluation in ship design: A case study on offshore supply vessels in the norwegian sea, Part 2: Multivariate analyses and structural modelling. Naval Engineers Journal, 129(1):45-52, 2017.
[18] Pattison J.H., Sheridan D.J. Human performance factors and measures in hull form selection. NATO unclassified/unlimited, RTO-MP-AVT-110, Meeting Proceedings, Paper 34, April 2004.
[19] Ghaemi M.H., Olszewski H. Total ship pperability-review, concept and criteria. Polish Maritime Research, 24(S1):74-81, 2017. https://doi.org/10.1515/pomr-2017-0024.
[20] Stevens S.C., Parsons M.G. Effects of motion at sea on crew performance: A survey. Marine Technology, 39(1):29–47, 2002.
[21] NATO. Standardization Agreement (STANAG): Common procedures for seakeeping in the ship design process. Military Agency for Standardization, 2000.
[22] Nielsen I.R. Assessment of ship performance in a seaway. NORDFORSK, Copenhage, 1987.
[23] O'Hanlon J., McCauley M. Motion sickness incidence as a function of vertical sinusoidal motion. Aerospace Medicine, 45(4):366-369, 1974.Document information
Published on 25/10/23
Accepted on 10/10/23
Submitted on 05/07/23
Volume 39, Issue 4, 2023
DOI: 10.23967/j.rimni.2023.10.004
Licence: CC BY-NC-SA license
Share this document
Keywords
claim authorship
Are you one of the authors of this document?
