1. Introduction
Resistance welding is a well-known technique that entails the use of a heating element (HE) sandwiched between the parts to weld. Electrical power, provided to the HE through electrode connection, heats up the material, following the Joule’s Law, where the energy dissipated (E) from the resistor is proportional to the resistance (R), current (I), and time (t).
Finally, the application of an external pressure ensures that the parts are in intimate contact and polymer can cross interdiffusion between the parts. For Carbon Fibre Reinforced Thermoplastic Composites (CFRTP), the HE is commonly made by sandwiching a stainless-steel metal mesh between thermoplastic polymer layers and plies of glass fiber. The latter guarantees that electrical leakage, between the heating element and the welding parts, is hindered and current can only flow through the metal mesh [1].
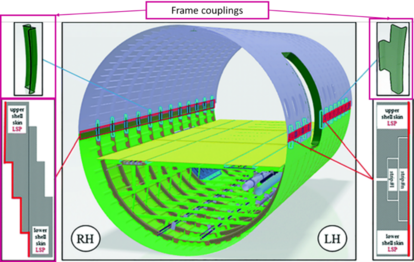
Resistance welding was the technology selected to perform the frame coupling integration on the next-generation MultiFunctional Fuselage Demonstrator (MFFD), on both shell sides. On the left and right sides, the frame couplings beneath the overlap joint need to structurally bond the upper and the lower shell frames. Figure 1 shows the general concept for the MFFD, where the position of the frame couplings can be observed.
2. Experimental procedure
2.1. Materials and methods
- Materials
Quasi-isotropic unidirectional CF/LMPAEK laminates (TORAY) having the same stacking sequence as the final frame couplings ([6/2/2/2]) were used, with 2.2 mm thickness. For the construction of the HE, the following materials were used: a metal mesh of stainless steel, with 0.065 mm of wire diameter and 0.10 mm of aperture; a GF/LMPAEK semipreg and LMPAEK polymer film with 0.06 mm thickness.
- Equipment
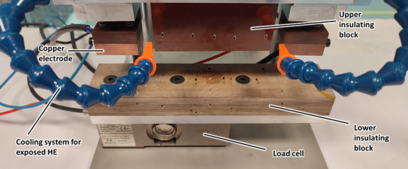
The HEs were manufactured using a hydraulic press from PRESS FONTIJNE, LabPro 1000, with 1000kN of load cell. The HEs were produced by groups, using 40 kN force and the temperature appropriate for this type of materials, and applying controlled cooling. Regarding the welding equipment, a power supply from DELTA ELEKTRONIKA was employed, reference SM1500-SM 35-45, with 0-35 voltage and 0-45 A current range. The pressure was applied using a 50 mm bore size pneumatic cylinder (SMC MGPM50-125), and the applied load was measured using a bending beam load cell (METTLER TOLEDO, TTP4 178322, 150 kg). This insulation blocks were both made of Fibraton®. At least, a cooling system based on compressed air was installed.
- Characterization
The welds were characterized trough single lap shear strength (SLSS) to analyze the mechanical welding performance. Tests were carried out according to the standard AITM 1-0019, with a final specimen dimension of 25 x 110 mm, with the slotted configuration. An universal testing machine from MTS, with a load cell of 250kN, was employed. Micrographic analysis was performed using a Metallographic Microscope REICHERT MEF 4A.
2.2. Heating element characterization
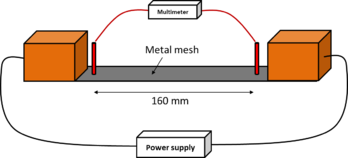
The electrical characteristic of the metal mesh and the fabricated HE was assessed using the four-probe method (Figure 2). To perform the tests, the mesh or HE was firstly placed on an insulating plate and then, two copper blocks were placed onto the mesh´s edges at a certain distance. A known current was injected, while a multimeter was at the same time adopted to measure the voltage drop of the mesh at certain distance.
The electrical resistance of the element was evaluated as R=V/I, where V is the voltage drop and I the injected current. Finally, the sheet resistivity of the mesh was calculated as:
|
|
(1) |
where w is the width of the metal mesh and l is the distance between the voltage probes of the multimeter.
The sheet resistivity of the bare metal mesh was measured along the warp and weft direction of the mesh (0° and 90° respectively) and a value of 61.87 ± 1.47 mΩ and 45.76 ± 1.31 mΩ was found for this directions. No significant differences were found between the mesh and the HE. In WELDER project, the 0° was considered the preferred direction.
2.3. Monitoring system
A sensing system was developed with the objective of monitoring the welding quality achieved. The system measures relevant parameters and process this data with Machine Learning (ML) techniques to detect anomalies during the process.
The temperature at the interface cannot be measured directly in WELDER, so this magnitude is indirectly monitored through two different parameters: the temperature at the external surface and the electric power applied to the mesh. The power supply can be controlled in a constant current mode, so only the voltage was measured, and the electric power was calculated from the measured mesh resistance (section 2.2) assuming a constant current. In addition to this, this system also measures the pressure applied.
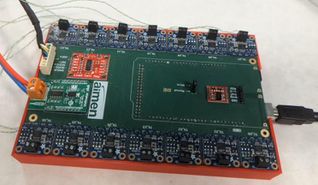
Simple commercial sensors and acquisition circuits have been used, however, a PCB board (Figure 3) has been designed to accommodate the acquisition circuit of all sensors. The designed PCB includes an Arduino Mega, based in the ATmega2560 microcontroller, to control the data acquisition process and to communicate, through its serial port, with the host computer responsible for the data logging, processing and visualization. For the host computer, a customized Graphic User Interface (GUI) was developed. This GUI receives in real time the pressure, voltage and temperatures measured by the system, presenting them in a temporal graph as well as an instantaneous value column plot. The GUI includes capabilities to connect and communicate through Industry 4.0 compliant industrial protocols (OPC-UA) this data to another server.
3. Welding optimization and scale-up
3.1. Laboratory welding optimization
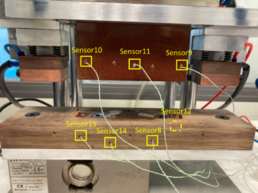
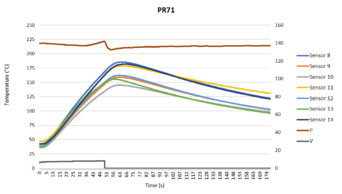
The initial stage regarding the welding process study and optimization was the laboratory research. The setup used to perform all these tests is shown in Figure 4, while in Figure 5 (left) can be seen the location of the thermocouples.
Different welding parameters were identified during a preliminary study, however, only applied pressure (P), welding time (tw) and specific power (Ws), and therefore indirectly the current intensity (I) was investigated for optimization. Other parameters, such as air cooling, clamping distance and area were maintained constant throughout the experimental campaign. Finally, the current is turned off at the end of the process while pressure remains during cooling. For each test, temperature, voltage and pressure were monitored, which are shown as an example in Figure 5 (right).
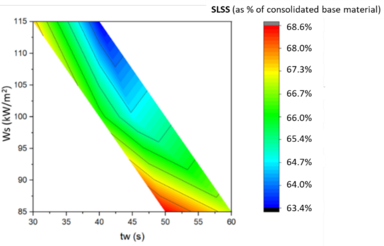
Preliminary tests were carried out to define the main range for variables and limit the investigation to a smaller window for optimization. Based on the preliminary results, three main specific power were selected, and different welding times were investigated. Welding experiments were run withing the defined processing window and mechanical tests were performed to estimate the shear strength. For the optimization, samples were welded at the specific power of 115, 100, and 85 kW/m2 and welding time ranging from 30 to 60s.
The mechanical results were represented with the help of the ORIGIN software, resulting in a 2D surface shown in Figure 6. As can be seen, samples welded with a specific power of 85 kW/m2 and for 50s show the highest mechanical performance of around 68.6% of consolidated base material.
As expected from the mechanical performance results, failure surfaces of welded samples show small or no differences between the different configurations. Samples welded using the highest power (115 kW/m2) break mainly with a cohesive type of fracture where the rupture plane is located between the metal mesh and the glass fibre layer thus indicating that this zone is the weakest. For the higher time (40s) the presence of a light-fiber-tear failure can be observed. A similar characteristic can be found in specimens welded with 100 kW/m2 and 40 or 45s. Finally, samples welded at 85 kW/m2 and 50s show, additionally to cohesive, a heavier fiber-tear failure with internal plies of the composite being involved in the fracture. The latest result agrees with the higher mechanical performance detected for such samples.
3.2. Scale-up to MFFD
Once the process was optimized at laboratory scale, the study is transferred to the welding end-effector to be used in the MFFD.
- Resistance welding head and interface
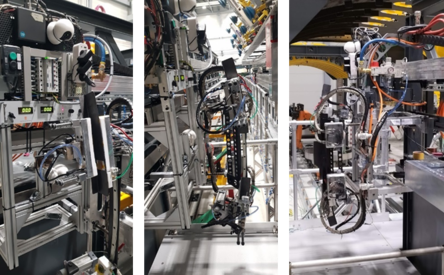
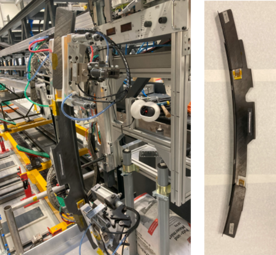
The welding head (Figure 7), developed by AITIIP, combine two welding units, necessary to perform the joint of the frame couplings, that have two welding areas. The components of this new machine are the same of the welding equipment using during the laboratory optimization but with some differences. In the case of the electrical contact areas, the copper blocks are placed one on each side of the consolidation blocks, because of the welding strategy necessary for the frame couplings, instead of the traditional configuration (on the same side). The other difference was the material of the consolidation blocks, in this case, Teflon® (instead of Fibraton®).
The head was integrated in the structure designed for the assembly of the MFFD, which allows its movement on the x- and y-axis. An interface was developed to be able to control and operate the head in various modes: manual, semi-automatic and automatic mode. Regarding the monitoring of the process, the temperature in the external surface is measured through 20 thermocouples (10 on each welding unit) embedded at 1 mm deep into the Teflon®.
- Frame couplings manufacturing
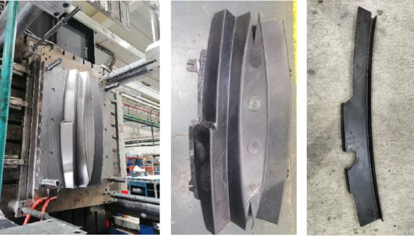
The frame couplings have been manufactured by press forming of TORAY laminates. The stamping process was performed at optimum found conditions. Two to three different parts are obtained from each of these stampings through trimming. Figure 8 shows a representative picture of each step.
- Welding trials with the final head
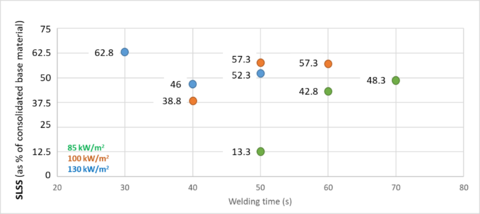
After making all necessary verifications of the RW head to prove its correct operation, some welding trials were performed, to analyze the best welding conditions with bigger geometries. Afterward some preliminary trials, different welding conditions were considered to optimize the process. The starting point was the parameters found as optimum in the laboratory trials (85 kW/m2 and 50s). The maximum specific power considered was the one used in the first trials using the end-effector, 130 kW/m2. As in-middle value, 100 kW/m2 was used. Different welding times (from 30 to 70s) were selected during the trials as a function of the obtained results.
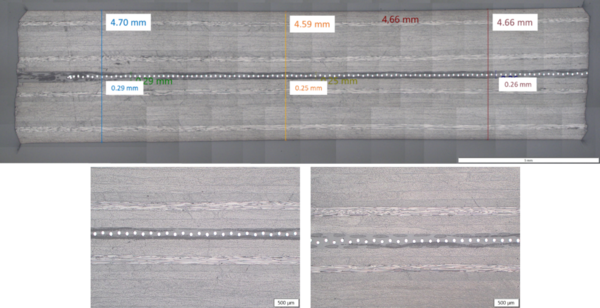
Figure 9 shows the aspect of one of the samples studied. As can be seen, the thickness of the welded specimen suffers changes along the width, being greater in the areas where the metal mesh is not present. Even so, the welds present good quality and low porosity (no detectable with optical microscopy).
In order to define the optimum welding window working with the RW end-effector, SLSS test had been carried out. The optimum parameters conditions found in the laboratory trials, 85 kW/m2 and 50s, do not provide good results in these new tests, as specimens of much larger dimensions were used. The change in the dimensions of the plates causes differences in heat dissipation, making the welding conditions not extrapolable. As can been observed, in general, the higher specific power values provide higher shear strength results. The maximum strength was obtained with 130 kW/m2 of specific power and 30s of welding time, values that provide the 62.8% of shear strength of consolidated base material. These results can be clearer observed in Figure 10.
- Welding of frame couplings
Once the welding process in flat panels was optimized, first trials using real frame couplings were performed. The optimum parameters found were selected for this welds (130 kW/m2 and 30s). This work is still in progress, so issues such as the correct positioning and alignment of the frame couplings, will be addressed in the future.
4. Conclusions
In this study, in the frame of WELDER project, the resistance welding of LMPAEK/CF materials has been addressed, both at laboratory scale and in its scaling up at the MFFD facilities. A monitoring system was developed and employed in all the trials performed in the two scenarios, registering information about voltage, pressure and temperature in different points of the specimen’s surface.
Heating elements based on stainless-steel metal mesh were manufactured and electrically characterized, obtaining a sheet resistivity of 60 mΩ in the selected mesh orientation.
Regarding the laboratory stage, the best welding parameters (85 kW/m2 and 50s) were found using small flat specimens, providing a SLSS of 68.6% of consolidated base material. During the scaling up using the resistance welding end-effector developed, the use of bigger composite plates (with similar dimensions of the final frame couplings) demonstrates that the welding conditions cannot be extrapolated. In this stage, the optimum conditions for the frame coupling welding were selected: 130 kW/m2 and 30s of welding time, obtaining a SLSS of 62.8% of shear strength of consolidated base material.
At least, frame coupling manufacturing was addressed. Some welding trials were performed, but this work is still on going.
Acknowledgments
This study is part of Clean Sky 2 programme through WELDER project “Equipment for optimised, fast and accurate LongituDinal barrEl joint closuRe” (H2020-CS2-CFP11-2020-01, JTI-CS2-2020-CfP11-LPA-02-34).
References
| [1] | D. Stavrov, H.E.N. Bersee, “Resistance welding of thermoplastic composites-an overview”, Composites Part A: Applied Science and Manufacturing, Volume 36, Issue 1, 2005, Pages 39-54, ISSN 1359-835X, https://doi.org/10.1016/j.compositesa.2004.06.030. |
| [2] | Kothe, S., Diehl, B., Niermann, D., Chen, L., Wolf, M., Hintze, W. (2021). Automated Assembly of Thermoplastic Fuselage Structures for Future Aircrafts. In: Behrens, BA., Brosius, A., Hintze, W., Ihlenfeldt, S., Wulfsberg, J.P. (eds) Production at the leading edge of technology. WGP 2020. Lecture Notes in Production Engineering. Springer, Berlin, Heidelberg. https://doi.org/10.1007/978-3-662-62138-7_47 |
Document information
Published on 30/04/25
Accepted on 17/10/23
Submitted on 21/05/23
Volume 08 - COMUNICACIONES MATCOMP21 (2022) Y MATCOMP23 (2023), Issue Núm. 3 - Caracterización - Daño, Fractura y Fatiga, 2025
Licence: Other
Share this document
Keywords
claim authorship
Are you one of the authors of this document?
