Abstract
In Japan, tile exfoliation from external walls is a serious problem that must be prevented.
In our previous study, a tiled concrete sample was dried at a temperature of 105 °C for pre-conditioning. Then, tile exfoliation occurred. Since this seemed to indicate a relationship between tile exfoliation and moisture content, it was further pursued in this study.
First, drying experiments on concrete samples just after tiling were carried out under different ambient air temperatures. The following results were obtained.
• Tile exfoliation occurs even at the lower drying temperatures. • Tile exfoliation starts at corner tiles (seen in all experiments). • When the average moisture content of the tiled concrete sample becomes lower than a certain value, tile exfoliation occurs.
Next, the experiments were analyzed using a three-dimensional model of simultaneous heat and moisture transport. The calculated moisture content agreed well with the measured results. By comparing the measurement and simulation results, it is considered that the tiles are exfoliated when the moisture content of the mortar on the back side of the tile becomes lower than a certain value.
Therefore, the moisture content can serve as an index for evaluating the occurrence of the tile exfoliation.
Keywords
External concrete wall ; Tile exfoliation ; Drying ; Moisture content ; Heat and moisture transport
1. Introduction
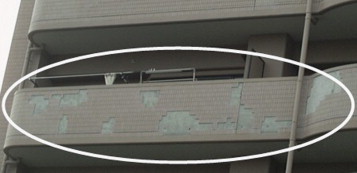
Tile exfoliation from external walls gives significant influence on the rain penetration and the durability of the external wall of the building. Sometimes, falling tiles cause serious accidents threatening human lives, even in the case of a low-rise building, and becomes a social problem than before in Japan (Figure 1 ).
|
|
|
Figure 1. Tile exfoliation from the veranda of an apartment building. |
Although various measures have been taken to prevent tile exfoliation, this problem has not yet been solved likely because the real reasons for tile exfoliation have not yet been clarified. The following items are regarded as the causes of tile exfoliation:
- expansion and shrinkage caused by the temperature and humidity changes,
- freezing and thawing, and
- ultraviolet radiation.
In real-world situations, tile exfoliation seems to be caused by a complicated interaction among (and combination of) these factors.
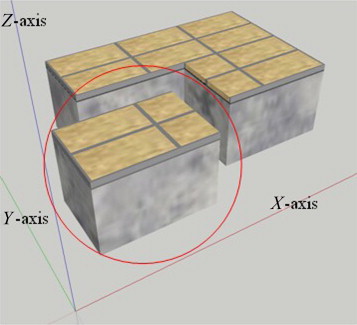
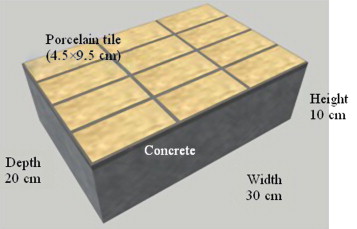
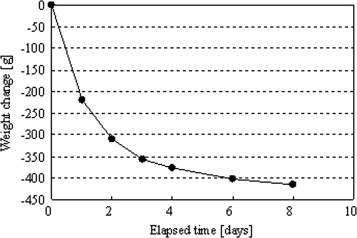
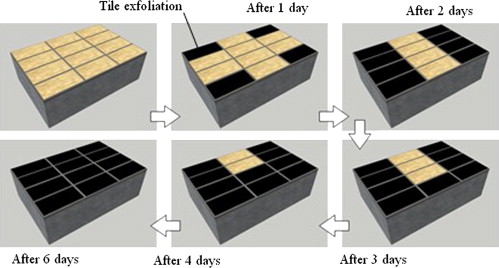
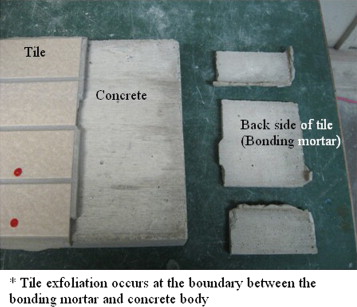
In our previous research (Onmura et al., 2009 ), the measurement of the hygrothermal properties of the concrete and water absorption experiments using a small-scale concrete wall with tile finishing, were carried out to evaluate the water penetration behavior in a tiled concrete wall. Along with these experiments, a drying experiment at 105 °C using a tiled concrete sample (Figure 2 ) was carried out to examine the influence of the heating. Figure 3 ; Figure 4 show the weight change of the sample and the propagation of the tile exfoliation, respectively. Exfoliation occurred starting from the tile at the sample corner, 1 day after drying started. Finally, all of the tiles were exfoliated after 6 days. Tile exfoliation occurred at the boundary between the tile and the concrete body, as shown in Figure 5 .
|
|
|
Figure 2. Tiled concrete sample. |
|
|
|
Figure 3. Weight change of sample (drying temperature is 105 °C). |
|
|
|
Figure 4. Propagation of tile exfoliation with time (drying temperature is 105 °C). |
|
|
|
Figure 5. Tile exfoliation of concrete sample. |
From these results, a hypothesis (that tile exfoliation occurs when the moisture content of the mortar on the back side of the tile drops to a certain value because of drying) was proposed, although, it might have occurred because of temperature expansion. Under this hypothesis, the relationship between the change of moisture content due to drying and tile exfoliation was examined in this research. First, drying experiments at 60, 75, and 90 °C were carried out to determine whether tile exfoliation occurs at temperatures lower than 105 °C. Next, a three-dimensional analysis of simultaneous heat and moisture transport was carried out to estimate the moisture content distribution inside the sample and its time profile under the different conditions of the drying experiments.
2. Drying experiments
2.1. Outline of experiment
Drying experiments were carried out using three tiled concrete samples, as shown in Figure 2 . Table 1 ; Table 2 show the materials and the mixture proportions used to make the concrete samples. The results of concrete testing (fresh properties, compressive strength and Youngs modulus) are shown in Table 3 .
| Cement | Normal (not high-early-strength) Portland cement (specific gravity is 3.16) |
| Fine aggregate | Mountain sand and crushed sand (mixing ratio is 7:3; specific gravity is 2.57) |
| Coarse aggregate | Crushed stone (specific gravity under surface-dried conditions is 2.67; largest dimension is 2.0 cm) |
| Admixture | High-range air entraining and water reducing agent |
| Weight per unit volume [kg/m3 ] | ||||
|---|---|---|---|---|
| Cement | Water | Fine aggregate | Coarse aggregate | Admixture [%] |
| 333 | 180 | 846 | 909 | 0.7 |
The weight of the admixture is expressed as a ratio of the cement weight. The water–cement ratio is 0.54.
| Slump [cm] | 19.5 |
| Slump flow [cm] | 32.0×30.0 |
| Air content [%] | 6.0 |
| Temperature [°C] | 21 |
| Compressive strength (age is 4 weeks) [N/mm2 ] | 27.9 |
| Youngs modulus [N/mm2 ] | 2.64×10⁴ |
The adopted tiling method is the standard method used in the construction of Japanese apartment building. Tiles were porcelain, with a size of 4.5 cm by 9.5 cm and a joint width of 0.5 cm. The tiling process was carried out in the same manner as used at a real construction site. Commercial products compounded beforehand were used as the bonding and joint mortars. Figure 6 shows the tiling method. As described above, the tiled concrete sample was made following the general specifications.
|
|
|
Figure 6. Tiling method [unit of mm]. |
The weight changes of the tiled concrete samples were measured during the different drying conditions 60, 75, and 90 °C. At the same time, the occurrence of tile exfoliation was checked by a percussion method.
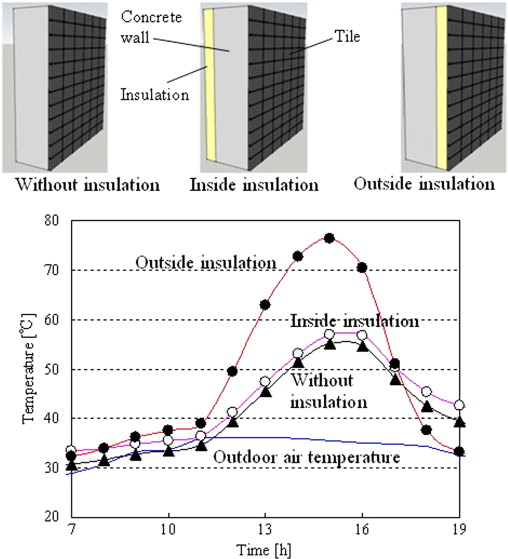
The drying temperatures were determined based on results from a simple numerical simulation. Figure 7 shows the surface temperatures of an external wall under a meteorological data taken for Osaka, Japan in 2007, calculated by one dimension thermal calculation. The wall temperature may rise above 75 °C depending on the condition (see Table 4 ). Based on this result, the drying temperatures were set at 60, 75, and 90 °C.
|
|
|
Figure 7. Calculated surface temperatures of external tiled concrete wall. |
| Outdoor air temperature | Data observed by the Meteorological Agency (on August 17, 2007, Osaka, Japan: the highest temperature was 36.2 °C) |
| Orientation of wall | West-facing |
| Solar absorptivity of wall surface | 0.9 (dark gray tile) |
| Outside overall heat transfer coefficient | 12.5 [W/m2 K] (air velocity of 1.0 m/s) |
| Thickness and thermal conductivity of concrete wall | 0.15 [m], 1.6 [W/m K] |
| Thickness and thermal conductivity of tile | 0.01 [m], 1.6 [W/m K] |
| Thickness and thermal conductivity of insulation | 0.025 [m], 0.026 [W/m K] |
| Inside air temperature | 28 °C (constant) |
| Inside overall heat transfer coefficient | 9.1 [W/m2 K] (air velocity of 0.3 m/s) |
2.2. Results of experiments
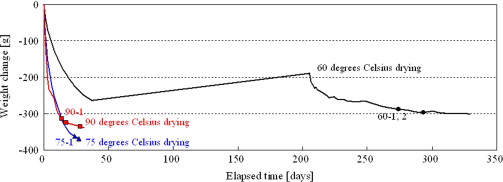
Figure 8 shows the weight change of the samples. In the 60 °C drying experiment, the sample weight increased during a certain period when a dryer could not be used by circumstances. This weight increase was caused by moisture absorption that began when the sample was placed in the atmosphere. The symbols (circle, triangle and square) in Figure 8 indicate the time (and weight) of a tile exfoliation occurrence.
|
|
|
Figure 8. Weight change of tiled concrete samples during drying experiments. |
It is evident that tile exfoliation occurs even at relatively low drying temperature. In the 60 °C drying experiment, the weight loss at which the first tile exfoliated was -288.1 g. The weight losses were −362.5 and −314.8 g in the 75 and 90 °C drying experiments, respectively. Thus, it can be said that the weight loss at the point of initial exfoliation is within a relatively narrow range, from −288 to −363 g.
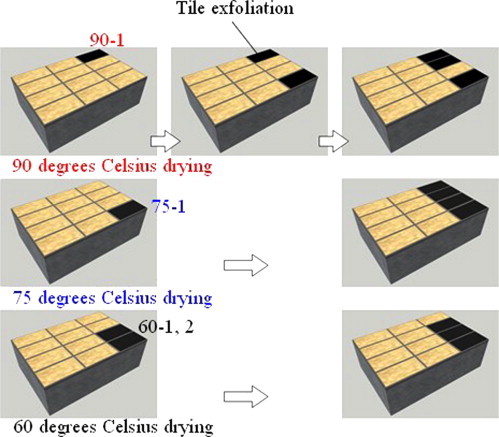
Figure 9 shows the occurrence of tile exfoliation. Tile exfoliation started at the corner of the samples in all experiments.
|
|
|
Figure 9. Occurrence of tile exfoliation (drying temperatures are 60, 75, and 90 °C). |
2.3. Relationship between tile exfoliation and change of moisture content
Because the initial (and air dry) weights of the samples were different, the weight changes do not correspond to those of the moisture content. Therefore, the moisture content had to be calculated.
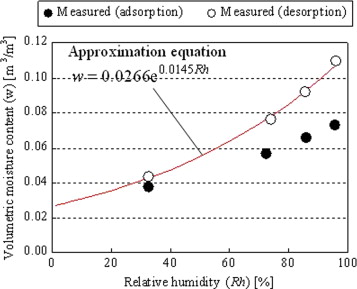
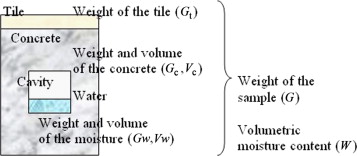
When the room air of temperature 20 °C and relative humidity 70% is introduced into the dryer and heated to 90 °C, the relative humidity becomes 2.3%. If drying continues for a sufficiently long time, the sample will equilibrate with this relative humidity. The volumetric moisture content at equilibrium is evaluated as 0.0275 m3 /m3 based on the sorption isotherm of the concrete (desorption), as shown in Figure 10 . If the volumetric moisture content when the sample is dried most can be assumed as equal to the equilibrium value (W =0.0275 m3 /m3 ), then the net volume of the concrete (Vc , in m3 , not including the volume of moisture and cavities) is derived from the measured sample weight when the sample is dried most (G , in kg), the weight of the tile (Gt =0.696 kg, constant), and the density (in the dry state) of the concrete (pc =2163 kg/m3 ), as shown in Figure 11 . Here, the density of the mortar (joint and bonding) and the concrete is assumed to be the same.
- G −Gt =Gc +Gw =pcVc +1000Vw
- W =Vw /Vc
- G −Gt =pcVc +1000VcW
- G −0.696=2163Vc +1000VcW
- Vc =(G −0.696)/(2163+1000W )
|
|
|
Figure 10. Sorption isotherm of concrete (Onmura et al., 2009 ). |
|
|
|
Figure 11. Calculation model of moisture content. |
After the net volume of concrete (Vc , in m3 ) has been decided, the volumetric moisture content for a given state (W ′, in kg) can be calculated using the measured sample weight (G ′, in kg).
W ′=(G ′−0.696-2163Vc )/(1000Vc )
The density and the sorption isotherm of the concrete were derived from the measured results for the same concrete as used in the previous research (Onmura et al., 2009 ).
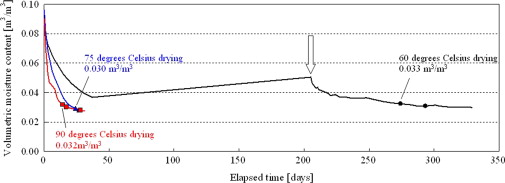
Figure 12 shows the time profile of the volumetric moisture content obtained for each drying temperature. The symbols (circle, triangle and square) in Figure 12 indicate the time (and volumetric moisture content) when a tile exfoliation occurred. The figure shows that the drying speed increases and tile exfoliation occurs earlier at higher drying temperatures. The volumetric moisture contents at which the first tile was exfoliated, were 0.033, 0.030, and 0.032 m3 /m3 in the 60, 75 and 90 °C drying experiments, respectively. That is, tile exfoliation occurs in a relatively narrow range from 0.030 to 0.033 m3 /m3 .
|
|
|
Figure 12. Change of volumetric moisture content in drying experiments. |
However, the obtained volumetric moisture content is the average value of the concrete sample including mortar and tile finish. In tile exfoliation, the moisture content of the mortar on the back side of the tile is considered crucial (Figure 5 ). Furthermore, the fact that tile exfoliation started from the corner of the sample (Figure 9 ) also suggests a close relation to the distribution of the moisture content. Therefore, an analysis of the moisture content distribution inside the sample (and its time profile) is carried out in the next chapter to clarify this relation.
3. Analysis of drying experiments
3.1. Outline of analysis
Three-dimensional unsteady analysis was carried out, as shown in Figure 13 . A quarter of the whole sample (comprising two complete and two halved tiles) was simulated considering the symmetry. Simultaneous transport equations of heat and moisture were used as basic equations (Matsumoto, 1978 ).
|
|
|
Figure 13. Schematics of simulation. |
A third kind boundary condition was used at the surface (concrete, bonding and joint mortar, and tile) adjacent to the ambient air. Because the tile is non-permeable to water, only heat transfer was calculated through the tile. Therefore, the boundary condition of no moisture flow was assumed at the boundary between the tile and the mortar (bonding and joint mortar).
As the air temperature and humidity values around the sample, the drying temperature and the absolute humidity of the room were used, respectively.
As the initial temperatures of the samples, 20 °C was used. The initial relative humidity of the samples was set at the equilibrium humidity, with an initial volumetric moisture content obtained as described in the previous chapter. Regarding the 60 °C drying experiment, however, the calculation was started at the time indicated by an arrow in Figure 12 .
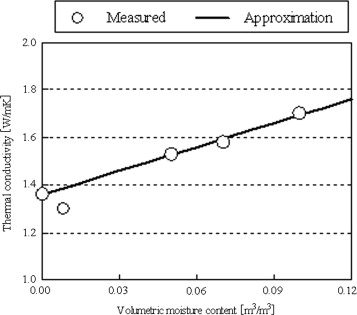
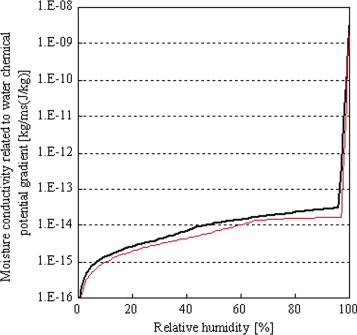
As the hygrothermal properties of the concrete, the measured (partially estimated) values using the same concrete samples were used (Onmura et al., 2009 ). Figure 14 shows the thermal conductivity of the concrete (measured value and approximation). Figure 15 shows the moisture conductivity related to water chemical potential gradient of the concrete (estimated value). The two moisture conductivity curves indicate the maximum and the minimum values. The maximum value was used for further calculation, because better agreement with the measured results was obtained. The influence of the moisture content on the thermal capacity was considered, and in calculating the heat of phase change, the temperature effect was considered. Regarding the hygrothermal properties of mortar (bonding and joint), the same values as those of the concrete were used, by assuming that there is not a large difference between concrete and mortar.
|
|
|
Figure 14. Thermal conductivity of concrete. |
|
|
|
Figure 15. Moisture conductivity related to water chemical potential gradient of concrete. |
The thermal conductivity, density and specific heat of the tile were set at 1.3 W/m K, 2400 kg/m3 , and 837.21 J/kg K, respectively. The density and specific heat of concrete (and mortar) are 2163 kg/m3 and 837.21 J/kg K, respectively.
The overall heat transfer coefficient was set at 22.5 W/m2 K (wind velocity in the dryer: 3 m/s, convection heat transfer coefficient: 17.5 W/m2 K by the empirical formula of Jürges (1924) , and radiative heat transfer coefficient: 5.0 W/m2 K). The moisture transfer coefficient was estimated to be 1.46×10⁻⁷ kg/m2 s Pa by assuming that the Lewis relation holds. Regarding the saturated vapor pressure, the Goff–Gratch approximate expression was used.
The equations were solved using an explicit finite difference method. A non-uniform mesh increment from 0.001 to 0.016 m was used, where the smaller mesh increments were used near the sample boundary. The numbers of mesh units were 27, 29, and 25 in X , Y , and Z directions, respectively. In the standard finite difference method, where the mesh increment is small, the time increment must also be small, thus, computational time required becomes very large. Therefore, a method that does not use the difference of the time derivative ( Nakazawa, 1978 ) was used in the calculation. This method solves the ordinary differential equation (with respect to time) that is derived by approximating the state variables (temperature and chemical potential) at the adjacent points as constants during one time increment. Using this method, the time derivative was set at 10.0 s.
3.2. Results of calculation and discussion
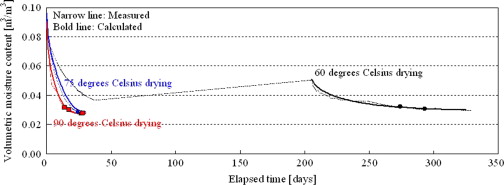
Figure 16 shows the calculated volumetric moisture content of the whole tiled concrete sample. The symbols (circle, triangle and square) in Figure 16 indicate the time (and volumetric moisture content) at which tile exfoliation occurred. The calculated results are in good agreement with the measured values. In the 75 and 90 °C drying experiments, larger moisture conductivity (Figure 15 ) was used, so that agreement with the measured values could be obtained. Further examination of this requirement is necessary.
|
|
|
Figure 16. Comparison of measured and calculated changes of volumetric moisture content. |
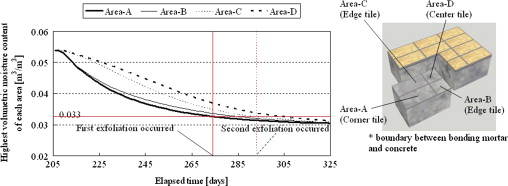
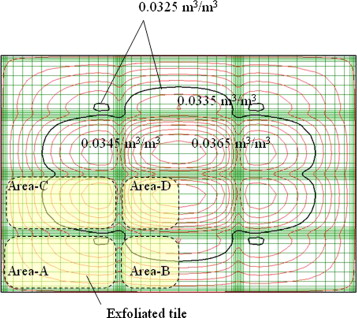
Figure 17 ; Figure 18 show the calculated time profiles and the distribution of the volumetric moisture content at the boundary between the bonding mortar and the concrete body where tile exfoliation occurred (Figure 5 ) for the 60 °C drying experiment. The back side areas of a corner tile, two edge tiles, and a center tile were called from Area-A to Area-D. Four curves in Figure 17 show the time profiles of the highest volumetric moisture content in each area. The highest moisture content at the corner (Area-A where tile exfoliation occurs earliest) is lower than that at any other area. This can be confirmed from the data shown in Figure 18 . The highest volumetric moisture content at which the first tile exfoliation occurred was 0.033 m3 /m3 (the corresponding values were 0.030 and 0.031 m3 /m3 , at 75 and 90 °C, respectively, not shown in Figure 17 ).
|
|
|
Figure 17. Calculated results (highest volumetric moisture content in four areas at drying 60 °C). |
|
|
|
Figure 18. Calculated results (distribution of volumetric moisture content at boundary between bonding mortar and concrete body for drying at 60 °C, when the first tile exfoliation occurred). |
If the tile exfoliation occurs when the moisture content becomes lower than a certain value, this critical value could be used as an index for an occurrence of tile exfoliation. From these results, at least, the volumetric moisture content must be higher than 0.033 m3 /m3 in order to avoid the tile exfoliation. The results also suggest that a suitable control of moisture content may permit to prevent tile exfoliation.
The reason why the tiles at all corners do not exfoliate at the same time appears to be caused by the variability of materials properties, bonding strength, and experimental conditions. A more detailed examination is also necessary to explain the order of tile exfoliation after the first occurrence.
4. Conclusions
Drying experiments at different drying temperatures (60, 75, and 90 °C) were carried out to examine the relationship between tile exfoliation and the moisture content of a tiled concrete sample.
The following results were obtained from the drying experiments.
- Tile exfoliation occurs when the moisture content decreases to a certain value, even if the drying temperature is relatively low.
- Tile exfoliation starts at the corner of the sample.
- Tile exfoliation occurs at the boundary between the bonding mortar and the concrete body.
Additionally, a three-dimensional analysis of simultaneous heat and moisture transport was carried out to estimate the moisture content distribution inside the concrete sample and its time profile under different drying conditions. Regarding the average volumetric moisture content of the whole sample, the calculated results are in good agreement with the measured values. Furthermore, from the calculated results of the moisture content distribution, it can be estimated as follows:
- At the position where tile exfoliation occurs (boundary between the bonding mortar and the concrete body), the volumetric moisture content is lower than it is at other locations.
- The maximum volumetric moisture content at the location of the first tile exfoliation, were 0.033, 0.030, and 0.031 m3 /m3 , in the 60, 75 and 90 °C drying conditions, respectively.
From these results, at least, the volumetric moisture content must be higher than 0.033 m3 /m3 in order to avoid tile exfoliation.
Therefore, it was concluded that the moisture content of the mortar on the back side of the tile can serve as an index for evaluating the occurrence of tile exfoliation, and that tile exfoliation might be prevented by controlling the moisture content.
References
- Jürges, 1924 Jürges J., 1924. Beih Z. Gesundheits Ingenieur. Reihe 1, Heft 19.
- Matsumoto, 1978 M. Matsumoto; Simultaneous heat and moisture transfer in porous wall and analysis of internal condensation; C.J. Hoogendoorn, N.H. Afgan (Eds.), Energy Conservation in Heating, Cooling, and Ventilating Buildings, vol. 1 (1978), pp. 45–58
- Nakazawa, 1978 Y. Nakazawa; A Study on Thermal Design of Building (Ph.D. thesis); Kyoto University (1978) (in Japanese)
- Onmura et al., 2009 Onmura S., Hokoi S., Matsushita T., Ogura D., Kominami K., and Yasui Y., 2009, Concrete Hygrothermal Properties and the Influence of Their Variability on Moisture Movement in Concrete Walls. Journal of ASTM International. Heat-Air-Moisture Transport, 2nd Volume, STP 1519, pp. 56–82.
Document information
Published on 12/05/17
Submitted on 12/05/17
Licence: Other
Share this document
Keywords
claim authorship
Are you one of the authors of this document?
![Tiling method [unit of mm].](/wd/images/c/cd/Draft_Content_160053985-1-s2.0-S2095263513000423-gr6.jpg)
