Abstract
Planning the design of the emergency department (ED) is a complex process. Hospital leaders and architects must consider many complex and interdependent factors, including evolving market demands, patient volume, care models, operational processes, staffing, and medical equipment. The application of digital tools, such as discrete event simulation (DES) and space syntax analysis (SSA), allows hospital administrators and designers to quantitatively and objectively optimize their facilities.
This paper presents a case study that utilized both DES and SSA to optimize the care process and to design the space in an ED environment. DES was applied in three phases: master planning, process improvement in the existing ED, and designing the new ED. SSA was used to compare the new design with the existing layout to evaluate the effectiveness of the new design in supporting visual surveillance and care coordination.
This case study demonstrates that DES and SSA are effective tools for facilitating decision-making related to design, reducing capital and operational costs, and improving organizational performance. DES focuses on operational processes and care flow. SSA complements DES with its strength in linking space to human behavior. Combining both tools can lead to high-performance ED design and can extend to broad applications in health care.
Keywords
Discrete event simulation ; Space syntax analysis ; Emergency department ; Health care design ; United States ; Performance-driven design
1. Introduction
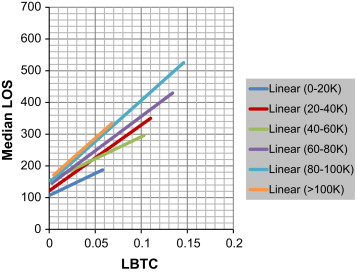
The emergency department (ED) is recognized in the United States (US) as the “front door” of hospitals, through which approximately 68% of all admitted hospital patients pass (Emergency Department Benchmarking Alliance (EDBA, 2013 )). The volume of long-term ED admittance increases by 3% per year, according to the 1992 National Hospital Ambulatory Medical Care Survey (NHAMCS), an annual summary published by the Centers for Disease Control and Prevention National Center of Health Statistics (CDC/NCHS). For example, the admittance volume in US EDs from 2008 to 2009 increased from 123.8 million to 136 million patients. Approximately 150 million patients are expected to be admitted in American EDs in 2013 (CDC/NCHS, 2013 ). US EDs currently face challenges such as crowding and long waiting time because of the large volume of patients and the uncertainty in their arrival pattern. The median length of stay (LOS) of all patients is approximately 169 min, according to the latest EDBA survey (2013), which included 974 EDs across the US. The median LOS of patients who are admitted in hospitals can be as long as 286 min. The median LOS of patients admitted in the Super ED Center, where patient volume reaches over 100,000, is 387 min, that is, longer than 6 h. Such long LOS contributes to high patient walkaway rate or cases of “left before treatment complete” (LBTC), both of which pose risks to patient safety. Figure 1 demonstrates that a direct correlation exists between ED LOS and LBTC, and such correlation generally increases as ED volume increases.
|
|
|
Figure 1. Correlation of median LOS and LBTC of different volume cohort groups (EDBA 2004–2011 data).
|
American EDs have been under significant pressure to improve the quality and efficiency of the health care they provide to their patients. Many EDs have considered updating their facilities and improving their processes. The 2010 NHAMCS data show that 23% of the respondent EDs added ED treatment spaces in the last 24 months, whereas 20% planned to expand in the next 24 months.
To ensure an environment that optimizes ED performance, hospital leaders and architects need to make decisions that consider many complex and interdependent factors, including evolving market demands, patient volume, care models, operational processes, staffing, medical equipment, and technology. The application of digital tools, such as discrete event simulation (DES) and space syntax analysis (SSA), allows hospital administrators and designers to quantitatively and objectively optimize their facilities and processes.
1.1. DES in health care
DES is a type of computer-based modeling that imitates the operation of a real-world system (Hamrock et al., 2012 ). A discrete event should be considered “as occurring instantaneously and causing transitions from one state value to another” (Cassandras and Lafortune, 2008 : 27). DES was originally developed in industrial engineering during the 1960lo and was applied to analyze industrial processes. DES models have gained increased popularity over the past 40 years among health care administrators as effective tools for allocating resources, improving patient flow, increasing patient satisfaction, and reducing health care delivery costs (Jacobson et al ., 2006 ; Jun et al ., 1999 ; Karnon et al ., 2012 ). DES is particularly appropriate for health care settings because it is capable of modeling events that trigger both predicable and unpredictable processes and of incorporating variability, which is common in health care systems (Saunders, 2010 ). Unlike static tools, such as spreadsheets, DES can also model complex interactions within and between departments. It allows decision makers to test various “what-if” scenarios systematically by evaluating the effects of multiple variables and to modify solutions until an optimal scenario is achieved.
1.1.1. Previous applications of DES in health care
DES has been applied in health care in various settings. Many publications have reported the application of DES in process redesign and optimization (Jun et al., 1999 ), staff scheduling (Alessandra and Grazman, 1978 ; Draeger, 1992 ; Rossetti et al ., 1999 ), scheduling patients and procedures in outpatient (Cayirli et al., 2006 ) and surgical units (Fitzpatrick et al ., 1993 ; Murphy et al ., 1985 ), managing patient admission in inpatient units (Hancock and Walter, 1979 ; Lim et al ., 1975 ), and using ancillary resources, such as laboratories, pharmacies, and imaging departments (Fone et al ., 2003 ; Jacobson et al ., 2006 ; Mukherjee, 1991 ). DES has also been proven to be effective in allocating health care assets, such as sizing and capacity planning of facilities (Saunders, 2010 ), exam rooms (Levy et al ., 1989 ; Mahachek and Knabe, 1984 ), patient beds (Cohen et al ., 1980 ; Kletke and Dooley, 1984 ; Zilm, 1980 ; Zilm and Hollis, 1983 ), and operating rooms (Kuzdrall et al., 1981 ), as well as resource allocation for staffing (Klafehn and Owens, 1987 ) and equipment (Bodtker et al ., 1993 ; Jun et al ., 1999 ; López-Valcárcel and Pérez, 1994 ).
1.1.2. Application of DES in ED design
The ED is a significant focus of DES applications in health care because of the unpredictable patient arrival and complex patient flow within its environment. Some studies have focused on optimal staff sizing and scheduling (Draeger, 1992 ; Duguay and Chetouane, 2007 ; Evans et al ., 1996 ; Klafehn and Owens, 1987 ; López-Valcárcel and Pérez, 1994 ; Rossetti et al ., 1999 ). Draeger (1992) used DES to test two alternative nursing staffing schedules against an existing schedule and found that patient LOS and waiting time can be reduced solely by changing the nursing staff schedule. Evans et al. (1996) used the simulation model to find the optimal number of nurses and technicians that must be on duty to reduce patient LOS.
Other DES studies, such as those that target capacity planning, have focused particularly on ED design. Huddy et al. (1999) claimed that DES can serve as a decision-making tool by helping caregivers compare the efficiency of various design options. The data can also help justify the size and cost of the expansion or redesign of ED. Baesler et al. (2003) applied DES to estimate the maximum possible demand that an emergency room can handle and the level of required configuration of resources, including the number of receptionists, physicians, paramedics, and exam rooms needed to maintain a certain quality of service. Wiinamaki and Dronzek (2003) presented a case study that used DES in the architectural conceptualization of the emergency care center at the Sarasota Memorial Hospital in Florida. Their simulation suggested the optimal number of beds and hours of operation for each clinical pod and key functional area based on the comparison of patient LOS, average waiting time, and number of patient waiting.
Several studies have also focused on optimizing patient flow and routing in EDs (García et al ., 1995 ; Kirtland et al ., 1995 ; Kraitsik and Bossmeyer, 1992 ; McGuire, 1994 ; Ruohonen et al ., 2006 ). Kraitsik and Bossmeyer, 1992 used a simulation model to demonstrate the value of using a fast-track lane and a “stat” lab to improve patient throughput. In a simulation study on the Emergency Room of Mercy Hospital in Miami, García et al., 1995 also showed that adding a fast-track lane for low-acuity non-urgent patients results in a significant reduction in patient waiting time. Similar results were reported in other simulation studies, in which several alternative approaches to reducing LOS were tested. Some recommended solutions based on these simulation studies, including providing a fast-track lane for low-acuity patients, adding a holding area for waiting patients, admitting waiting patients in the observation unit, and using point-of-care lab testing, have exhibited significant effects on ED facility planning and design (Kirtland et al ., 1995 ; McGuire, 1994 ).
1.2. SSA in health care
SSA is a digital tool that provides quantitative measures of space, both for individual space (e.g., exam room, corridor, registration desk) and overall layout (e.g., clinic, ED, entire hospital). It measures the immediate connectivity of such spaces and the interconnectivity of the global layout. Some key measures include step depth, connectivity, and integration. Step depth between two spaces is defined as the least number of syntactic steps needed to reach one space from another. Connectivity measures the number of direct connections from one space to other spaces. Integration is a global measure that describes the average depth of a space relative to all other spaces in a system ( Bafna, 2003 ).
Many studies on SSA have demonstrated that spatial configurations influence movement, physical co-presence, co-awareness, and unplanned social interactions (Grajewski, 1993 ; Penn et al ., 1999 ; Peponis et al ., 2007 ; Rashid et al ., 2006 ; Rashid and Zimring, 2003 ; Sailer et al ., 2009 ; Sailer and Penn, 2007 ; Serrato and Wineman, 1999 ). These studies also suggest that layout attributes, such as visibility and accessibility, are important factors in deliberate user movement, face-to-face communication, co-awareness, and organizational performance. The visibility and accessibility of a layout can be assessed by using the spatial measures described earlier, i.e., step depth, connectivity, and integration. For example, Rashid et al ., 2006 ; Rashid et al ., 2009 found that an office with better visibility and accessibility may help generate face-to-face interaction because of their effects on visible co-presence and movement. Wineman and Adhya (2007) also claimed that a well-connected local network, in which users can see and reach one another easily, is typically a predictor of a strong sense of community. Peponis et al. (2007) further pointed out that movement through different parts of a layout is a mechanism that generates co-awareness among different ongoing projects, co-workers, and the global environment.
Most existing space syntax studies have been conducted in settings such as offices, museums, and laboratories. Since the late 1990s, space syntax has been increasingly applied to studies on health care facilities. Hendrich et al. (2009) used the space syntax method to reanalyze existing time and motion data in nursing units. They revealed that when the integration of nursing assignments is high, the frequency of visits of nurses to patient rooms and the nurse station is also high. In a recent study, Cai and Zimring (2012) found that spatial metrics, such as integration and metric peer distance based on step depth (number of turns), can describe the strong correlation among distribution, interaction, and co-awareness of nurses. The overall number of rooms, in which a nurse is aware of the patient status, is positively correlated to the global integration value of his/her alcove (R =0.715, p =0.004). Nurses assigned in alcoves with low peer step depth have a significantly high interaction ratio. Peer step depth of nurse alcoves exhibits a strong negative correlation to the interaction ratio and co-awareness of nurses regarding the condition and location of other patients. Haq and Luo (2011) provided a systematic meta-analysis of the applications of SSA in health care.
SSA complements DES because it provides a different perspective that considers the effect of space on human behavior. The combination of these tools can help accurately predict workflow, organizational behavior, and performance, as well as provide evidence for improved decision making.
2. Case study of the Yuma regional medical center (YRMC) ED
The case study presented in this section examines an innovative approach that incorporates DES and SSA in the re-engineering of the existing YRMC ED and the design of their new ED.
YRMC is the only hospital located in Yuma, Arizona. Their existing ED of 14,000 SF is too small for approximately 76,000 annual visits, and thus, is currently being redesigned. The YRMC ED experiences a large seasonal swing in patient volume as a result of the influx of retirees fleeing the cold northern states from January to March. This seasonal swing in volume has proven to be a significant challenge for optimal space programming and staffing. The Predictive Analytics Group of RTKL Associates, Inc., a major US architectural design firm, was engaged to provide simulation services for three separate aspects of the project. The particular objectives of the design firm are as follows:
- to provide decision-making support for the master plan that will determine the site of the new YRMC ED,
- to assist process improvement and re-engineering of the existing YRMC ED, and
- to evaluate the design of the new YRMC ED.
2.1. Phase 1: using DES for optimal site allocation in master planning
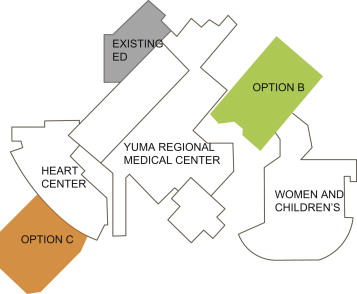
The master plan task serves as an excellent illustration of how “gut instincts,” when applied to complex and multivariable dynamic problems, frequently lead to an incorrect conclusion. Computer-simulation technology is precisely suited for these types of problems. In the case of YRMC ED, the executive committee of the hospital must choose between two options regarding the site of the new ED: Options B and C (Figure 2 ). Their initial decision, which was based on heuristics, was that Option B would be the most cost effective.
|
|
|
Figure 2. Master plan of the YRMC ED with site options B and C.
|
2.1.1. Collection of data for the current state
To evaluate quantitatively the cost effectiveness of these two master plan site options, the research team applied DES to assess the transactional relationships between the ED and 12 key clinical departments. These departments included the medical/surgical inpatient units, intensive care unit (ICU), operating room (OR), laboratory, imaging department, CT, heart center, pediatric center, labor delivery and recovery unit, observation unit, morgue, and nuclear medicine department. The number of trips per day associated with direct patient care between the ED and the 12 departments, the path and distance taken for each trip, and the hourly rate for each type of trip were determined from interviews with hospital administrators and analysis of the operational data for 2011. The trip information was based on both summer and winter volumes because of the wide seasonal swing (Table 1 ; Table 2 ).
| SUMMER 2011 | |||||
|---|---|---|---|---|---|
| Location | Type of trip | TOTAL | Location | Type of trip | TOTAL |
| Patient units-med/surg | Staff-walking | 32.8 | Heart Center of Yuma | Staff-walking | 0.1 |
| Patients-walking/wheelchair | 32.8 | Patients-walking/wheelchair | 0.1 | ||
| Patient units-ICU | Staff-walking | 2.6 | Pediatric | Staff-walking | 2.6 |
| Patients-walking/wheelchair | 2.6 | Patients-walking/wheelchair | 2.6 | ||
| OR | Staff-walking | 0.6 | LDRP | Staff-walking | 0.2 |
| Patients-walking/wheelchair | 0.6 | Patients-walking/wheelchair | 0.2 | ||
| Laboratory | Staff-walking | 5.3 | Observation | Staff-walking | 5.1 |
| Patients-walking/wheelchair | 5.3 | Patients-walking/wheelchair | 5.1 | ||
| Imaging | Staff-walking | 4.6 | Morgue | Staff-walking | 0.4 |
| Patients-walking/wheelchair | 4.6 | Patients-walking/wheelchair | 0.0 | ||
| CT | Staff-walking | 3.1 | Nuclear | Staff-walking | 0.0 |
| Patients-walking/wheelchair | 3.1 | Patients-walking/wheelchair | 0.0 | ||
| WINTER 2011 | |||||
|---|---|---|---|---|---|
| Location | Type of trip | TOTAL | Location | Type of trip | TOTAL |
| Patient units-med/surg | Staff-walking | 46.3 | Heart Center of Yuma | Staff-walking | 0.4 |
| Patients-walking/wheelchair | 46.3 | Patients-walking/wheelchair | 0.4 | ||
| Patient units –ICU | Staff-walking | 3.1 | Pediatric | Staff-walking | 2.8 |
| Patients-walking/wheelchair | 3.1 | Patients-walking/wheelchair | 2.8 | ||
| OR | Staff-walking | 0.8 | LDRP | Staff-walking | 0.6 |
| Patients-walking/wheelchair | 0.8 | Patients-walking/wheelchair | 0.6 | ||
| Laboratory | Staff-walking | 6.9 | Observation | Staff-walking | 9.8 |
| Patients-walking/wheelchair | 6.9 | Patients-walking/wheelchair | 9.8 | ||
| Imaging | Staff-walking | 6.0 | Morgue | Staff-walking | 0.4 |
| Patients-walking/wheelchair | 6.0 | Patients-walking/wheelchair | 0.0 | ||
| CT | Staff-walking | 4.0 | Nuclear | Staff-walking | 0.0 |
| Patients-walking/wheelchair | 4.0 | Patients-walking/wheelchair | 0.0 | ||
2.1.2. Simulation results
The output of the DES base model shows that based on the 2011 volume, Option C can reduce the travel distance to the 12 patient care-related departments by an average of 72.8% (Table 3 ).
| DEPARTMENT | SINGLE TRIP DISTANCE (FT) | DIFFERENCE | VARIANCE | |
|---|---|---|---|---|
| MEDMODEL PATH DISTANCE (C) | MEDMODEL PATH DISTANCE (B) | C−B | C−B/C (%) | |
| CT | 459.2 | 868.2 | −409.0 | −89.1 |
| HEART CENTER | 783.0 | 452.9 | 330.1 | 42.2 |
| ICU | 952.4 | 651.1 | 301.3 | 31.6 |
| IMAGING | 330.8 | 1025.6 | −694.8 | −210.1 |
| LABORATORY | 419.7 | 949.8 | −530.2 | −126.3 |
| LDRP | 490.4 | 1580.0 | −1089.6 | −222.2 |
| MED SURG | 708.4 | 784.9 | −76.5 | −10.8 |
| MORGUE | 556.7 | 965.6 | −409.0 | −73.5 |
| NUCLEAR | 428.9 | 909.0 | −480.1 | −111.9 |
| OBSERVATION | 618.8 | 880.7 | −261.9 | −42.3 |
| OR | 438.8 | 840.6 | −401.8 | −91.6 |
| PEDS | 417.8 | 1507.4 | −1089.6 | −260.8 |
| Total | 6604.9 | 11,415.9 | −4811.0 | −72.8 |
The distance variance was converted into operating cost to account for the hourly rates of clinical and non-clinical staff and the work days invested on patient care-related trips from the ED to the 12 clinical departments. The result demonstrated that Option C yielded a total of US$51,480 less operating cost than Option B, based on the 2011 patient volume (Table 4 ).
| 2011 Volumes | Hourly | Number of days | Summer–daily | Winter–daily | Annual–total | ||||||
|---|---|---|---|---|---|---|---|---|---|---|---|
| Rates | Summer | Winter | B | C | B | C | B | C | B–C | ||
| Hours | Patient | 182.5 | 182.5 | 9.67 | 6.16 | 13.22 | 8.63 | 4179 | 2699 | ||
| RN | 182.5 | 182.5 | 2.25 | 1.57 | 2.96 | 2.04 | 950 | 658 | |||
| Medic | 182.5 | 182.5 | 2.18 | 1.38 | 3.35 | 2.18 | 1009 | 649 | |||
| TA | 11.07 | 8.16 | 15.19 | 11.45 | 4792 | 3578 | |||||
| Total | 25.17 | 17.26 | 34.72 | 24.3 | 10,930 | 7584 | 3346 | ||||
| Cost | RN | $49.82 | $112 | $78 | $147 | $102 | $47,343 | $32,774 | |||
| Medic | $37.49 | $82 | $52 | $126 | $82 | $37,842 | $24,344 | ||||
| TA | $19.30 | $214 | $157 | $293 | $221 | $92,478 | $69,064 | ||||
| Total | $407 | $287 | $566 | $404 | $177,663 | $126,182 | $51,480 | ||||
DES also allowed decision makers to evaluate long-term life cycle operating cost. Based on the 2016 volume projected through the growth rate forecasted by hospital administrators, Option C will save US$62,500 per year in operating costs (Table 5 ). After hospital administrators reviewed the results, they were confident to proceed with Option C.
| Department | 10 Year cost | Difference | Variance | |
|---|---|---|---|---|
| Option (B) $ | Option (C) $ | (B-C)$ | (B-C)/B (%) | |
| Med surg | 1,012,492.06 | 934,150.29 | 78,341.77 | 7.70 |
| ICU | 136,918.00 | 140,725.99 | −3807.99 | −2.80 |
| OR | 39,584.16 | 15,328.65 | 24,255.51 | 61.30 |
| Laboratory | 145,737.82 | 51,324.52 | 94,413.30 | 64.80 |
| Imaging | 251,718.03 | 63,786.47 | 187,931.56 | 74.70 |
| Heart Center | 6901.62 | 16,008.68 | −9107.06 | −132.00 |
| Morgue | 10,829.71 | 4185.55 | 6644.16 | 61.40 |
| CT | 152,871.13 | 56,956.08 | 95,915.05 | 62.70 |
| Nuclear | 1050.02 | 289.53 | 760.49 | 72.40 |
| Pediatrics | 118,504.31 | 43,184.22 | 75,320.09 | 63.60 |
| Observation | 251,447.94 | 193,670.59 | 57,777.35 | 23.00 |
| LDRP | 22,712.12 | 6350.78 | 16,361.34 | 72.00 |
| Total | 2,150,766.92 | 1,525,961.35 | 624,805.57 | 29.10 |
2.2. Phase 2: process improvement for existing ED
The second phase of the project involved developing process improvement solutions for the existing ED and using DES to evaluate the effects of the proposed process changes on clinical performance, including patient LOS and queue in the waiting area.
2.2.1. Description of existing ED
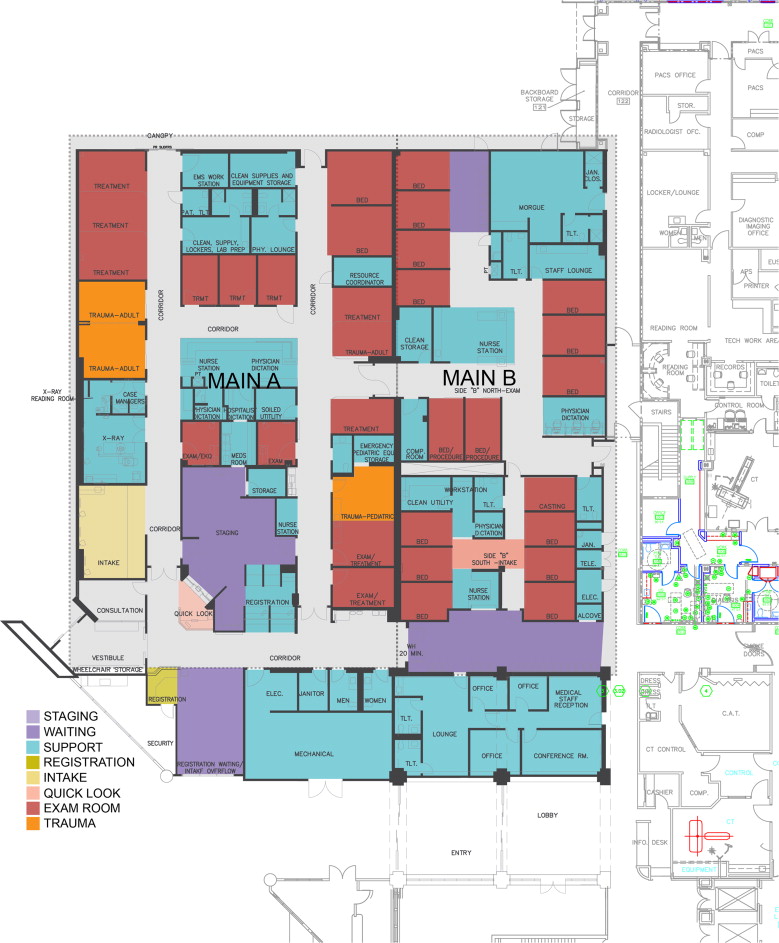
The current ED design has a “quick look” area that functions as the triage zone (Figure 3 ). The treatment area is divided into a low-acuity area (Main B) and a high-acuity area (Main A). The intake area in Main A functions as an overflow mechanism for high-acuity patients when no bed is available. The staging area has 8–10 beds for patients waiting for their test results. Main B is composed of two parts: the actual treatment area at the back and an intake area that functions as an overflow holding area for low-acuity patients. No treatment is conducted in the intake area. Main A has one nurse station, the north part of Main B (the actual treatment area) has one, and the south part of Main B (the overflow holding area) also has one.
|
|
|
Figure 3. Floor plan of the current ED.
|
2.2.2. Capturing the current state with real-time location-based service (RTLS) technology
To develop detailed performance metrics that can define the current state of the ED, the simulation group developed a leading edge application of RTLS technology to track patient and staff movement. Detailed process maps were prepared for each level of the emergency severity index1 (ESI) based on the data gathered over a 28-day study period. The ESI is a five-level tool used in ED triage. Experienced ED nurses use the ESI to rate patient acuity, from level 1 (most urgent) to level 5 (least resource-intensive). Detailed process maps with time data for each key step were used to build a simulation model of the current ED and to function as baselines for improvement methodologies that would be developed later.
2.2.3. Proposed new process flow for improvement
An ED physician consultant group was engaged to perform an assessment of the current state of ED processes, aside from collecting quantitative real-time operational data. A three-day on-site workshop with the local ED clinician team was conducted to disseminate lean principles, evaluate current processes, and design future processes. A series of recommendations was developed for the re-engineering of the existing ED and the design of the new ED.
The simulation group then worked with the ED nursing staff to summarize and group the recommendations. This collaboration produced the following seven clusters of process improvement solutions: triage standardization, separating ESI level 4 and 5 patients for super track, intake rework, pods, waiting for results, exam room standardization, and point of care. The ED nursing staff then assessed the estimated the effects of implementing these revised processes on the LOS of each ESI patient type, considering in which part of the ED they were treated (i.e., the “main” ED side or the “fast track” lower-acuity side). The estimated effects were then used to develop a revised set of process flow diagrams, which were incorporated into a future-state simulation model.
2.2.4. Simulation results of process improvement
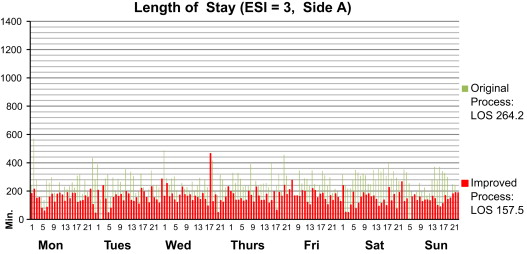
The DES model shows that the future state with the proposed process improvement performs more effectively than the current state, thus resulting in an average decrease of 44.5% in LOS and a decrease of 71.8% in the front-end queuing in waiting area A. For example, the intake and staging of ESI 3 patients in the high-acuity side of Main A are eliminated from the process, thus resulting in an estimated reduction of 90 minutes of LOS relative to the current state (Figure 4 ).
|
|
|
Figure 4. Comparison of LOS for ESI 3 patients under the improved and original processes.
|
2.3. Phase 3: designing the new ED
The third phase involved integrating the recommended processes into the new design, thus further testing the capacity of the new ED under various growth scenarios, evaluating the exam room utilization rate, and providing recommendations for the sizing of the staff.
2.3.1. Incorporating the simulation results and recommendations in the new design
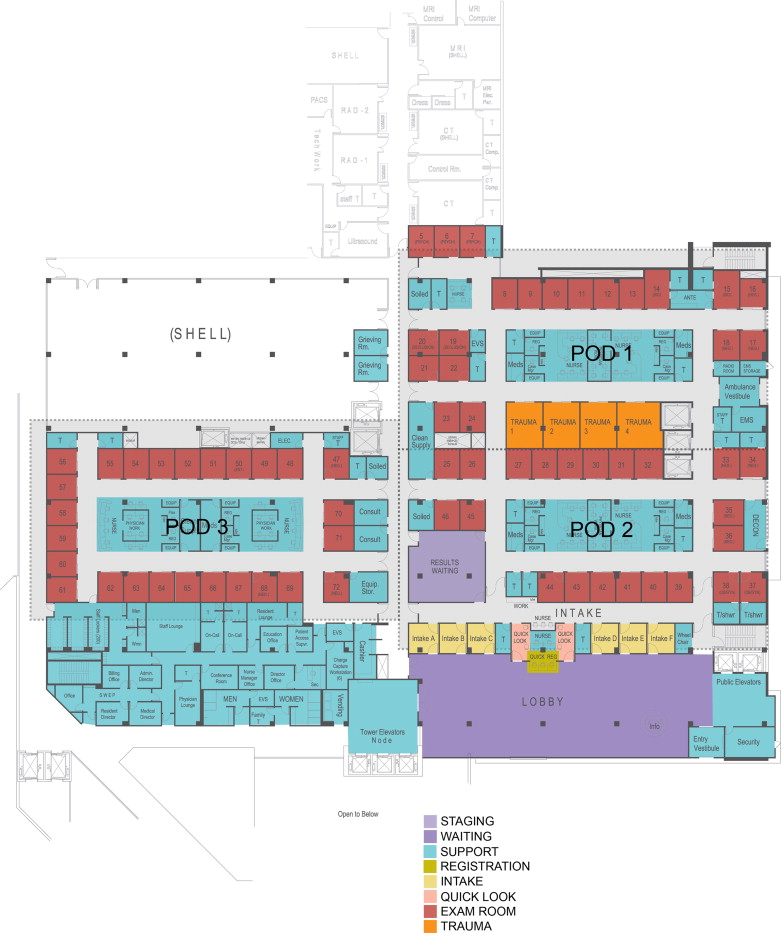
The simulation results and recommendations related to process improvement in phase 2 were fed into the design process, such that they can be used as inputs in the schematic design of the new ED. The resultant design has a total of four pods. However, one pod is reserved for future development (Figure 5 ). All exam rooms, except the trauma rooms in the three operating pods, are standardized in terms of uniform stocking, which in turn results in a flexible environment suitable for the huge seasonal swings in volume. Each pod has its focused group of patients with specific ESI levels. Pod 1 near the ambulance entrance is mainly for ESI 1s and 2s; it has four trauma rooms. Its adjacent proximity to the Imaging Department helps reduce the turnaround time for imaging. Pod 2 is located near the public lobby, through which walk-in patients enter. A “Quick Registration” and two “Quick Look” stations that rapidly sort out patients based on their ESI levels and stream them to the designated pod are found in Pod 2. Six intake rooms function as a super track for ESI 4s and 5s. Based on the assessment of the current state, the majority of ED patients are ESI 3s. They can be accommodated in either Pod 3 or Pod 2, depending on the season. A waiting area (for results) is located in Pod 3 to reduce non-value added time and non-revenue generating time that ESI 4s and 5s will otherwise spend in an exam room while test results are being prepared. Each pod has its own nurse station, where physicians and nurses are co-located.
|
|
|
Figure 5. Floor plan of the new ED design. One of the key objectives of the new design is to improve patient streaming and work flow.
|
Table 6 compares the distribution of patients by ESI level in each pod in the old and new design. The cells highlighted with orange color denote the ESI level of the majority of patients who are treated in that specific pod. The table shows that the new design has better and clearer patient segmentation than the old design. Such improvement allows the application of different staffing and care models in each pod, thus providing a more efficient operation than the old design.
| ESI Level | MAIN A_OLD | MAIN B_OLD | POD 1_NEW | POD 2_NEW | POD 3_NEW | INTAKE_NEW (SUPER TRACK) |
|---|---|---|---|---|---|---|
| 1 | X | X | ||||
| 2 | X | X | X | |||
| 3 | X | X | X | X | X | |
| 4 | X | X | X | X | ||
| 5 | X | X |
2.3.2. Testing the new design through simulation
The new design was evaluated through simulation. Patient journeys for each ESI level were redefined based on the new design and the application of process improvements. Using the current state as baseline information, the team simulated patient volumes, room utilization, and staffing requirements of three planning scenarios (2016, 2026, and 2036), each with different annual growth rates (1%, 3%, and 5%, respectively). Seasonal volume swings were also considered by simulating the volumes for the winter peak, winter average, and summer average, which resulted in a total of 27 different future-state scenarios (Table 7 ).
| Planning horizon | Growth rate (%) | Season | Volume | Index no. | Daily patient volume (2011) | Daily patient volume (Future) |
|---|---|---|---|---|---|---|
| 2016 | 1 | Winter | Peak-mean | 1 | 302 | 320 |
| Average | 2 | 216 | 229 | |||
| Summer | Average | 3 | 186 | 197 | ||
| 3 | Winter | Peak-mean | 4 | 302 | 360 | |
| Average | 5 | 216 | 257 | |||
| Summer | Average | 6 | 186 | 222 | ||
| 5 | Winter | Peak-mean | 7 | 302 | 405 | |
| Average | 8 | 216 | 289 | |||
| Summer | Average | 9 | 186 | 250 | ||
| 2026 | 1 | Winter | Peak-mean | 10 | 302 | 354 |
| Average | 11 | 216 | 252 | |||
| Summer | Average | 12 | 186 | 218 | ||
| 3 | Winter | Peak-mean | 13 | 302 | 484 | |
| Average | 14 | 216 | 345 | |||
| Summer | Average | 15 | 186 | 298 | ||
| 5 | Winter | Peak-mean | 16 | 302 | 659 | |
| Average | 17 | 216 | 470 | |||
| Summer | Average | 18 | 186 | 406 | ||
| 2036 | 1 | Winter | Peak-mean | 19 | 302 | 393 |
| Average | 20 | 216 | 280 | |||
| Summer | Average | 21 | 186 | 242 | ||
| 3 | Winter | Peak-mean | 22 | 302 | 653 | |
| Average | 23 | 216 | 466 | |||
| Summer | Average | 24 | 186 | 402 | ||
| 5 | Winter | Peak-Mean | 25 | 302 | 1076 | |
| Average | 26 | 216 | 768 | |||
| Summer | Average | 27 | 186 | 663 |
2.3.3. Simulation results
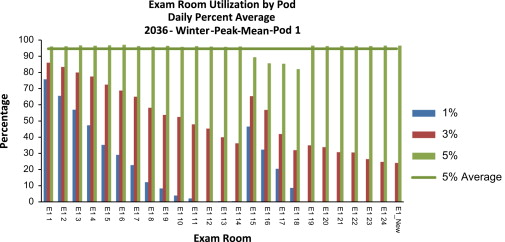
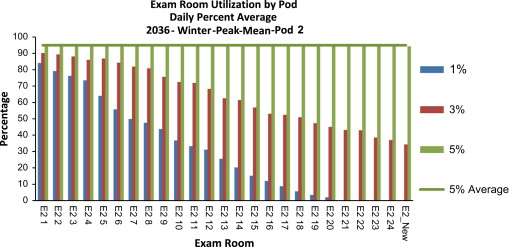
The simulation results show that the new design can support the volume of the opening year 2016, even with the highest annual growth rate (5%). However, under the 5% annual growth rate scenario, a shortage of exam rooms will occur in Pods 2 and 3 during peak hours (19:00–22:00) of the winter peak season of 2026. All exam rooms in Pods 1 and 2 will reach more than 95% utilization rate by the winter peak season of 2036. This result demonstrates the breaking point of the current capacity and the need to open up shell space for additional exam rooms (Figure 6 ; Figure 7 ).
|
|
|
Figure 6. Exam room utilization of Pod 1 given the patient volume of the 2036 winter peak.
|
|
|
|
Figure 7. Exam room utilization of Pod 2 given the patient volume of the 2036 winter peak.
|
Using EDBA data (2013), the team also simulated the total number of physicians, nurses, and technicians needed to staff the entire new ED each hour of the day.
- Nurse hours=Patient daily volume/0.7
- Technician hours=Patient daily volume/1.5
- Physician hours=Patient daily volume/2.5
These hours were then allocated in each hour of the day as a function of the patient population for that hour and as a percentage of total patient volume for the entire day. The simulation results reveal the need to acquire additional staff members to support the future operations of the new ED by 2026.
2.4. Analyzing the new ED design through SSA
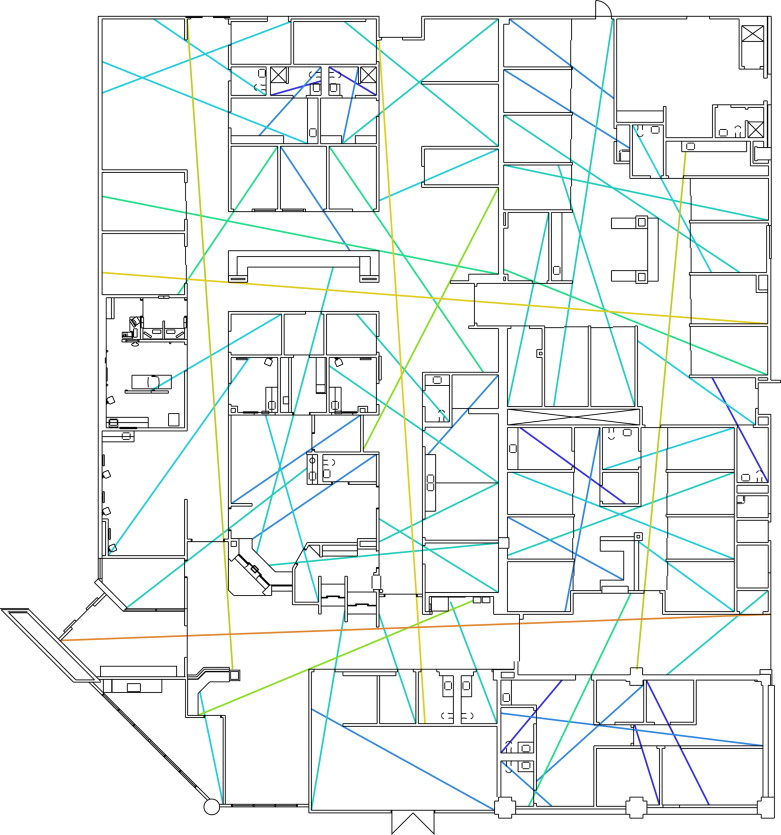
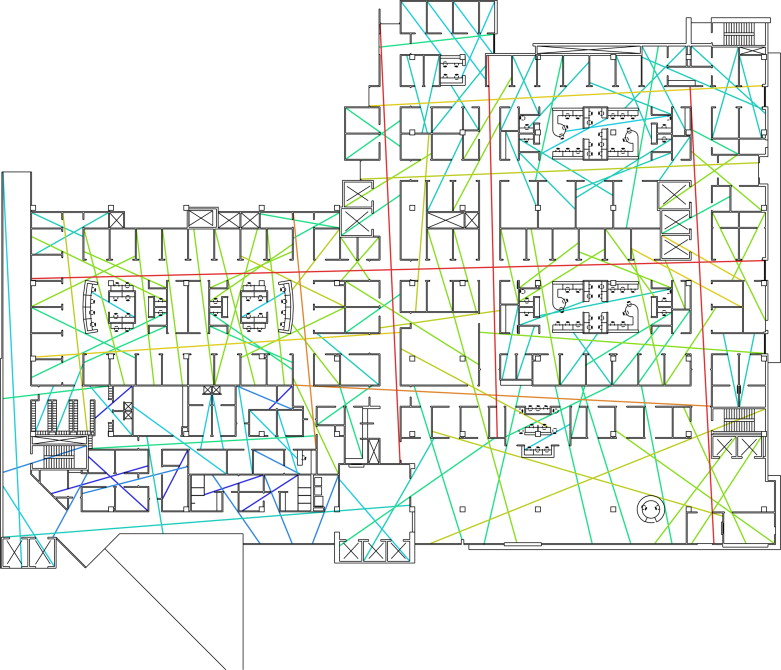
As part of the internal performance improvement effort, the research team also applied SSA to compare the new ED design with the existing spatial layout after completing the simulation project. The former has more than twice the number of beds than the latter, i.e., 78 beds versus 37 beds, respectively. The size of the unit also drastically increased from 18,010 ft2 to 50,330 ft2 . Various issues arise with the increase in size, including peer awareness in the unit, lack of communication among caregivers, and effectiveness of patient surveillance. To improve patient streaming, the new design is equipped with additional pods and sub-areas, which may lead to the isolation of caregivers and reduce the level of peer support. Space syntax was applied to analyze the influence of spatial configuration on the effectiveness of visual surveillance, movement, and informal communication. The analysis was conducted by using axial maps to calculate connectivity and integration of the old and new layouts. The axial maps are colored based on the integration value. The color shifts from blue to red as value increases, which is from 0.8 to 3.0, in this case (8 and 9) Figure 8 ; Figure 9 .
|
|
|
Figure 8. Colored axial map of the new YRMC ED.
|
|
|
|
Figure 9. Colored axial map of the new YRMC ED.
|
The analysis showed that the new design has both larger integration and connectivity than the old design. It also indicated that the new design is visually better and more physically accessible than the old design at both local and global levels. The structures of the axial maps are linked social and organizational constructs, such as hierarchy, territoriality, and privacy. A strong sense of territoriality is reflected in space when the local axial structure is well connected, cut through by only a few axial lines, and has minimal connections with the global structure. A high level of privacy is achieved when axial lines have low integration and connectivity, and when only a few axial lines cut through the space. A comparison of the structures of the axial maps demonstrated that the new ED has a stronger sense of territoriality than the old ED. The staff backstage area at the southwest corner of the layout has a significantly lower integration value and a higher sense of privacy relative to the other spaces.
The team further evaluated the step depth from each nurse station to key functional areas in both the old and new layouts (Table 8 ). Most values in the new layout are smaller than those in the old layout, particularly for the exam and trauma rooms. For example, the trauma rooms in the new layout are 0.142 steps away from the nurse station in Pod 1, which means that they are within the direct visual reach of that nurse station. By contrast, the average step depth of the trauma rooms in the old layout is 1.6, which means that they are at least 1 turn away from the nurse station. All exam rooms in the new layout also have a smaller step depth from their corresponding nurse station than those in the old layout.
| Yuma old ED | Nurse station A | Nurse station B north | Nurse station B south |
|---|---|---|---|
| Lobby waiting | 2 | 3 | 3 |
| Registration | 3 | 3.5 | 3.5 |
| Quick look | 1 | 3 | 3 |
| Intake | 2 | 4 | 3 |
| Results waiting | 3.2 | 3.8 | 3.8 |
| Exam room | 2.828 | 2.793 | 2.897 |
| Trauma room | 1.6 | 3.6 | 3.6 |
| Average | 3.015 | 3.338 | 3.354 |
| Yuma new ED | Nurse station pod 1 | Nurse station pod 2 | Nurse station pod 3 |
| Lobby waiting | 2.571 | 2.571 | 2.071 |
| Registration | 3 | 3 | 2.5 |
| Quick look | 2.714 | 2.714 | 2 |
| Intake | 2.625 | 2.625 | 2 |
| Results waiting | 2.25 | 2.25 | 2 |
| Exam room | 2.221 | 1.5 | 1.485 |
| Trauma room | 0.142 | 3 | 3 |
| Average | 2.787 | 2.232 | 1.963 |
Moreover, the results showed that all step depths between nurse stations decreased in the new layout (Table 9 ). That is, less turns are required to reach one station from another, which leads to better co-awareness, and hence, increased opportunities for social interaction and improved peer support.
| NS step depth_old | NS step depth_new | |
|---|---|---|
| NS 1–NS 2 | 4 | 3.1 |
| NS 1–NS 3 | 3.5 | 3.2 |
| NS 2–NS 3 | 2.5 | 1.8 |
In summary, the design of the new ED, despite its increased number of pods and size of units, has higher visibility and accessibility, as well as facilitates better visual surveillance of patients, higher potential for informal interaction among peers, and better co-awareness, than the existing ED. SSA was not part of the deliverables to the client in this project, but its application and results did provide important validation information for future designs. The analysis also demonstrated the value of integrating DES and SSA in designing future processes.
3. Discussion and conclusion
In this case study, DES was applied in the master planning, process re-engineering, and new design phases. It facilitated decision making related to the sitting of the ED and reduced annual labor costs by US$625,000 per year relative to other possible locations. During the process improvement phase, DES demonstrated how revised operational processes with patient streaming and different operational models in different ED pods can reduce patient LOS and waiting time. DES was also proven to be effective in capacity planning and in resource allocation of the staffing for the new ED. By comparing the new design with the existing layout, SSA demonstrated that the new ED environment results in a more efficient visual surveillance and better peer support than the old ED environment. This study demonstrated that DES and SSA are effective tools for facilitating evidence-based and performance-driven design decision making, reducing capital and operational costs, and improving organizational performance. Both tools can provide quantitative data that health care administrators and designers need to develop solutions for operational processes, facility planning and design, and resource allocation.
Although DES and SSA have gradually gained popularity in the field of health care, they are seldom used together. This study suggests an innovative approach that utilizes both DES and SSA to optimize care processes and spatial design. Given its focus on operational processes and care flow, DES can help integrate patient flow and work processes with spatial design and generate an optimal balance between short-term capital investments and long-term operational cost commitments. SSA complements DES because it specializes in providing quantitative measures that indicate how space directly affects human experiences and organizational performance. Combining both tools can lead to a high-performance ED design and may be extended to a wide range of applications in health care design.
Future studies should monitor the outcome of the interventions suggested by DES and SSA to validate the simulation results and prove their value through actual performance metrics. In the context of health care facility planning and design, pre- and post-occupancy evaluation will be an effective tool to combine with DES/SSA to demonstrate the effectiveness of these digital tools.
Acknowledgment
The authors wish to thank the Predictive Analytics Group of RTKL Associates, Inc. for their contribution to this work.
References
- Alessandra and Grazman, 1978 A.J. Alessandra, T.E. Grazman; Using simulation in hospital planning; Simulation, 30 (1978), pp. 62–67
- Baesler, 2003 Baesler, F. F., Jahnsen, H. E. and DaCosta, M. 2003. Emergency departments I: the use of simulation and design of experiments for estimating maximum capacity in an emergency room. Paper presented to the Proceedings of the 35th conference on Winter simulation: driving innovation, 2003.
- Bafna, 2003 S. Bafna; Space Syntax: a brief introduction to its logic and analytical techniques; Environ. Behav., 35 (2003), pp. 17–29
- Bodtker et al., 1993 K. Bodtker, L. Wilson, W. Godolphin; Simulation modelling to assist operational management and planning in clinical laboratories; Simulation, 60 (1993), pp. 247–255
- Cai and Zimring, 2012 Cai, H., Zimring, C. 2012. Out of Sight, Out of Reach: correlating spatial metrics of nurse station typology with nurses׳ communication and co-awareness in an intensive care unit. Paper presented to the 2012. Proceedings: Eighth International Space Syntax Symposium, Santiago de Chile: PUC, 2012.
- Cassandras and Lafortune, 2008 C.G. Cassandras, S. Lafortune; Introduction to Discrete Event Systems; Springer Science + Business Media, New York (2008)
- Cayirli et al., 2006 T. Cayirli, E. Veral, H. Rosen; Designing appointment scheduling systems for ambulatory care services; Health Care Manage. Sci., 9 (2006), pp. 47–58
- CDC/NCHS, 2013 CDC/NCHS, 2013. National Hospital Ambulatory Medical Care Survey (NHAMCS): 2010 Emergency Department Summary Tables (ed.) C.f.D.C.a. Prevention: CDC/NCHS.
- Cohen et al., 1980 M.A. Cohen, J.C. Hershey, E.N. Weiss; Analysis of capacity decisions for progressive patient care hospital facilities; Health Serv. Res., 15 (1980), p. 145
- Draeger, 1992 Draeger, M.A., 1992. An emergency department simulation model used to evaluate alternative nurse staffing and patient population scenarios. Paper presented to the Proceedings of the 24th Conference on Winter Simulation, 1992.
- Duguay and Chetouane, 2007 C. Duguay, F. Chetouane; Modeling and improving emergency department systems using discrete event simulation; Simulation, 83 (2007), pp. 311–320
- EDBA, 2013 EDBA (Emergency Department Benchmarking Alliance), 2013. The Emergency Department Performance Measures Data Guide, Including the Emergency Department Benchmarking Alliance Data Survey and Analysis for the Year 2012 (Internet-based database requires membership to access). Emergency Department Benchmarking Alliance 〈http://www.edbenchmarking.org/〉 .
- Evans et al., 1996 Evans, G.W., Gor, T.B., Unger, E. 1996. A simulation model for evaluating personnel schedules in a hospital emergency department. Paper Presented to the Proceedings of the 28th Conference on Winter Simulation, 1996.
- Fitzpatrick et al., 1993 K.E. Fitzpatrick, J.R. Baker, D.S. Dave; An application of computer simulation to improve scheduling of hospital operating room facilities in the United States; Int. J. Comput. Appl. Technol., 6 (1993)
- Fone et al., 2003 D. Fone, S. Hollinghurst, M. Temple, A. Round, N. Lester, A. Weightman, K. Roberts, E. Coyle, G. Bevan, S. Palmer; Systematic review of the use and value of computer simulation modelling in population health and health care delivery; J. Publ. Health, 25 (2003), pp. 325–335
- García et al., 1995 García, M.L., Centeno, M.A., Rivera, C., DeCario, N. 1995. Reducing time in an emergency room via a fast-track. Paper Presented to the Simulation Conference Proceedings, 1995. Winter, 1995.
- Grajewski, 1993 T. Grajewski; The SAS head office: spatial configuration and interaction patterns; Nord. J. Archit. Res., 2 (1993), pp. 63–74
- Hamrock et al., 2012 E. Hamrock, K. Paige, J. Parks, J. Scheulen, S. Levin; Discrete event simulation for healthcare organizations: a tool for decision making; J. Healthc. Manage./Am. Coll. Healthc. Exec., 58 (2012), pp. 110–124 (Discussion 24-5)
- Hancock and Walter, 1979 W.M. Hancock, P.F. Walter; The use of computer simulation to develop hospital systems; ACM SIGSIM Simulat. Dig., 10 (1979), pp. 28–32
- Haq and Luo, 2011 S. Haq, Y. Luo; Space syntax in healthcare facilities research: a review; HERD, 5 (2011), pp. 98–117
- Hendrich et al., 2009 A. Hendrich, M. Chow, S. Bafna, R. Choudhary, Y. Heo, B. Skierczynski; Unit-related factors that affect nursing time with patients: spatial analysis of the time and motion study; HERD, 2 (2009), p. 5
- Huddy et al., 1999 J. Huddy, J. McKay, K. Culp; Computer simulation: making better operational and architectural ED design decisions; J. Emergency Nurs., 25 (1999), pp. 307–310
- Jacobson et al., 2006 S. Jacobson, S. Hall, J. Swisher; Discrete-event simulation of health care systems. Patient flow: reducing delay; R. Hall (Ed.), Healthcare Delivery, 211–52, Springer, US (2006)
- Jun et al., 1999 J. Jun, S. Jacobson, J. Swisher; Application of discrete-event simulation in health care clinics: a survey; J. Operat. Res. Soc., 50 (1999), pp. 109–123
- Karnon et al., 2012 J. Karnon, J. Stahl, A. Brennan, J.J. Caro, J. Mar, J. Möller; Modeling using discrete event simulation a report of the ISPOR-SMDM modeling good research practices task force–4; Med. Dec. Mak., 32 (2012), pp. 701–711
- Kirtland et al., 1995 Kirtland, A., Lockwood, J., Poisker, K., Stamp, L. & Wolfe, P. 1995. Simulating an emergency department “is as much fun as…”. Paper Presented to the Simulation Conference Proceedings, 1995. Winter, 1995.
- Klafehn and Owens, 1987 Klafehn, K.A. & Owens, D.L. 1987. A simulation model designed to investigate resource utilization in a hospital emergency room. Paper Presented to the Proceedings of the Annual Symposium on Computer Application in Medical Care, 1987.
- Kletke and Dooley, 1984 M. Kletke, T. Dooley; Simulation model of a maternity ward: a key planning tool for hospital administrators; Simul. Healthc. Deliv. Syst., 1984 (1984), pp. 35–39
- Kraitsik and Bossmeyer, 1992 Kraitsik, M., Bossmeyer, A. 1992. Simulation applied to planning an emergency department expansion. Paper presented to the JG Anderson. 1992 Western Simulation Multiconference: Simulation in Health Care and Social Services, 1992.
- Kuzdrall et al., 1981 P.J. Kuzdrall, N. Kwak, H.H. Schmitz; Simulating space requirements and scheduling policies in a hospital surgical suite; Simulation, 36 (1981), pp. 163–171
- Levy et al., 1989 J.L. Levy, B. Watford, V. Owen; Simulation analysis of an outpatient services facility; J. Soc. Health Syst., 1 (1989), pp. 35–49
- Lim et al., 1975 T. Lim, D. Uyeno, I. Vertinsky; Hospital admissions systems a simulation approach; Simul. Gam., 6 (1975), pp. 188–201
- López-Valcárcel and Pérez, 1994 B.G. López-Valcárcel, P.B. Pérez; Evaluation of alternative functional designs in an emergency department by means of simulation; Simulation, 63 (1994), pp. 20–28
- Mahachek and Knabe, 1984 A.R. Mahachek, T.L. Knabe; Computer simulation of patient flow in obstetrical/gynecology clinics; Simulation, 43 (1984), pp. 95–101
- McGuire, 1994 McGuire, F., 1994. Using simulation to reduce length of stay in emergency departments. Paper Presented to the Simulation Conference Proceedings, 1994. Winter, 1994.
- Mukherjee, 1991 A.K. Mukherjee; A simulation model for management of operations in the pharmacy of a hospital; Simulation, 56 (1991), pp. 91–103
- Murphy et al., 1985 Murphy, D.R., Duket, S.D., Sigal, E., 1985. Evaluating surgical block schedules using computer simulation. Paper Presented to the Proceedings of the 17th Conference on Winter Simulation, 1985.
- Penn et al., 1999 A. Penn, J. Desyllas, L. Vaughan; The space of innovation: interaction and communication in the work environment; Environ. Plan. B: Plan. Des., 26 (1999), pp. 193–218
- Peponis et al., 2007 Bafna Peponis, Bromberg Bajaj, Rashid Congdon, Zhang Warmels, Zimring; Designing space to support knowledge work; Environ. Behav., 39 (2007), pp. 815–840
- Rashid et al., 2006 M. Rashid, K. Kampschroer, J. Wineman, C. Zimring; Spatial layout and face-to-face interaction in offices – a study of the mechanisms of spatial effects on face-to-face interaction; Environ. Plan. B: Plan. Des., 33 (2006), pp. 825–844
- Rashid et al., 2009 M. Rashid, J. Wineman, C. Zimring; Space, behavior, and environmental perception in open-plan offices: a prospective study; Environ. Plan. B: Plan. Des., 36 (2009), pp. 432–449
- Rashid and Zimring, 2003 Rashid, M., Zimring, C., 2003. Organizational constructs and the structure of space: a comparative study of office layouts. Paper Presented at the 4th International Space Syntax Symposium, UCL, London.
- Rossetti et al., 1999 Rossetti, M.D., Trzcinski, G.F., Syverud, S.A., 1999. Emergency department simulation and determination of optimal attending physician staffing schedules. Paper Presented to the Simulation Conference Proceedings, 1999 Winter, 1999.
- Ruohonen et al., 2006 Ruohonen, T., Neittaanmaki, P., Teittinen, J., 2006. Simulation model for improving the operation of the emergency department of special health care. Paper Presented to the Simulation Conference, 2006. WSC 06. Proceedings of the Winter, 2006.
- Sailer et al., 2009 Sailer, K., Budgen, A., Lonsdale, N., Turner, A., Penn, A., 2009. Comparative studies of offices pre and post—how changing spatial configurations affect organisational behaviours. Paper Presented at the Proceedings of the 7th International Space Syntax Symposium, Stockholm, KTH.
- Sailer and Penn, 2007 Sailer, K., Penn, A., 2007. The performance of space–exploring social and spatial phenomena of interaction patterns in an organisation. Paper Presented at the International Architecture and Phenomenology Conference, Haifa.
- Saunders, 2010 Saunders, N.M., 2010. Application of Simulation to Facility Planning Utilizing an Organization׳s Forecasted Growth Strategy. Perspectives in Health Information Management/AHIMA, American Health Information Management Association 7.
- Serrato and Wineman, 1999 Serrato, M., Wineman, J., 1999. Spatial and communication patterns in research and development facilities. Paper presented at the Second International Space Syntax Symposium, Brazilia.
- Wiinamaki and Dronzek, 2003 Wiinamaki, A., Dronzek, R., 2003. Emergency departments I: using simulation in the architectural concept phase of an emergency department design. Paper Presented to the Proceedings of the 35th Conference on Winter Simulation: Driving Innovation, 2003.
- Wineman and Adhya, 2007 Wineman, J., Adhya, A., 2007. Enhancing Workspace Performance: predicting the influence of spatial and psychosocial factors on job satisfaction. Paper presented to the 6th Space Syntax Symposium, 12th–15th June 2007, Istanbul, 2007.
- Zilm, 1980 F. Zilm; Computer Modeling in Hospital Planning: Three Case Studies: Architectural Research Laboratory; University of Michigan, Ann Arbor, Michigan (1980)
- Zilm and Hollis, 1983 F. Zilm, R.B. Hollis; An application of simulation modeling to surgical intensive care bed need analysis in a university hospital; Hosp. Health Serv. Admin., 28 (1983), p. 82
Notes
1. A detailed description of ESI can be found in http://www.esitriage.org/ .
Document information
Published on 12/05/17
Submitted on 12/05/17
Licence: Other
Share this document
Keywords
claim authorship
Are you one of the authors of this document?

