1. Introduction
Thermoplastic welding is a specific joining technique where the polymer is locally heated at interface between two components to be joined until it liquefies and later cooled down for joint consolidation[1],[2]. Thermoplastic welding contributes to the cost-effectiveness in manufacturing of thermoplastic composites overcoming numerous issues associated with conventional joining processes such as extensive surface preparation and long curing cycles that characterizes adhesive bonding processes or stress concentration and intense labor typical of mechanical fastening. Among the various techniques, ultrasonic [3], [4], resistance[5] and induction welding [6], [7] are considered to be most suitable for thermoplastic. Induction welding potentially allows for geometrically complex welds and does not oblige any contact with the welding stack for heating, which increases flexibility and simplifies automation [8]
For greater use in the aerospace industry of this type of union, a clear understanding of damage progression during the service life is a crucial prerequisite in order to establish inspection intervals and maintenance operations for welded structures. However, only scarce data are currently available regarding fatigue properties of welds. An experimental evaluation of ultrasonic, induction and resistance welding of CF/PPS composites was presented in [9]. The main conclusion of the comparative studies is that no remark- able differences can be observed in the S-N behavior of any of the joints under study. The tension–tension fatigue performance was similar for all the three types of welds with indefinite fatigue limits around 40% of the corresponding static LSS. To date, with the exception of the work just mentioned, research into the fatigue behavior of induction welded joints is practically absent in literature according to the authors’ effort.
Structural Health Monitoring (SHM) could enable a depth understanding of the damage progression through the integration of sensors in the monitored structure and acquiring and analyzing the produced data during the service life to inform about damage existence, localization and type. The ability to have real time access to the health status of thermoplastic joint at every moment of its life could enable a depth understanding of the damage progression and promote the passage from a scheduled driven maintenance regime to a condition based maintenance approach. Several techniques can be applied for a given type of damage and some methods may have a greater sensitivity to a particular defect than others [10]–[12]. Electromagnetic-based SHM and strain back-face strain techniques are currently mainly investigated by the authors. The goal of the present work is to evaluate their capability in evaluating the state of health and damage propagation of CF/PAEK induction welded joints.
In back-face strain techniques [13], [14], a strain gauge is installed on the surface of the adherents near a site of anticipated fatigue damage. Electromagnetic-based SHM techniques are based on the principle that damage presence affects locally the electro- magnetic characteristics of the material, in particular, the electrical conductivity and/or the dielectric permittivity for fibers reinforced polymers [15]–[17]. Lap-shear joints were fabricated using different process parameters and defective welds were obtained in a fully controlled way. The static as well as dynamic properties of the samples were evaluated and specimens are inspected and tested using both SHM methods.
2. Methodology
2.1. Materials
The employed composite material used to make the welded samples consisted of 2.5 mm thick CFRTP laminates having Polyaryletherketone (PAEK) polymer matrix and five harness satin weave carbon fibre, supplied by Toray Industries, Inc. The dimension of the specimen to be welded was 240 mm by 100 mm.
2.2. Induction welding process
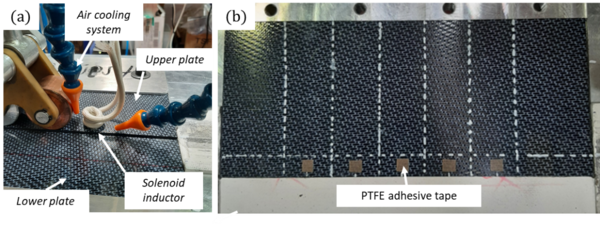
A commercial induction welding machine (Bielec S.L.) was used to manufacture the welded specimen (Figure 1.a). It consists of an integrated multifunctional controller driving a solid-state frequency generator. Energy was transferred to the CFRP laminates by a solenoid inductor, moved by an industrial robot (KUKA). A sufficient air cooling was employed to avoid the burning of the upper face of the workpiece and an adjustable pressure application system consisting of two rollers completed the consolidation process.
Figure 1 (a) Relevant components of Induction welding system. (b) PTFE adhesive tapes placed in the joint line for obtaining defective welds in a fully controlled way.
| Manufacturing cases | Travel speed [m/min] | Excitation coil voltage [V] | Frequency [kHz] | Distance coil-plate [mm] |
| Set-up 1 | 1.2 | 130 | 183 | 5 |
| Set-up 2 | 1.6 | 147 | 183 | 5 |
| Set-up 1-DEF | 1.2 | 130 | 183 | 5 |
Three kind of welded lap-joints were manufactured: two different set of process parameters (set-up 1 and set-up 2) were selected to assess damage sensing techniques for two different mechanical joint properties; a third configuration was fabricated using the same welding process parameter of set-up 1 and employing an artificial defect placed in the joint line for obtaining defective welds in a fully controlled way (set-up 1-DEF). In order to reproduce the presence of a lack of weld, Glass fibres reinforced Polytetrafluoroethylene (PTFE) adhesive tapes (Tooltec® A005 supplied by AIRTECH Europe SARL) of 8x8 mm dimensions was collocated in the bond line before welding operations (Figure 1.b).
Table 1 shows the induction welding process parameter employed for each case.
2.3. Characterization of welded joints
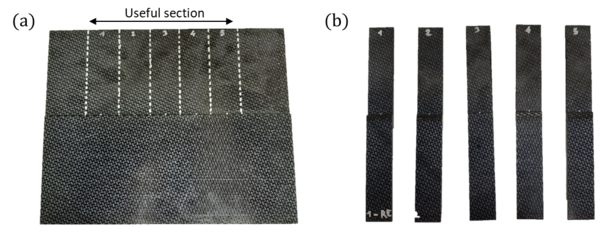
Five specimens were extracted from each welded sample for static and fatigue tests. Figure 2 shows the useful section of the weld samples where specimens were extracted. In fact, the induced currents are distorted in these areas (edge effect) and consequently the resulting heat distribution is different from that one associated to the real process parameters.
Figure 2 (a) Useful section of the weld samples where (b) specimens for quasi-static and fatigue tests were extracted.
Specimens per each case were tested according to ASTM D1002 in a MTS QTEST 159 Universal Testing Machine. Tabs were applied to the samples in order to ensure a load path parallel to the overlap line.
Sinusoidal tension–tension fatigue tests were carried out with load ratio R of 0.1 and a frequency of 2 Hz taking the ASTM D 1002 standard as a reference in a MTS 100 kN fatigue test bench. The fatigue test plan was defined with the aim of evaluating the ability of the investigated SHM approaches in detecting incipient and propagating damage rather than studying the dynamic properties of the obtained welds. Set-up 1 and set-up 2 specimens were tested at a load level equivalent to the 70% of the lap-shear strength (LSS). Different life cycles were expected from these two cases and the employed sensing techniques were evaluated at different propagating scenarios. Welded specimen having embedded defects in the bondline (set up 1 – DEF) were tested at the same load level of set up 1 and an early break was expected due to artificially generated lack of welding in the bondline. With the aim of optimizing test times, a limit of around 36,000 cycles was established at the end of which, if the specimen had not broken, then the load level would have been increased to 80% of the LSS in order to speed up the achievement of the failure condition.
2.4. Damage sensing
Purpose-designed electromagnetic-based SHM sensor (EM sensor) and strain gauges were employed as damage sensing techniques in the present study.
The working principle of EM sensor is based on the interaction between a local time variant magnetic field excitation and a change in the electromagnetic properties of the material induced by the presence of a defect. The sensor geometry consists of an exception loop and a reception loop in charge of local magnetic field generation and measurement, respectively (Figure 3).
A sinusoidal signal with a frequency varying from 0.1 and 22 MHz and an output voltage of 3.5 Vrms was generated by the frequency response analyzer module integrated in Moku Pro software-defined hardware platform. The measured voltage of the reception coil was collected and Bode diagram sensor response was obtained. The EM sensor was initially placed on the weld overlap zone before and after machining operation in order to assess how sensor damage sensitivity is affected by the reduction of sample width due to machining operations.
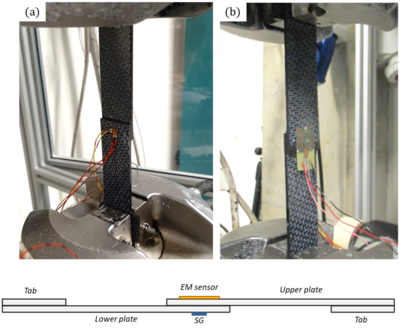
During static and fatigue tests, strain gauge (SG) were installed in one of the adherents backface centered in the overlap area as shown in Figure 4. On the opposite face the EM sensor is installed so that emission and reflection loops are centred in the overlap zone.
3. Results and discussion
3.1. Single-lap joint lap shear test results
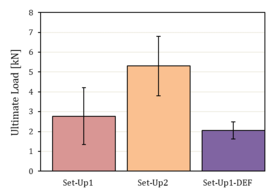
Figure 5 displays the results of the single-lap shear tests. Induction welds manufactured by set-up 1 processing parameters have an average ultimate load around 2.8 kN. Corresponding welds obtained with the same process parameters but having an artificially generated defect have lower static properties (around 2.1 kN) as expected due to the smaller welding area. Set-up 2 processing parameters give better static mechanical properties than set-up 1 ones with an average ultimate load of 5.8 kN. The greater properties of set-up 2 are attributed to the higher welding quality that can be achieved throught the process parameters employed. The lower travel speed of set-up 1 as reported in Table 1 is equivalent to longer time of exposure of the workpiece to the induction field. Longer time of exposure usually results in a higher quality of weld because more polymer chains are given time to move across the weld interface. However, excessively long times leads to thermal degradation of the polymer and a consequent degradation of weld strenght[8]. Therefore, the lower mechanical properties of the welds obtained with the set-up 1 processing parameters could potentially be related to this cause. At the same time, looking at the coil excitation voltages, the lower power input of set-up 1 may mean that the amount of heat generated proportionated a reduced movement of the polymer chains across the weld interface respect to set-up 2 condition. The analysis of the fracture surfaces is being carried out by the authors in order to better understanding to which of the two scenarios the change in mechanical performances is imputable.
It must be considered that for this welding technique, electromagnetic waves travel through the adherents to reach the welding interface and inductive phenomena are quite sensitive to the nature of the substrates such as type of material, thickness and quality. This aspect could explain why lap shear test results present a scatter so high.
The apparent lap shear strength (LSS) is defined as the ultimate load divided by the actual welded area being evaluated on broken specimens through optical microscopy. Set-up 1 (20.6 ±10.7 MPa) and Set-up 1-DEF (21.3 ±4.4 MPa) present similar values having used the same process parameters, meanwhile Set-up 2 (38.2 ±10.8 MPa) presents higher LSSs confirming what was seen in the analysis of the ultimate loads. The comparison among these values must be done with care since basic characteristics of the welds or permanent deformation of the substrates are likely to change the stress scenario at the bondline..
One specimen for each welding configuration was selected to be instrumented with SG and EM and subjected to cyclic fatigue loads. Table 2 shows the cycles to failure for the tested specimens as reference data for the analysis of the subsequent damage sensing results reported in Section 3.2. Further fatigue tests are necessary to effectively establish the dynamic properties for the different manufacturing cases. However, as expected under the same applied load, set-up 1 - DEF has fewer cycles to failure than set-up 1 due to the smaller welded area. What is surprising is the remarkable premature failure of the set-up 2 specimen, most likely due to the fact that the actual LSS is much lower than the average value and therefore the stress state in the bondline is more severe.
| Manufacturing cases | % of static LSS | Applied load level [KN] | Cycles to Failure |
| Set-up 1 | 70%* | 1,93 | 53303 |
| Set-up 2 | 70% | 3,7 | 3049 |
| Set-up 1-DEF | 94% | 1,93 | 33609 |
| * test stopped at 36000 cycles and restarted at 80% LSS | |||
3.2. Damage sensing results
3.2.1. Preliminary assessment of sensing technologies
In the majority of SHM application, changes of a reference signal corresponding to the sound structure are of special interest to detect damage that induces a local variation of a specific property of the material. The following parameter is considered in order to evaluate the sensitivity ( ) to a damage:
|
|
(1) |
where and are, respectively, the induced voltage ofthe reception coil in the presence and absence of a defect.
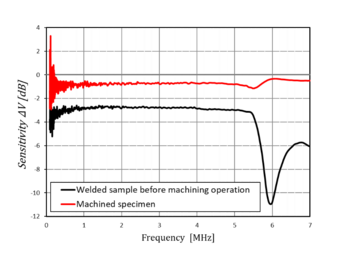
Figure 6 reassumes the preliminary measurements carried out on set-up 1 and set-up 1 DEF weld overlap zone before and after machining operation in order to assess sensor damage sensitivity variation due to the reduction of sample width. Looking at the results before obtaining the specimens, it can be seen that the EM sensor is capable of detecting the lack of solder throughout the entire range of frequencies considered except for very low values where the presence of noise does not make this possible. It is also possible to identify an optimal frequency range and a sensitivity peak around 6 MHz. The same measurement carried out on the other hand once the specimen is obtained in its final size, reveals a strong reduction in defect sensitivity due to the distortion of the induced eddy current in reducing the sample width. A sensitivity peak can still be identified but with a considerable reduction in its intensity.
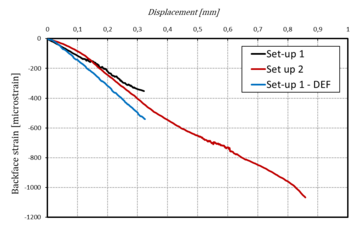
Regarding damage sensing following a back strain monitoring approach, Figure 7 shows the measurements recorded during quasi-static tests by equipping a specimen for each case. The results obtained highlight a compressive stress state in the central joint overlap zone corresponding to the position of the SG. By comparing set-up 1 specimens with and without defect placed in the weld interface, failure occurs at the same imposed displacement but the specimen with defect has a higher stiffness associated with a different distribution of peel and shear stress concentration occurring at the edge of the overlap. In the case of set -up 2 specimens, higher levels of surface deformation are achieved due to the higher stress state that characterizes this case as shown in Table 2.
3.2.2. Damage sensing during fatigue tests
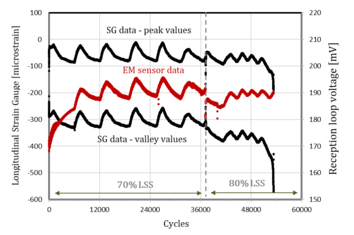
Figure 8 shows SG and EM sensor post-processed signals obtained during the fatigue test carried out on set-up 1 specimen. The SG can detect the approach of the failure condition as visible by observing the signal drift towards the last cycles. The EM sensor signal follows exactly the same oscillatory pattern as the SG signal. In fact, SG is a conducting material where a current passes through which and, when in motion, generates a magnetic field that influences the voltage induced in the EM sensor reception loop. Dedicated further tests are necessary in order to actually be able to make an assessment of the capabilities of the EM sensors. Firstly, the edge effect has to be eliminated by repeating the test with a larger specimen, a configuration that is furthermore closer to the working condition of the sensor during the operational life.
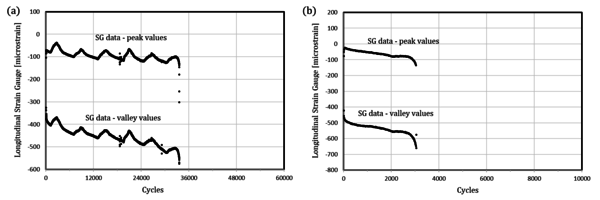
SG signal data also obtained for the other two configurations (Figure 9) corroborate how by monitoring the backstrain it is possible to predict the gradual onset of joint failure at different severities of the stress state in the bondline.
4. Conclusions
This study presented research into the potential use of electromagnetic-based techniques and backstrain joint evaluation for monitoring thermoplastic induction welded joints. Backstrain joint monitoring via SG approach demonstrated the ability to detect joint failure for each of the specimens obtained for different manufacturing configurations. With regard to the use of electromagnetic-based techniques, preliminary evaluations demonstrated good sensitivity in detecting manufacturing defects such as a lack of weld. However, the small specimen size used for the static and fatigue tests did not allow an effective evaluation of the EM sensor's capabilities, which is postponed to subsequent studies using specimen widths that do not incur any edge distortion effects.
Moreover, the results obtained in this research open the way for further analysis by accompanying the considerations previously made with an in-depth study of the fracture mechanics of the tested specimens and further tests that corroborate the conclusions obtained with the aim of achieving a deeper understanding of damage propagation in this type of joint.
References
[1] A. Yousefpour, M. Hojjati, and J. P. Immarigeon, “Fusion bonding/welding of thermoplastic composites,” J. Thermoplast. Compos. Mater., vol. 17, no. 4, pp. 303–341, 2004, doi: 10.1177/0892705704045187.
[2] J. P. Reis, M. de Moura, and S. Samborski, “Thermoplastic composites and their promising applications in joining and repair composites structures: A review,” Materials (Basel)., vol. 13, no. 24, pp. 1–33, 2020, doi: 10.3390/ma13245832.
[3] S. K. Bhudolia, G. Gohel, K. F. Leong, and A. Islam, “Advances in ultrasonicwelding of thermoplastic composites: A review,” Materials (Basel)., vol. 13, no. 6, 2020, doi: 10.3390/ma13061284.
[4] Y. Wang, Z. Rao, S. Liao, and F. Wang, “Ultrasonic welding of fiber reinforced thermoplastic composites: Current understanding and challenges,” Composites Part A: Applied Science and Manufacturing, vol. 149. Elsevier Ltd, 2021, doi: 10.1016/j.compositesa.2021.106578.
[5] X. Xiong et al., “Resistance welding technology of fiber reinforced polymer composites: a review,” Journal of Adhesion Science and Technology, vol. 35, no. 15. Taylor and Francis Ltd., pp. 1593–1619, 2021, doi: 10.1080/01694243.2020.1856514.
[6] T. J. Ahmed, D. Stavrov, H. E. N. Bersee, and A. Beukers, “Induction welding of thermoplastic composites-an overview,” Compos. Part A Appl. Sci. Manuf., vol. 37, no. 10, pp. 1638–1651, 2006, doi: 10.1016/j.compositesa.2005.10.009.
[7] S. Becker, M. Michel, P. Mitschang, and M. Duhovic, “Influence of polymer matrix on the induction heating behavior of CFRPC laminates,” Compos. Part B Eng., vol. 231, 2022, doi: 10.1016/j.compositesb.2021.109561.
[8] L. Moser, P. Mitschang, and A. Schlarb, “Robot based induction welding of thermoplastic polymer composites,” Int. SAMPE Symp. Exhib., vol. 52, Jan. 2008.
[9] P. Ochôa, I. F. Villegas, R. M. Groves, and R. Benedictus, “Experimental assessment of the influence of welding process parameters on Lamb wave transmission across ultrasonically welded thermoplastic composite joints,” Mech. Syst. Signal Process., vol. 99, pp. 197–218, 2018, doi: 10.1016/j.ymssp.2017.06.009.
[10] C. Muir et al., “Damage mechanism identification in composites via machine learning and acoustic emission,” npj Comput. Mater., vol. 7, no. 1, pp. 1–15, 2021, doi: 10.1038/s41524-021-00565-x.
[11] W. S. Na and J. Baek, “A review of the piezoelectric electromechanical impedance based structural health monitoring technique for engineering structures,” Sensors (Switzerland), vol. 18, no. 5, 2018, doi: 10.3390/s18051307.
[12] K. Bednarska et al., “Hybrid fiber optic sensor systems in structural health monitoring in aircraft structures,” Materials (Basel)., vol. 13, no. 10, pp. 1–17, 2020, doi: 10.3390/ma13102249.
[13] M. Z. Sadeghi et al., “Damage detection in adhesively bonded single lap joints by using backface strain: Proposing a new position for backface strain gauges,” Int. J. Adhes. Adhes., vol. 97, no. November, 2020, doi: 10.1016/j.ijadhadh.2019.102494.
[14] J. Weiland, M. Z. Sadeghi, J. V Thomalla, A. Schiebahn, K. U. Schroeder, and U. Reisgen, “International Journal of Adhesion and Adhesives Analysis of back-face strain measurement for adhesively bonded single lap joints using strain gauge , Digital Image Correlation and finite element method,” Int. J. Adhes. Adhes., vol. 97, p. 102491, 2020, doi: 10.1016/j.ijadhadh.2019.102491.
[15] M. Mazzeschi, K. C. Nuñez, E. Cañibano, and J. C. Merino, “Monitoring of thermoplastic induction welding defects. Use of electromagnetic properties as a predictive tool,” Struct. Heal. Monit., vol. 0, no. 2, pp. 1–15, 2022, doi: 10.1177/14759217221111979.
[16] Q. Liu, H. Sun, T. Wang, and X. Qing, “On-site health monitoring of composite bolted joint using built-in distributed eddy current sensor network,” Materials (Basel)., vol. 12, no. 7, 2019, doi: 10.3390/ma12172785.
[17] M. B. Lemistre and D. L. Balageas, “A hybrid electromagnetic acousto-ultrasonic method for SHM of carbon/epoxy structures,” Struct. Heal. Monit., vol. 2, no. 2, pp. 153–160, 2003, doi: 10.1177/1475921703002002007.
Document information
Published on 26/01/24
Accepted on 28/08/23
Submitted on 21/05/23
Volume 08 - COMUNICACIONES MATCOMP21 (2022) Y MATCOMP23 (2023), Issue Núm. 3 - Caracterización - Daño, Fractura y Fatiga, 2024
DOI: 10.23967/r.matcomp.2024.03.13
Licence: Other
Share this document
Keywords
claim authorship
Are you one of the authors of this document?
