1 Introduction
Great importance lies on the development of FO embedded sensors technology due to the fact that the SHM helps to modify the current scheduled aircraft maintenance strategies, by new condition based maintenance strategies able to optimize the necessary resources based on the conditions of the information obtained.
Once a defect or a damage is identified, and with the help of predictive damage tolerance models, the prediction of the remaining useful life in the structure is allowed. This can result in savings in weight, thanks to an optimization of the design of the same structures, as well as costs due to the optimization of maintenance strategies.
Manufacturing trials incorporating different materials and processes have been implemented to assess optical fibre sensors technology embedded in composite materials being part of the structure of typical regional aircraft. Critical parameters have been investigated, such as the curing procedure settings, the set up variables of OoA techniques, or the effects of embedding multiple types of sensors to the quality of the component.
The aim has been to minimize the impact of the embedding process and to define an optimal working path with the perspective of implementing these SHM technologies to higher TRL level environments. The results derived from this research drive the development of the coupons testing matrix and the entire building block approach for experimental validation of the SHM integrated regional aircraft fuselage structure.
2 Optical fibre sensors application to SHM
Within SHERLOC we deal with one particular type of optical fibre based sensors, i.e. fibre Bragg gratings (FBGs), which are one of the most mature fibre sensor technologies [1]. They combine all the advantages of optical fibre sensors with excellent resistance to fatigue at high loads when adequately manufactured and handled, which is also a very important asset in SHM applications. A FBG is created as a periodic modulation of the refractive index in the core of a single-mode optical fibre. It acts as a wavelength selective mirror for light traveling along the fibre and reflects a narrow band of wavelengths centered on the so-called Bragg wavelength λB. This wavelength is defined as:
where ![]() is the effective refractive index of the mode propagating in the fibre and
is the effective refractive index of the mode propagating in the fibre and ![]() is the period of the index modulation.
is the period of the index modulation.
FBG sensors in conventional optical fibres are now widely used for axial strain measurements in many SHM related applications. However, their cross-sensitivity to both thermal and mechanical perturbations requires taking special precautions, and strain measurements should always be corrected for the influence of temperature changes. Furthermore and due to the limited sensitivity of the Bragg wavelength to transverse load, regular FBGs are not ideally suited for carrying out transverse strain measurements. Transverse strain information could nevertheless prove crucial for SHM purposes in composite materials since a relative fragility and substantial residual strain can still exist in the transverse direction along which no reinforcement fibres are aligned.
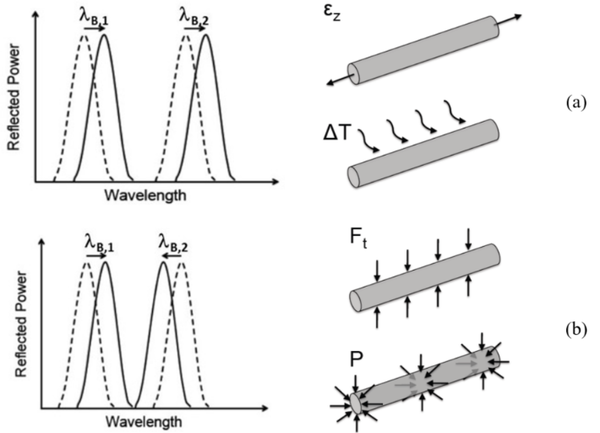
The issues of cross-sensitivity to temperature and relatively low sensitivity to transverse strain can both be dealt with by using Bragg grating sensors fabricated in a micro-structured optical fibre (MOF). A MOF is an optical fibre equipped with a wavelength-scale microstructure which typically consists of air holes running along the entire length of the fibre. We focus on a highly birefringent MOF that has been designed specifically for temperature insensitive pressure or transverse mechanical load sensing and to which we will refer as ‘Butterfly’ MOF [2]. It essentially exploits a differential sensing principle that is illustrated in Figure 1. A FBG fabricated in this MOF reflects two distinctly separated Bragg wavelengths – referred to as λB¸ý+>?1 and λB¸ý+>?2 – i.e. one for each of the two orthogonally polarized modes of light that are guided by the MOF. A mechanical load applied transversally to the fibre is encoded in the spacing Δλ between the two Bragg peaks, with:
The individual Bragg wavelength shifts resulting from mechanical load (in isothermal conditions) can be derived from the total strain field present in the center of the MOF core as:
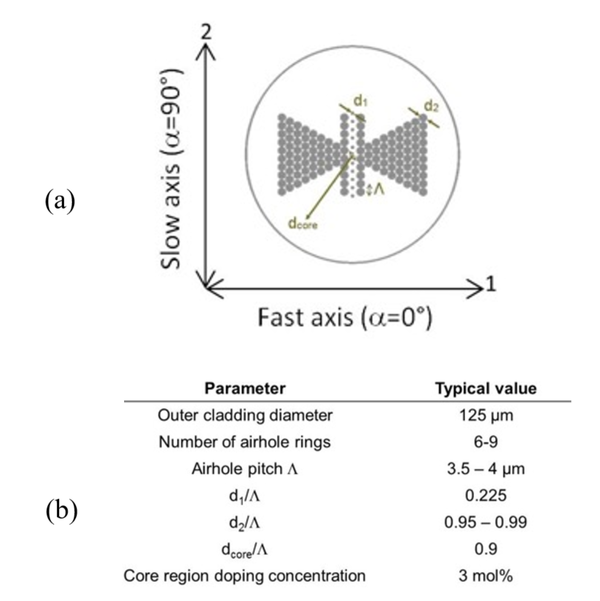
where ε1, ε2, ε3 are the principal strain components along the axes of the coordinate system of the optical fibre (ε3 being the axial strain), and n1 and n2 are the effective refractive indices for the two orthogonally polarized modes, along the fast and slow axis, respectively (see also Figure 2(a)). The above equations clearly show that in the presence of transverse strains ε1 and ε2, the two Bragg wavelengths respond differently.
Figure 1: Simplified illustration of the sensing principle of the butterfly MOFBG. Load applied transversally to the MOF is encoded in the spacing Δλ between the two Bragg peaks. (a) Response of the sensor to temperature changes or axial strain – both peaks move in the same way and Δλ remains unchanged. (b) Response of the sensor to transverse load – the peaks move in opposite direction and Δλ changes. (Adapted from [4]).
The cross-section of the butterfly MOF is shown in Figure 2, together with typical values of the parameters of the microstructure.
Figure 2: (a) Ideal cross-section of the butterfly MOF with indication of the slow and fast axis, or 1- and 2-axis, respectively. The 3-axis corresponds to the axial direction of the fibre. (b) Typical parameter set of the butterfly microstructure.
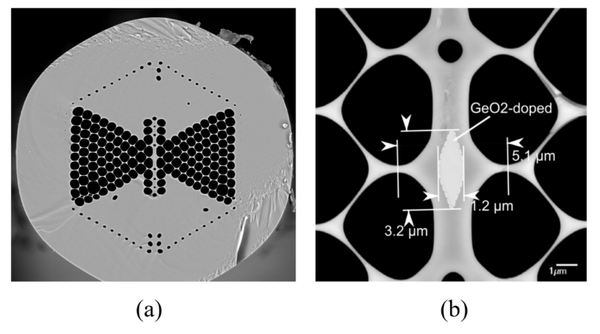
Figure 3: (a) Scanning Electron Microscope photograph of the cross-section of the fabricated butterfly MOF. (b) Close-up of the core region of the MOF with indication of the Ge-doped zone. (Adapted from [4]).
In SHERLOC we will rely on embedded FBG based sensors in such Butterfly MOFs (MOFBGs) [3, 4] alongside commercially available high-strength FBGs, named Draw Tower Gratings (DTGs) from FBGS International. Given the significant difference in these two fibre technologies, one could anticipate that their effect on the mechanical properties of the host composite materials would also be different.
3 Manufacturing process of embedding optical fibre based sensors
To assess the implications raised during the embedding process of MOFBGs, which can provide not only axial but also transverse and shear strains, and Draw Tower Gratings several manufacturing trials were conducted. Different fabrication methods were incorporated in order to investigate not only the behavior and functionality of the optical fibres but also the effect they can impose to the laminate. The objectives defined were related to the manufacturing process in terms that different concerns are taken into consideration during the Autoclave and Liquid Infusion process. The various parameters that can be accounted for potential influence of the optical fibres are the increased level of temperature and pressure that is applied within the curing process in prepreg technology while in LRI, the resin that is injected into the laminate can create possibly drifts to the fibre’s alignment.
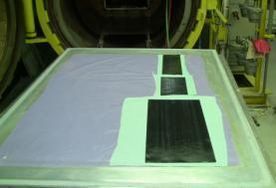
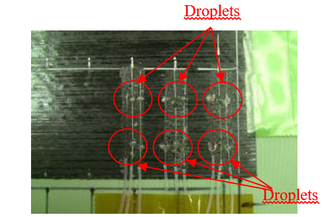
Currently, hand lay-up and infusion techniques are considered as the most popular and applicable manufacturing processes in the aeronautical industry. Manufacturing trials performed within “SHERLOC” project focused on these technologies. The first manufacturing scenario that was explored was the manufacturing of a flat plate utilizing unidirectional prepreg material (M21/194/34%/T800S) embedding 10 acrylate coated Butterfly MOFBGs. The stacking sequence applied was [+45/-45/02/90/0]s and the fibres were installed between the two 0º layers parallel to the reinforcement fibre’s direction. At the egress point (where the optical fibre exits the prepreg layer on the side) the optical fibre was protected with a Φ=1mm teflon tube entering the coupon for ca. 1 cm and continuing along the remaining of the fibre outside of the prepreg lay-up. A UV cured adhesive was used to seal both ends of the tubing to prevent epoxy flowing into the teflon tubing during production. The angular orientation of the Butterfly MOFBGs was marked prior to the embedding with two adhesive droplets on both sides of the grating. The flat sides of these adhesive droplets allow transfer of the MOFBG sensor out of its package and onto the prepreg layer under the desired angular orientation. The objective of this experimental setup was to investigate the survivability of the MOFBGs after the Autoclave manufacturing process.
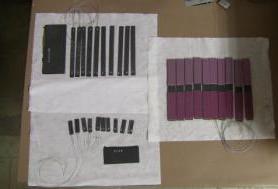
The second trial was implemented installing both dummy and real optical fibres. The aim was to inspect not only the level of connectivity for the optical fibres after the curing process but also the effect of the presence of the embedded OFs to the mechanical properties of the laminate. Therefore compression, ILSS and flexure coupons were manufactured. The scheme specified in this activity regarding the applied optical fibres was that each specimen would carry 3 optical fibres (2 acrylate coated MOFs and 1 Ormocer coated PM-DTG). Furthermore, in order to take into account the worst case scenario as far as the development of micro-cracks and delaminations are concerned the OFs were inserted transversally to the direction of the fibres. The same approach with the orientation of the MOFBGs was exercised, applying two adhesive droplets for identifying the angularity of the “butterfly”.
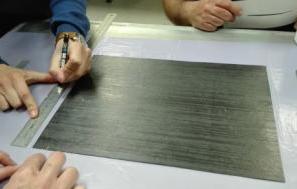
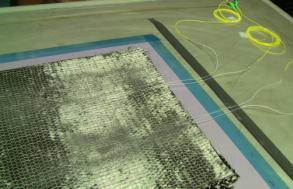
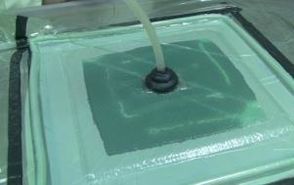
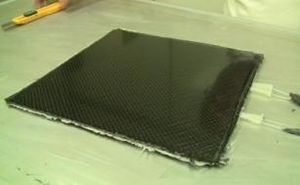
The final trial that was performed for the investigation of optical fibres’ performance regarded the conduction of a Liquid Infused plate. The objective of this exercise was to evaluate whether the impetus of the resin flow could drift away the optical fibres. For this experiment a plate of 300mm x 300mm was fabricated and 4 acrylate coated MOFBGs were inserted into the laminate. Carbon unidirectional fabrics (type: Saertex V90838-00280, Fibre Weight: 250g/m2, Total Weight: 282gr/m2) were cut in the respective dimensions and Huntsman LY5138 resin with HY5138 hardener (weight ratio 100:23) was selected for the infusion. The stacking sequence applied was [+45/90/-45/0/+45/02/-45]s and the optical fibres were placed between 6th and 7th ply parallel to the fabrics fibres.
4 Experimental evaluation
During the development of the testing plan, variables such as the limitations of the OFs embedding techniques, the degree of their applicability to the different aircraft structural components and the restrictions of the various SHM approaches in relation to the manufacturing processes were taken into account. The objective was to set up an efficient and dedicated test campaign that would provide fruitful results for the mechanical performance of the material with embedded sensors the results would also serve the optimization of the manufacturing roadmap for elements and the subcomponents that will follow this investigation in upper levels of the building block approach.
Along with the mechanical tests which determined the feasibility of sensors embedding into the structural material, NDI techniques were conducted for acquiring a more qualitative point of view for the manufactured components. The reconnection yield after curing of the composite material could be also evaluated in the cases where real (not dummy) sensors were installed. The mechanical performance outcomes provide the necessary inputs for the definition of the structural health monitoring system manufacturability and design, the number of coupons required for the evaluation of the installation methods and the improvement of the damage detection approaches.
4.1 Tests configuration & performance:
4.1.1 Tests procedures:
Test procedures have been selected, interlaminar shear strength (ILSS), flexure and compression tests, with the purpose of evaluating the worst case scenario for mechanical performance and sensor integrity.
The mechanical tests were performed following the main parameters of the following test methods: Interlaminar Shear Strength (ILSS): ASTM D2344/D2344M [5]; Flexure test: ASTM D7264/D7264M [6]; Compression prEN 6036_P1(12.1995). [7] Calculus for determining interlaminar shear, flexure and compression strengths have been performed according to the evaluation formulae appearing in these reference standards.
ILSS test procedure determines the short-beam strength of high-modulus fibre-reinforced composite materials. The specimen is a short beam machined from a flat laminate. The beam is loaded in three-point bending. [5]
Flexure tests: Test method used determines the flexural stiffness and strength properties of polymer matrix composites. Procedure selected is procedure B-A: four-point loading system utilizing two load points equally spaced from their adjacent support points, with a distance between load points of one-half of the support span. [6]
Compression tests: Determine the compression strength and modulus of un-notched composite laminates with unidirectional layers or woven fabric reinforcement materials.[7]
To check sensors connectivity after dynamic loading of the material containing embedded FO, one fatigue test has been performed per specimens’ type. Dynamic loading application followed a sinewave form, ratio between maximum minimum loads applied R=0,1, load control at frequencies not higher than 3Hz in order to avoid undesired heating. The loading profile was defined according to a % of the strength obtained from the different static tests.
4.1.2 Environmental conditions
Tests are performed at Room Temperature (RT) conditions, ambient laboratory conditions with an as-fabricated moisture content. These conditions are defined as 23± 3ºC temperature and 50±5% relative humidity.
4.1.3 Specimens’ geometries
Specimens’ configuration presented some restrictions in terms of stacking sequence which was related to a representative lay-up of the real operational structure and geometry constrains due to sensors location. These deviations resulted in some geometrical differences to the reference geometry according to selected standards. Tabs were necessary to be bonded only to the compression coupons.
| Test designation | Nominal Length (mm) | Nominal Width (mm) | Nominal Thickness (mm) |
| ILSS | 40.0 | 12.0 | 2.2 |
| Flexure | 105.6 | 13.0 | 2.2 |
| Compression | 182.0 | 22.0 | 2.2 |
4.1.4 Tests set-up & apparatus
Different calibrated universal static and dynamic testing machines with a range of load levels up to 250kN and 100mm displacement crosshead capacity, operated at a constant rate of crosshead motion for static and sinewave load amplitude for dynamic loading. Measurement of force was recorded using load cells integrated on the universal test machines used, while measurement of displacement was recorded by means of universal test machine linear voltage displacement sensors and external LVDT sensors. It must be highlighted that for strain measurements at compression, the alignment of the loading is critical.
With the purpose of checking this alignment, back to back strain gauges were installed on compression specimens. This allows the checking for out of plane deformations of the coupon during compression testing. Bending is observed by the difference between strains on each face of the test specimen. Equation 5 shows the followed criterium for Percent Bending Strain. The difference between strains on each face of the specimen in the load range of 10-90% of failure load must remain such that Percent Bending Strain (PBS) is less than 10% so failure mode is considered valid.
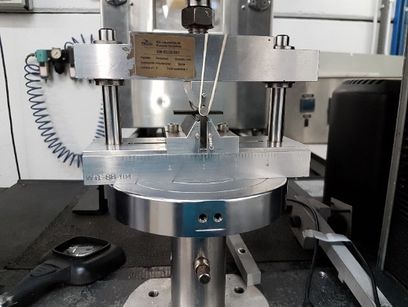
Interlaminar shear strength test set-up: the short-beam test specimens are center-loaded, resting on two supports that allow lateral motion and loaded by means of a loading nose directly on the midpoint of the specimen. ILSS test loading Nose and Supports, as recommended by ASTM D2344 [5], were 6.00 and 3.00 mm diameter cylinders, respectively, with finely ground surfaces free of indentation and burrs with all sharp edges relieved.
Span length-to-specimen thickness ratio used was 4 as recommended by [5], for specimens which are compliant with the minimum thickness requirement of 2.0mm.
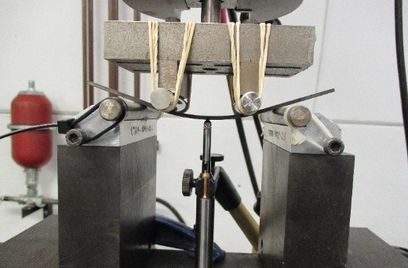
Flexure test set-up: A bar of rectangular cross section, supported as a beam is deflected at constant rate resting on two cylindrical (radii = 5mm) contact surfaces acting as supports and loaded in two points at equal distance from the adjacent support point.[6]
Due to the stacking sequence used, specimen geometry differs from standard flexure specimen according to [6], where is defined that the specimens’ length, load and support span depends on specimen thickness. Span to thickness ratio selected for flexure test according to the specimen geometrical configuration, was 20:1.
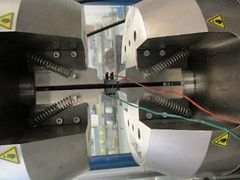
Compression test set-up: Single Compressive load was applied to specimens at flat rate displacement according to ref. [7]. Particularly for these specimens’ geometrical configuration, a buckling risk exists, when testing at compression. In order to avoid potential buckling, anti-buckling device was incorporated to the test set-up as seen in Figure 11.
4.2 Experimental results and discussion:
4.2.1 Mechanical performance evaluation for autoclave curing process (Thermosetting material):
For each experiment three types of coupons have been fabricated: 1. pristine coupons (with no embedded optical fibre sensors) taken as a baseline. 2. Coupons with “dummy” sensors (acrylate coated MOFs without Bragg gratings and Ormocer-coated fibre without Draw Tower Gratings), to assess the laminate properties due to the presence of the optical fibres and the alignment droplets. 3. Coupons with “real” optical fibre sensors, for data interrogation and measurements collection.
The number of specimens for each test was decided as follows: 5 pristine ones, 3 coupons of them with “dummy” fibres and 2 coupons with “real” ones. One coupon have been separately studied under dynamic loading testing for mechanical fatigue and sensor connectivity monitoring. Teflon tubing used over the optical fibres for this manufacturing trial was smaller (0.6mm) than in first trial.
Compression strength results: Testing of pristine and optical fibre coupons outcomes show accurate results with coefficient of variation lower than 6% in maximum strength, and lower than 3% in compression modulus for both series. Also, percentage bending strain is always lower than 2%. Failure modes were valid at all cases.
| Test series designation | Pmax (kN) | Comp. Strength (MPa) | Ec (GPa) |
| Pristine coupons | -24,67 | 491.14 | 36.18 |
| Optical fibre | -21.84 | 430.51 | 37.18 |
| % Difference | 11.5% | 12.3% | 2.7% |
During fatigue test, with 65% static test average strength and ratio between maximum minimum loads applied of R = 0.1, the coupon failed at the cycle number 2762, with a displacement increase of 0.003mm.
Flexure strength results: Test results for showed coefficient of variation for flexure strength lower than 2% for pristine specimens and 6,3% for spceimens with optical fibre installed. Valid failure modes were produced at all cases on the tension side of the specimens.
| Test series designation | Pmax (kN) | Displ.max (mm) | Flexure Strength (MPa) |
| Pristine coupons | -0.44 | 19.43 | 940.8 |
| Optical fibre | -0.40 | 18.67 | 884.2 |
| % Difference | 9.0% | 3.9% | 6.0% |
During fatigue test, with 75% static test average strength and R=0.1, the coupon failed at the cycle number 2943, with a displacement increase of 0.922mm
Interlaminar shear strength results: Results Show a coefficient of variation of 5,6% for pristime coupons results and 7,4% for specimens with embedded optical fibres. This variability in results is slightly higher than for the rest of the tests conducted and it can be attributed to the increased difficulty for perfect alingment of specimens of reduced dimensions. Results are still comparable with a controlled degree of uncertainty.
| Test series designation | Pmax (N) | Displ.max (mm) | ILS Strength (MPa) |
| Pristine coupons | 1795.7 | 0.52 | 53.13 |
| Optical fibre | 1582.2 | 0.48 | 44.01 |
| % Difference | 11.9% | 7.7% | 17.2% |
During fatigue test, with 70% static test average strength and R = 0.1, the coupon failed at the cycle number 4308, with a displacement increase of 0.075mm.
4.2.2 Mechanical performance evaluation for Liquid Resin Infusion process:
After thorough examination of the mechanical performance evaluation of autoclave process results and the data provided from the experiments, the necessity of investigating the two types of optical sensors (MOFs and PM-DTGs) as individual systems was obvious. It was decided to incorporate additional tests in order to determine the TRL level of the optical fibres network’s embedding capability.
The mechanical performance evaluation for Liquid Resin Infusion process had as an objective to assess the MOFs and PM-DTGs separately taking also into account the orientation of the OFs to the direction of the CFRP fibres. Thus, four different test series were conducted for each test type (compression, flexure and ILSS): Pristine specimens, MOF 01, MOF 02, and PM-DTGs.
Compression strength results: Tests showed similar results in general with a coefficient of variation under 7,2% for compression strength, under 4% for compression modulus and a percentage bending strain under 5% for the four series, excepting a particular coupon showing PBS>10% which was not taken into consideration for results evaluation. Failure modes were valid at all cases.
| Test series designation | Pmax (kN) | Displ.max (mm) | Ec
(GPa) |
Compression Strength (MPa) |
| Pristine coupons | -33.63 | -0.80 | 88.85 | 680.75 |
| MOF 01 | -28.58 | -0.82 | 88.79 | 590.05 |
| MOF 02 | -36.42 | -1.25 | 88.10 | 778.31 |
| PM-DTGs | -35.78 | -1.06 | 90.02 | 736.62 |
Fatigue tests have been performed at Pmax equals to 65% static test average strength and R=0.1 during 40000 cycles. Then raised to Pmax = 70% static test average strength for another 30000 and finally tested during another 30000 cycles at Pmax = 75% of static test average strength. Results are that pristine coupon fatigue test has resisted around 20000 cycles at 65% up to failure and the rest of the compression fatigue coupons have resisted 100000 cycles at the different loads stated above without collapsing.
Flexure strength results: Results for the four test series showed similar values, with a coefficient of variation in flexure strength always below 3,5%. Failure modes were always produced in the tension side of the specimen thickness.
| Test series designation | Pmax (kN) | Displ.max (mm) | Flexure Strength (MPa) |
| Pristine coupons | -1.06 | 17.04 | 2264.82 |
| MOF 01 | -0.93 | 18.95 | 2079.69 |
| MOF 02 | -0.94 | 18.90 | 2142.23 |
| PM-DTGs | -0.99 | 18.69 | 2116.75 |
Fatigue tests have been performed at 75% static test average strength and R = 0.1, Cycles resisted up to failure for the different coupons are the following: Pristine coupon – 4000. MOF01 – 3600 MOF02 - 3050. ORM-DTG – 9300.
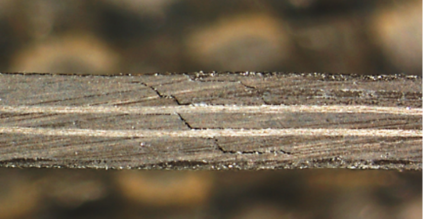
Interlaminar shear strength results: Test results showed low variability, with a coefficient of variation under 3,0% for all test series. Micrographs were conducted on specimens to check failure mode of all specimens was interlaminar.
| Test series designation | Pmax (kN) | Displ.max (mm) | ILS Strength (MPa) |
| Pristine coupons | 2105.5 | 0.65 | 60.08 |
| MOF 01 | 2121.7 | 0.61 | 60.98 |
| MOF 02 | 2082.6 | 0.61 | 60.31 |
| PM-DTGs | 2555.6 | 0.67 | 73.91 |
Fatigue tests have been performed at 70% static test average strength and R = 0.1, Cycles resisted up to failure for the different coupons are the following: Pristine coupon – 11250. MOF01 – 5800 MOF02 - 7350. ORM-DTG – 11950.
5 Conclusions
Mechanical performance evaluation for autoclave process using thermosetting material show that, mechanical properties degradation of the material with embedded sensors can be clearly identified when comparing test results between pristine & embedded FO test series. The higher degradation identified is around 17% decrement at interlaminar shear strength.
At the final stage of the manufacturing trials performed, when evaluating mechanical performance for liquid resin infusion, some results show higher strength values for specimens with embedded sensors. Due to the reduced samples studied, this difference can be attributed to inherent variability in results. It can be concluded that the degradation of the mechanical performance is lower when using LRI manufacturing process than when using autoclave process.
Looking at fatigue results, no significant decrement of mechanical fatigue can be extracted. Particularly for fatigue compression tests, pristine coupon collapsed at 20k cycles while specimens with embedded sensors withstanded 100k cycles at various load levels, this occurrence is due to an invalid failure mode of the pristine coupon which does not affect the conclusions for this study, considering the evidence that embedding sensors show a good performance in mechanical fatigue behavior. Nevertheless, further investigation will follow this study with a complete test campaign of specimens with embedded FO sensors under the scope of SHERLOC project.
Reconnection of real sensors embedded in material manufactured with autoclave process, succeed 100% for DTGs sensors while not all MOFGs sensors could be reconnected after manufacturing and mechanical testing. All reconnections attempts after dynamic loading succeed. It is evident that increased level of temperature and pressure is applied within the autoclave curing process in prepreg technology. The optical fibres experience much higher compressive strains in this case. Together with the results of the DTGs, this could point to the existence of the adhesive droplets and/or the density of fibres as a main cause for the experienced spectral deformations and low yield for the optical reconnections.
All these factors contributed to the specification of multiple variables such as the development of the SHM network, the system’s features characterization, the installation methodology utilized (embedded or surface mounted) or the selection of the sensors in combination with the manufacturing technology.
Resulting, smart structures design and manufacturing at coupon, element and sub-component level, will follow the guidelines obtained from the performed manufacturing trials.
Acknowledgments
The authors wish to thank the research leading to these results has gratefully received funding from the European JTI-CleanSky2 program under the Grant Agreement n◦ 314768 (SHERLOC). T. Geernaert is post-doctoral research fellow of Research Foundation – Flanders (FWO). The authors also would also like to acknowledge financial support from the Methusalem and Hercules Foundations.
References
[1] Othonos, A. and Kalli, K. Fiber Bragg Gratings: Fundamentals and Applications in Telecommunications and Sensing. New York: Artech House. (1999)
[2] Martynkien, T., Statkiewicz-Barabach, G., Olszewski, J., Wojcik, J., Mergo, P., Geernaert, T., Sonnenfeld, C., Anuskiewicz, A., Szczurowski, M.K., Tarnowski, K., Makara, M., Skorupski, K., Klimek, J., Poturaj, K., Urbanczyk, W., Nasilowski, T., Berghmans, F. and Thienpont, H. Highly birefringent microstructured fibers with enhanced sensitivity to hydrostatic pressure. Optics Express, 17(14), pp. 15113-15121. (2010)
[3] Berghmans, F., Geernaert, T., Sonnenfeld, C., Sulejmani, S., Luyckx, G., Lammens, N., Degrieck, J., Chah, K. and Thienpont, H. Microstructured optical fibre Bragg grating sensors for structural health monitoring applications. In: Proceedings of the 7th European Workshop on Structural Health Monitoring. Nantes, France, 8-11 July 2014. Rennes: Inria. pp. 962-969. (2014)
[4] C. Sonnenfeld, G. Luyckx, S. Sulejmani, T. Geernaert, S. Eve, M. Gomina, K. Chah, P. Mergo, W. Urbanczyk, H. Thienpont, J. Degrieck, F. Berghmans, “Microstructured optical fiber Bragg grating as an internal three-dimensional strain sensor for composite laminates”, Smart Mater. Struct., Vol. 24, pp. 055003 (2015).
[5] ASTM D2344/D2344M; Standard Test Method for Short-Beam Strength of Polymer Matrix composite Materials and Their Laminates (2013)
[6] ASTM D7264/D7264M: Standard Test Method for Flexural Properties of Polymer Matrix Composite Materials. (2015)
[7] prEN 6036_P1: Aerospace series Fibre reinforced plastics Test method Determination of notched, unnotched and filled hole compression strength. (12.1995)
Document information
Published on 14/10/18
Accepted on 14/10/18
Submitted on 14/10/18
Volume 02 - Comunicaciones Matcomp17 (2018), Issue Núm. 4 - Comportamiento en servicio de los materiales compuestos (2), 2018
DOI: 10.23967/r.matcomp.2018.10.006
Licence: Other
Share this document
Keywords
claim authorship
Are you one of the authors of this document?


