1 Introduction
1.1 Historic aspect of fiber reinforced concrete
Cement mortars and concrete are the most common material for building. However, their toughness, ductility, and flexural resistance are too low while the rupture is usually achieved in so short time that it is normally qualified as instantaneous. In the last few years, an increase in interest has been ascribed to emerging techniques that are promising as able to reinforce cement composites with specific fibers for the building industry. However, scarce is the research work focusing on reinforcing concrete for enlarging amortization time following the instant rupture.
The 19-FRC Committee (FIBER REINFORCED CEMENT COMPOSITES) was constituted in September 1972 and initiated the International Union of Laboratories and Experts in Construction Materials, Systems and Structures (RILEM) 1975 Symposium in London on Fiber Cement and Fiber Concrete. The related extensive research works need combining the modern definition of synthetical materials with the new development of industrial building ways. Continuous series of workshops were spaced three to four years apart, in the foreseeable future. The Seventh International RILEM Workshop on High-Performance Fiber Reinforced Cement Composites (HPFRCC7) was held in Stuttgart, Germany – June 1-3, 2015. It dealt with composites able to exhibit a strain hardening tensile. Multiple cracking (and relatively large energy absorption capacity) with “high performing” workability, durability and robustness normally accompanies the stress-strain response. In this seventh workshop, the impact of cyclic and/or seismic loading was identified by organizers as one of the themes for which research information is needed.
Recently, the 4th International RILEM Conference, which was held at the Technische Universität Dresden, Germany, from September 18 to 20, 2017, had concerned Strain-Hardening Cement-Based Composites (SHCC4). It focused on advanced fiber-reinforced concrete materials such as high-performance fiber-reinforced cement-based composites (HPFRCC). Today HPFRCC can be designed with as little as 1% fiber volume content. The 4th International RILEM Conference deals with the use of such types of fiber-reinforced concrete in strengthening and repair as well as in other practical applications. The fourth “International Symposium on Ultra-High-Performance Fiber-Reinforced Concrete, UHPFRC” held on October 2-4, 2017, in Montpellier (France) dealt with the “SEISMIC DESIGN AND PERFORMANCE OF ULTRA-HIGH-PERFORMANCE CONCRETE BRIDGE BENTS”.
The post cracking toughness resulting in multiple cracking formations is the major advantage of fiber reinforcement in building and may allow their more intensive use [1]. The fibers bridge the matrix cracks and transfer the loads after cracking has started [2,3]. The main function of fibers is to control crack propagation and crack widening after the matrix has cracked and cannot impede the formation of cracks. The mechanical properties of FRC are, as such, little influenced by the presence of fibers. The far significant technical and economic advantages are a well-defined and insurable resistance to crack propagation and post-cracking behavior; This is to justify the use of FRC than any strength behavior.
Many studies have investigated the performance of synthetic fiber fabric reinforced cement composites [4-8]. However, initial processing costs, recyclability, energy consumption, machine abrasion and the increasing global consciousness related to the adverse effect of synthetic materials on the environment have motivated extensive research on environmentally friendly and healthy materials based on natural resources materials. In this sense, natural renewable vegetable fibers including ramie, jute, Grewia optiva, Hibiscus sabdariffa, flax, hemp (bast fibers), sisal, and abaca (leaf fibers) [9–14], cotton (seed hairs) [15] have become the focus of increased interest as a substitute for traditional reinforcing fibers such as steel, glass and carbon as reinforcements for cement mortar composites [16–18]. Currently, building applications present 75% of the North American market of natural fibers.
1.2 Why and how to use natural fiber to produce FRC
Some advantages of natural fibers can be given as wide availability, low density/lightweight, inexpensive (less the 1/3 of the cost of glass fiber), high toughness, especially ductility when dynamic loads are present [19], a high flexural capacity [20,21], crack resistance, low health hazards, enhanced energy recovery, CO2 neutrality, renewable resource, recyclable and non-abrasive to process equipment [22-25]. Their specific strength which is normalized by weight can be close to that of glass fibers [26]. Their morphology (diameter, aspect ratio, length, roughness) can be easily adapted to different purposes.
The performance of a composite notably depends on the amount and length of the fibers which vary with the nature of the plant fibers and the composite fabrication method [27,28].
1.2.1 Treatment, extraction and purification
Despite the aforementioned advantages, some drawbacks still need to be studied and solved to allow widespread development of plant fiber cement reinforcements. The most important constraint is the hydrophilic nature of the fibers due to the presence of hydrophilic hydroxyl groups on the surface of cellulosic fibers, which causes swelling and plasticizing effects of the fibers and affects the long-term durability of plants fibers reinforced alkaline medium of cement-based composites [29,30]. Alkali attack, fiber mineralization due to the migration of hydration products to lumens, and space and volume variation due to their high-water absorption [31–34] cause the material to have a reduction in post-cracking strength and toughness, therefore full commercial potential is not achieved [35-38]. Various chemical methods, such as alkalization, benzoylation and acetylation are available for the modification of plant fiber surface or to modify the composition of the matrix in order to remove or reduce the alkaline compounds such as a pozzolanic matrix.
The addition of aqueous sodium hydroxide (NaOH) to the natural fiber, promotes the ionization of the hydroxyl group to the alkoxide [39]. Furthermore, the alkaline treatment causes changes in crystallinity, which leads to better backing of cellulose chains [40]. The alkaline treatment causes disruption of the hydrogen bonding in the network structure, thereby rising surface roughness, which results in better mechanical interlocking. Moreover, it removes a certain amount of lignin, wax, and oil on the surface of the fiber cell wall. These changes in physical and mechanical properties of natural fibers considerably depend on a number of factors such as the concentration of the alkali solution, soaking time, and temperature [41].
Fiber length, distribution, and concentration then become the most critical parameters that can make or break the FRC as a construction material with crack control properties, and these two factors depend on the placement and compaction. The geometry of the structure will ultimately dictate the FRC composition that will provide the properties for which the fiber reinforcement is designed.
1.2.2 Uses of natural fibers in building sector
Natural fibers can be used to reinforce cementitious materials in several forms, such as short-randomly oriented, pulp and long aligned fibers (uni or bi-directional fabrics). Savastano et al. (2001) [42] used pine trees and sisal pulps to reinforce ordinary Portland cement and blast furnace slag matrices and evaluated their mechanical properties by means of three-point bending test. More studies are required in order to optimize the performance of cellulose fabric reinforced cement composites.
This review document presents the summary of 500 recently published comprehensive papers done until 2017. These articles have concerned plant natural fiber reinforced cement and concrete, focusing on the impacts of plant types and sources of plant-fibers, as well as the processing ways and conditions, on the mechanical behavior and/or modification of the fiber-reinforced concretes with cement, mortar, and fibers. It also focuses on recent developments and applications in earthquake engineering and seismic rehabilitation. This paper does not include natural fibers from animal (e.g., silk or wool), or cellulosic cotton or artificial fibers and excludes wood fibers.
1.2.3 Fibers as reinforcement means within mortar
Some authors have proposed plant-based natural fibers to replace steel. This use was projected to be limited to developing countries. Such uses are, from our point of view, too dangerous and inadequate with the real safety needs in the building. Our proposal in the present project is to “add” (and not replace) and insert the natural fibers to the cement possibly steel-reinforced. This last maintains assuring resistance security. The presence of fibers aims at reaching a great amortization of instant/intense mechanical solicitation energy issued from, as for an example, seismic perturbation. The nature, size, concentration, and surface interaction with these fibers should be perfectly defined with the objective of reaching the most extended amortization time. The main part of our research work within the present project deals with the definition of “how to insert natural fibers within mortar with this seismic resistance objective”.
1.3 Earthquake engineering and Seismic retrofitting
The discontinuous phase is usually harder and stronger than the continuous phase and is called the reinforcement ‘or reinforcing material ‘, whereas the continuous phase is termed as the matrix.
Further, the need of composite for lighter construction materials and more seismic resistant structures has placed a high emphasis on the use of new and advanced materials that not only decreases dead weight but also absorbs the shock & vibration through tailored microstructures. A good matrix should possess the ability to deform easily under applied load, transfer the load onto the fibers and evenly distributive stress concentration. Nowadays, the use of composites columns, especially concrete wrapped with FRPs, has gained popularity in high-rise buildings and high seismic risk regions due to the high strength-to-weight ratio and increased deformability [43].
Damage after an earthquake interferes with evacuation, emergency response, and post-earthquake recovery. There are two ways to improve seismic capacity. One is to reduce the earthquake force and the other is to upgrade the existing building to resist the earthquake load. There are also two ways to upgrade the existing building. One is to change the structural system or to change the load paths to reduce the load to the specific element, and the other is to upgrade the individual element strength.
It is easier to improve the earthquake resistance of new buildings than to upgrade existing ones. The first part discusses the strengthening earthquake resistance of new building (Earthquake engineering). Moreover, earthquake protection requires consideration of how to upgrade and strengthen existing buildings at modest cost. The last part discusses the post-earthquake repair of existing buildings (seismic retrofitting).
The primary solution for achieving enhanced sustainable utilization of infrastructural units is basically by strengthening these units prior to their failures. Strengthening building components with suitable materials results in optimum productivity of constructional units, thus enhancing the life period of structures, and also enabling the structural component to perform better under bending, shear, torsion, and buckling, etc. Research reveals that fiber reinforced polymer (FRP) strengthening techniques have various advantages and leads to optimizing the engineering capabilities of structural units to their maximum limits, without resulting in any failures and also leads to an enhancement in the design life of the structural components [44-53]. Sustainable structural strengthening solutions for reinforced concrete appears to be the most promising solution to ensure sustainability in the construction industry since reinforced cement concrete is the primary constructional material used all over the world.
Buildings may be subjected to large axial stresses as well as severe earthquake loading. To protect the integrity of these buildings, concrete columns must possess high compressive strength and adequate ductility.
The strength and ductility are essential closely interrelated properties for earthquake-resistant structures material requirements. Structures can survive short-term accidental overloads if they were made-up from ductile materials because, instead of simply breaking, they can absorb a large amount of energy and deform without losing strength during the overload. Concrete and all types of masonry, without reinforcement, are brittle materials. Steel is very suitable for building earthquake areas for its inherently strong and ductile material but light (i.e. have a high strength-to-weight ratio).
1.4 The project Kreative Habitat
The works detailed in this paper were carried out within Kreative habitat research project, aiming at developing ductile solutions of Fiber-Reinforced Concrete (FRC) structures for earthquake engineering and retrofitting applications, where natural fibers extracted by a new process DIC-Organosolv can be fruitfully applied, which often relies on the safe accounting for contribution of reinforcing natural fibers to structural ductility and improve the time of flexion.
2 Material and methods
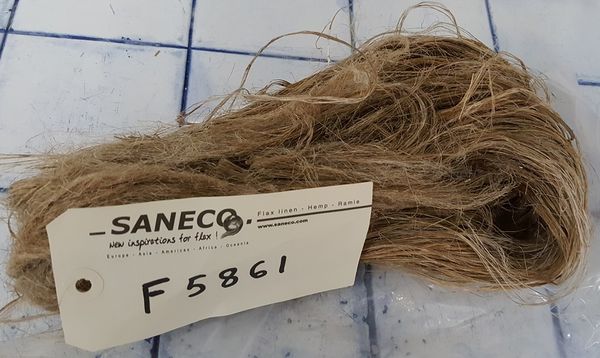
The objective of the work was to study the mechanical impact of incorporating natural fibers into building mortar specimens. In some preliminary research works and studies, the most usual fiber we used was flax fiber, supplied by Saneco. The figure (1) presents these flax fibers.
2.1 First experimental design
In this mechanical testing activities, we selected 2 processing parameters: the length and concentration of these fibers in the mortar. A specific central, rotatable, 2-factor, 5-level Design of Experiments DoE, including factorial repartition, star, and central points was defined. Such a design of experiment allows getting the widest possible study field, limiting the number of tests, and well-defining and identifying the impacts of each operating factor. The table (1) shows the coded and real values of each of the 5 levels.
| Code values | -α | -1 | 0 | +1 | +α |
| Length (cm) = A | 2 | 4 | 9 | 14 | 16 |
| Concentration per layer g/(4*16 cm2) = B | 1.60 | 1.83 | 2.40 | 2.97 | 3.20 |
We used the statistical analysis software, StatGraphics, to precise us the tests to perform. The table (2) indicates the various trials: the different combinations of length and concentration achieved. In this first experimental design, we preferred a specific, well-located fibers. So, the fibers were positioned in the center of the mold and over the entire width.
| Trial Number | CPP | 2 | 3 | 5 | 6 | 8 | 9 |
| A (cm) | 9 (0) | 16 (+α) | 9 (0) | 14 (+1) | 14 (+1) | 4
(-1) |
4
(-1) |
| B g/(cm2) | 2.40 (0) | 2.40 (0) | 3.20 (+α) | 2.97 (+1) | 1.83 (-1) | 1.83 (-1) | 2.97 (+1) |
| Trial Number | 11 | 12 | 14 | 15 | 16 | 17 | 18 |
| A (cm) | 2 (-α) | 9 (0) | 16 (+α) | 16 (+α) | 2 (-α) | 2 (-α) | 16 (+α) |
| B g/(cm2) | 2.40 (0) | 1.60 (-α) | 3.20 (+α) | 1.60 (-α) | 3.20 (+α) | 1.60 (-α) | 2.40 (0) |
The trials 1 to 13, and 14 to 18 as factorial-points and additional-star experimental points, respectively, were StatGraphically analyzed.
Each sample was manufactured according to the following protocol: a 1st 1-cm mortar layer, a fiber layer, a 2nd 2-cm mortar layer, a second layer of fiber, another 3rd 1-cm mortar layer.
After each layer of mortar, the mold was vibrated for a few seconds to have a uniform deposit. Three 40 × 40 × 160 mm3 samples were casted with each batch using a three-gang mold. The molds were manually filled in two fiber layers. The protocol was carried out here-after: After the last layer of mortar, the whole is vibrated a few seconds then the surface is smoothed manually. Samples were stored in high relative humidity sealed plastic bags to maintain endogenous conditions for 24 h before demolding. The specimens were then cured in a water (relative humidity = 100 %) for 28 days. We obtained 21 samples: n°1 to 13 were the experimental design points, n° 14 to 18 were experimental design supplementary points, and n°19, 20 and 21 were mortar without fibers.
2.2 The second experimental design
After the analyze of the first result, we selected a random localization of the fibers. We also adopted the fiber length and the concentration per sample, and not the concentration per layer). The table (3) shows the coded and new real values of each of the 5 levels.
| Code values | -α | -1 | 0 | +1 | +α |
| Length (cm) = A | 2 | 4 | 9 | 14 | 16 |
| Concentration per sample g/(cm3) = B | 0.04 | 0.09 | 0.20 | 0.31 | 0.36 |
The table (4) indicates the various trials: the different combinations of length and concentration achieved. In the last column, we placed a picture of the manufacture of the concerned sample.
| Trial Number | 1 | 2 | 3 | 4 | 5 | 6 | 7 |
| A (cm) | 6
(0) |
10 (+α) | 6
(0) |
6 (0) |
9 (+1) | 9 (+1) | 6 (0) |
| B g/(cm3) | 0.20 (0) | 0.20 (0) | 0.36 (+α) | 0.20 (0) | 0.31 (+1) | 0.09 (-1) | 0.20 (0) |
| Trial Number | 8 | 9 | 10 | 11 | 12 | 13 | 14 |
| A (cm) | 3 (-1) |
3 (-1) |
6 (0) |
2 (-α) |
6 (0) |
6 (0) |
6 (0) |
| B g/(cm3) | 0.09 (-1) | 0.31 (+1) | 0.20 (0) | 0.20 (0) | 0.04 (-α) | 0.20 (0) | 0.20 (0) |
Each sample was manufactured according to the following protocol. The mortar was prepared following the same composition as the first DoE. Then, the quantity of fibers was incorporated into the mortar. These quantities were indicated by the DoE. The samples triplicated in 40×40×160 mm3 size, were casted with each batch using a three-gang mold.
Once the mold was mortar filled, the system was vibrated a few seconds and the surface was manually smoothed. Samples were stored in high relative humidity sealed plastic bags to maintain endogenous conditions for 24 h before demolding. The specimens were then cured in water (relative humidity = 100 %) for 28 days. 17 samples were studied: n°1 to 13 were issued from the factorial, star, and central DoE points, and n° 14 was extended DoE trial, while trials n°15, 16, and 17 were the free-fiber mortars.
2.3 The final tests
To simulate the earthquake, we decided to perform a structure of the wall, we build a specific mold. The length was 28 cm and the width 25 cm. In the middle, we put a piece of wood to “draw” a window. The thickness of the walls was about 2 cm.
2.4 Assessments of samples
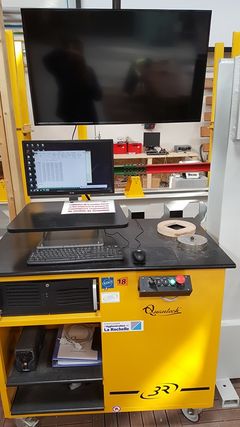
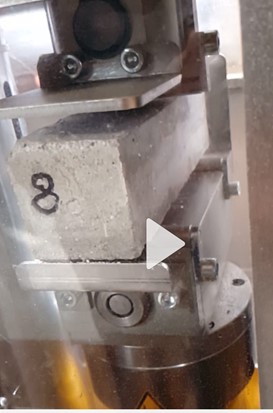
The reinforced and conventional mortar specimens were kept and soaked in water for 28 days. Afterward, we performed a series of 3-point Flexure Tests. For first and the second DoE, the followed equipment was used to perform these bending tests (Figure (4)):
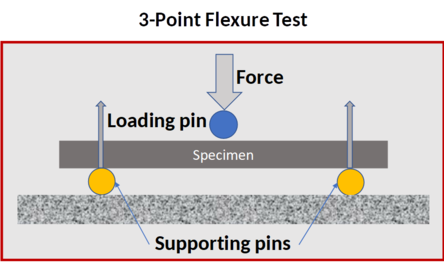
The principle of 3-point flexure test is to place the specimen on the 2 supporting pins. A third supporting bin, present on the upper part of the mobile piece is positioned in the middle of the test specimen. By modifying its position, this third supporting pin was exerting increasing force until the stress exerted causes the rupture of the test piece.
The responses were 1/ the bending time (s) and 2/ the strength (kN), and 3/ the stress (MPa).
3 Results
3.1 First experimental design
The responses we used were:
- 1. bending time (s),
- 2. strength (kN),
- 3. stress (MPa).
All these responses were recorded on computer. In Table 3, the first two columns recall the levels of the operating parameters. The three columns give the results for bending time, strength and stress. In the last column, we placed photos of the specimens after the bending test.
| Length (cm) | Concentration* | Bending Time (s) | Strength (kN) | Slope | |
| DIC01 | 9 | 2.4 | 20.83 | 3.44 | 0.1642 |
| DIC02 | 16 | 2.4 | 10.42 | 1.77 | 0.1656 |
| DIC03 | 9 | 3.2 | 21.03 | 3.53 | 0.1661 |
| DIC04 | 9 | 2.4 | 20.63 | 3.37 | 0.1622 |
| DIC05 | 14 | 2.97 | 16.63 | 2.80 | 0.1665 |
| DIC06 | 14 | 1.83 | 23.03 | 3.83 | 0.1649 |
| DIC07 | 9 | 2.4 | 22.83 | 3.74 | 0.1629 |
| DIC08 | 4 | 1.83 | 29.03 | 4.84 | 0.1656 |
| DIC09 | 4 | 2.97 | 21.03 | 3.46 | 0.1649 |
| DIC10 | 9 | 2.4 | 23.23 | 3.87 | 0.1655 |
| DIC11 | 2 | 2.4 | 27.04 | 4.56 | 0.1666 |
| DIC12 | 9 | 1.6 | 19.03 | 3.15 | 0.1657 |
| DIC13 | 9 | 2.4 | 24.43 | 4.09 | 0.1658 |
| DIC14 | 16 | 3.2 | 12.03 | 2.01 | 0.1647 |
| DIC15 | 16 | 1.6 | 24.63 | 4.12 | 0.1658 |
| DIC16 | 2 | 3.2 | 22.23 | 3.70 | 0.1660 |
| DIC17 | 2 | 1.6 | 28.03 | 4.68 | 0.1651 |
| DIC18 | 16 | 2.4 | 17.63 | 2.94 | 0.1648 |
| MP1 | 0 | 0 | 21.03 | 3.53 | 0.1667 |
| MP2 | 0 | 0 | 26.23 | 4.32 | 0.1620 |
| MP3 | 0 | 0 | 26.83 | 4.44 | 0.1635 |
- Concentration (g fiber/kg mortar)
Fiber reinforced mortar:
Free-fiber mortar:
| Coefficient correlation | Length | Bending Time | Strength | Slope | Concen tration |
| Fiber length | 1 | -0.67 | -0.66 | 0.11 | 0.50 |
| Bending Time (s) | -0.67 | 1 | 1.00 | -0.12 | -0.44 |
| Strength (kN) | -0.66 | 1.00 | 1 | -0.08 | -0.43 |
| Slope | 0.11 | -0.12 | -0.08 | 1 | 0.27 |
| Concentration (g fiber/kg mortar) | 0.50 | -0.44 | -0.43 | 0.27 | 1 |
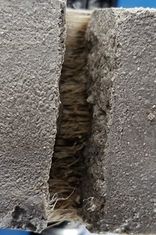
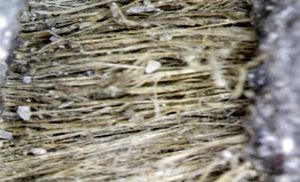
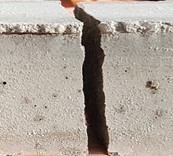
At the end of the test, the non-reinforced specimens of mortar were immediately abruptly broken into 2 independent blocks. In the case of all reinforced specimens, at least some fibers remained intact. We did not get 2 independent blocks.
Tests 8, 11 and 17 gave higher responses than those obtained with the non-reinforced mortar. It was clear that such a behavior strictly depends on both fiber length and concentration.
It also was worth noticing that the layers of fibers formed lines of least resistance. These last promoted the rupture of the test specimens.
The multiple regressions testing was carried out on trial data. The linear main effect model in coded unit shows the role of every variable and their interactions in independent variables.
| Source | df | Coeff. | Std.Err. | p-value |
| Mean/Interc. | 8.42136 | 0,28316 | 0,000000 | |
| (1) Fiber length (cm)(L) | 1 | -1.27596 | 0,28539 | 0,000528 |
| (2) [C]/layer (g)(L) | 1 | -0.92005 | 0,30112 | 0,008556 |
| 1L by 2L | 1 | -0.22435 | 0,27161 | 0,422649* |
| Lack of Fit | 9 | 0,372785* |
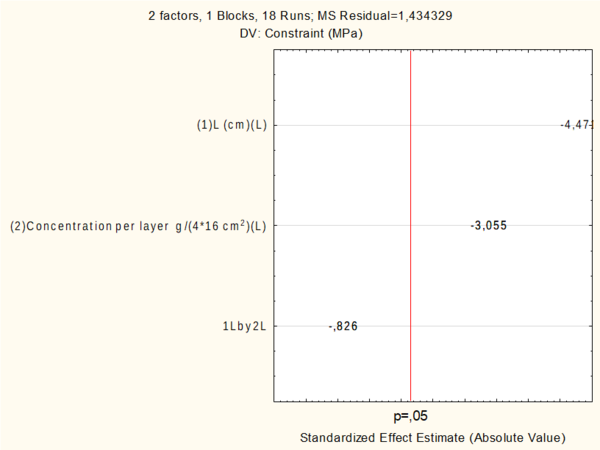
An analysis of variance was performed on the results obtained, with the Statistica 10 software; it reveals significant negative linear effects (p <0.05) of flax fiber length and masse of fiber per layer implying a decrease in constraint after three-point flexural test. It should be noted that the interaction between the length and mass of fiber per layer was insignificant in the experimental field studied (Table 4).
The mathematical equation in terms of coded factors for three-point flexural test on constraint model is shown in Eq. (1).
|
|
(1) |
The sufficiency of the model was evaluated through analysis of variance (ANOVA). Moreover, the variation of the data around the fitted model designed by the Lack of Fit was also checked. In the present study, the Lack of Fit is not significant relative to the pure error, indicating good response to the model.
ANOVA indicated that the first-order polynomial model (Eq. 3)) was adequate to represent the actual relationship between the response and the variables, with an acceptable value of coefficient of determination (R2 = 0.68188). The value of the adjusted determination coefficient (adjusted R2 = 0. 61371) was also acceptable to indicate a significance of the model.
The result also could be explained by the frequency histogram Pareto chart of effects (Fig. 2). Pareto analysis is a technique that helps to prioritize and focus resources visually. It shows the influence of each factor on the response in decreasing order. As it can be seen (Fig. 3), the most important negative linear effect for constraint were the length of flax fiber followed by the masse of flax fiber per layer. The efficiency of constraint was also affected by factor interaction such as L x [C] but is it statically non-significant.
All the results mentioned above are in agreement with many study, which state that by using highly concentration of fiber, a considerable mortar weight loss can be achieved along with a low constraint.
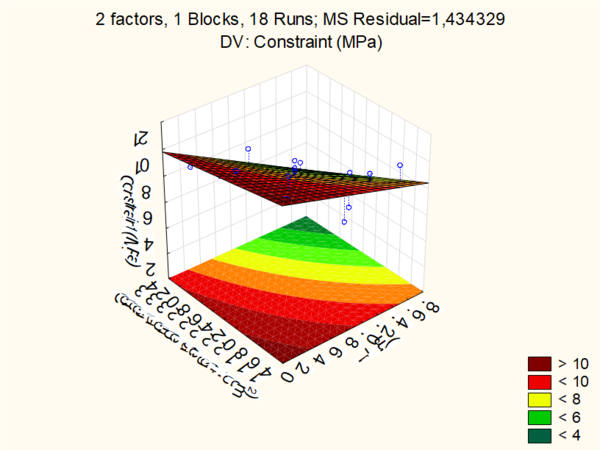
The Response surface and contour plots were generated as a function of the two independent variables at a time are more helpful in. The three-dimensional surface curves were plotted to understand both the main and the interactive effects of these two factors and provide useful information about the behavior of the system within the experimental design. The response surface plots for constraint is shown in figure 6, for significant factor interaction resulted from the ANOVA.
Figure 6 shows the increased constraint with decrease in length and mass of fiber flax per layer. This is mainly because of the increase in the mass of cement composition of the mortar. The result also indicated that concentration could act as limiting factors and increase in their values cause changes in the composition of the mortar, resulting in loss of density with an increase of the vacuum, leading to poor fiber cement cohesion.
3.2 The second experimental design
Table 3 summarizes the results of the different tests we achieved using the various conventional and fiber-reinforced specimens. Each mold contained 3 samples and each mold was filled with mortar corresponding to the conditions of one point of the experimental design. So, each point of the experimental design was repeated 3 times. The first two columns recall the levels of the operating parameters. The three columns give the results for bending time, strength and stress. In the last column, we placed photos of the specimens after the bending test.
At the end of the test, all specimens of mortar (reinforced or non-reinforced) were broken into 2 independent blocks. Tests 5, 6, 7, 11 and 14 gave higher responses than those obtained with the non-reinforced mortar. As the layout is random, there is no line of least resistance, in the opposite of our first study. Although it is very difficult to identify the impact of the fiber, but we think our level of concentration were too low.
| Fiber length (cm) | Bending Time (s) | Strength (kN) | Slope | Quantity of fiber (g) | Sample mass (g) | Relative number of fibers | Mass of mortar (g) | Fiber concentration | ||||||||||
| DIC01A | 6.00 | 19.23 | 3.20 | 0.1645 | 0.20 | 524.78 | 6.35 | 524.58 | 0.38 | |||||||||
| DIC01B | 6.00 | 20.03 | 3.32 | 0.1639 | 0.20 | 531.74 | 6.27 | 531.54 | 0.38 | |||||||||
| DIC01C | 6.00 | 17.83 | 3.02 | 0.1669 | 0.20 | 526.31 | 6.34 | 526.11 | 0.38 | |||||||||
| DIC02A | 10.00 | 20.43 | 3.40 | 0.1660 | 0.20 | 542.26 | 3.69 | 542.06 | 0.37 | |||||||||
| DIC02B | 10.00 | 19.03 | 3.19 | 0.1662 | 0.20 | 528.75 | 3.78 | 528.55 | 0.38 | |||||||||
| DIC02C | 10.00 | 17.83 | 3.00 | 0.1656 | 0.20 | 525.53 | 3.81 | 525.33 | 0.38 | |||||||||
| DIC03A | 6.00 | 19.63 | 3.30 | 0.1665 | 0.36 | 517.66 | 11.49 | 517.30 | 0.69 | |||||||||
| DIC03B | 6.00 | 17.03 | 2.61 | 0.1587 | 0.36 | 523.05 | 11.37 | 522.69 | 0.68 | |||||||||
| DIC03C | 6.00 | 19.63 | 3.29 | 0.1653 | 0.36 | 536.56 | 11.19 | 536.20 | 0.67 | |||||||||
| DIC04A | 6.00 | 18.23 | 2.99 | 0.1628 | 0.20 | 534.32 | 6.24 | 534.12 | 0.37 | |||||||||
| DIC04B | 6.00 | 20.63 | 3.44 | 0.1660 | 0.20 | 529.38 | 6.30 | 529.18 | 0.38 | |||||||||
| DIC04C | 6.00 | 20.43 | 3.35 | 0.1625 | 0.20 | 535.21 | 6.23 | 535.01 | 0.37 | |||||||||
| DIC05A | 8.83 | 21.43 | 3.57 | 0.1659 | 0.31 | 537.43 | 6.54 | 537.12 | 0.58 | |||||||||
| DIC05B | 8.83 | 21.63 | 3.61 | 0.1662 | 0.31 | 533.33 | 6.59 | 533.02 | 0.58 | |||||||||
| DIC05C | 8.83 | 21.03 | 3.45 | 0.1633 | 0.31 | 534.34 | 6.59 | 534.03 | 0.58 | |||||||||
| DIC06A | 8.83 | 21.43 | 3.57 | 0.1659 | 0.09 | 518.95 | 1.95 | 518.86 | 0.17 | |||||||||
| DIC06B | 8.83 | 21.03 | 3.49 | 0.1653 | 0.09 | 525.94 | 1.92 | 525.85 | 0.17 | |||||||||
| DIC06C | 8.83 | 21.23 | 3.56 | 0.1670 | 0.09 | 529.96 | 1.91 | 529.87 | 0.17 | |||||||||
| DIC07A | 6.00 | 20.83 | 3.48 | 0.1651 | 0.20 | 529.98 | 6.29 | 529.78 | 0.38 | |||||||||
| DIC07B | 6.00 | 20.84 | 3.48 | 0.1658 | 0.20 | 527.16 | 6.33 | 526.96 | 0.38 | |||||||||
| DIC07C | 6.00 | 21.63 | 3.60 | 0.1659 | 0.20 | 536.40 | 6.22 | 536.20 | 0.37 | |||||||||
| DIC08A | 3.17 | 19.83 | 3.28 | 0.1643 | 0.09 | 529.37 | 5.31 | 529.28 | 0.17 | |||||||||
| DIC08B | 3.17 | 19.43 | 3.28 | 0.1678 | 0.09 | 539.04 | 5.22 | 538.95 | 0.17 | |||||||||
| DIC08C | 3.17 | 21.03 | 3.53 | 0.1676 | 0.09 | 525.55 | 5.40 | 525.46 | 0.17 | |||||||||
| DIC09A | 3.17 | 19.23 | 3.25 | 0.1661 | 0.31 | 529.47 | 18.48 | 529.16 | 0.59 | |||||||||
| DIC09B | 3.17 | 21.43 | 3.60 | 0.1663 | 0.31 | 553.61 | 17.71 | 553.30 | 0.56 | |||||||||
| DIC09C | 3.17 | 19.03 | 3.17 | 0.1645 | 0.31 | 530.91 | 18.47 | 530.60 | 0.59 | |||||||||
| DIC10A | 6.00 | 21.03 | 3.54 | 0.1669 | 0.20 | 526.94 | 6.33 | 526.74 | 0.38 | |||||||||
| DIC10B | 6.00 | 20.84 | 3.53 | 0.1676 | 0.20 | 531.64 | 6.27 | 531.44 | 0.38 | |||||||||
| DIC10C | 6.00 | 19.83 | 3.33 | 0.1662 | 0.20 | 522.51 | 6.38 | 522.31 | 0.38 | |||||||||
| DIC11A | 2.00 | 20.43 | 3.49 | 0.1684 | 0.20 | 536.09 | 18.66 | 535.89 | 0.37 | |||||||||
| DIC11B | 2.00 | 20.43 | 3.45 | 0.1669 | 0.20 | 534.06 | 18.73 | 533.86 | 0.37 | |||||||||
| DIC11C | 2.00 | 22.03 | 3.70 | 0.1665 | 0.20 | 525.40 | 19.04 | 525.20 | 0.38 | |||||||||
| DIC12A | 6.00 | 20.23 | 3.36 | 0.1651 | 0.04 | 518.43 | 1.39 | 518.39 | 0.08 | |||||||||
| DIC12B | 6.00 | 20.83 | 3.48 | 0.1654 | 0.04 | 527.70 | 1.37 | 527.66 | 0.08 | |||||||||
| DIC12C | 6.00 | 17.83 | 3.08 | 0.1686 | 0.04 | 509.50 | 1.42 | 509.46 | 0.09 | |||||||||
| DIC13A | 6.00 | 20.63 | 3.41 | 0.1627 | 0.20 | 526.70 | 6.33 | 526.50 | 0.38 | |||||||||
| DIC13B | 6.00 | 22.23 | 3.71 | 0.1645 | 0.20 | 534.58 | 6.24 | 534.38 | 0.37 | |||||||||
| DIC13C | 6.00 | 20.43 | 3.40 | 0.1636 | 0.20 | 525.23 | 6.35 | 525.03 | 0.38 | |||||||||
| DIC14A | 6.00 | 21.43 | 3.32 | 0.1631 | 0.60 | 526.35 | 19.02 | 525.75 | 1.14 | |||||||||
| DIC14B | 6.00 | 22.63 | 3.73 | 0.1639 | 0.60 | 535.57 | 18.69 | 534.97 | 1.12 | |||||||||
| DIC14C | 6.00 | 22.83 | 3.82 | 0.1658 | 0.60 | 531.67 | 18.83 | 531.07 | 1.13 | |||||||||
| MP1A | 0.00 | 19.83 | 3.32 | 0.1649 | 0.00 | 520.23 | - | 520.23 | 0.00 | |||||||||
| MP1B | 0.00 | 21.63 | 3.60 | 0.1636 | 0.00 | 523.11 | - | 523.11 | 0.00 | |||||||||
| MP1C | 0.00 | 20.63 | 3.45 | 0.1649 | 0.00 | 520.12 | - | 520.12 | 0.00 | |||||||||
| MP2A | 0.00 | 21.43 | 3.57 | 0.1640 | 0.00 | 532.49 | - | 532.49 | 0.00 | |||||||||
| MP2B | 0.00 | 18.43 | 3.05 | 0.1652 | 0.00 | 533.64 | - | 533.64 | 0.00 | |||||||||
| MP2C | 0.00 | 20.03 | 3.35 | 0.1648 | 0.00 | 529.53 | - | 529.53 | 0.00 | |||||||||
| Coefficient correlation | Fiber length | Bending Time | Strength | Slope | Quantity of fiber | Sample weight | RNF | Mass of mortar | Fiber Concentration | |||||||||
| Fiber length | 1 | 0.14 | 0.14 | 0.04 | 0.19 | 0.04 | -0.40 | 0.04 | 0.18 | |||||||||
| Bending Time | 0.14 | 1 | 0.98 | 0.41 | -0.21 | 0.24 | -0.34 | 0.24 | -0.23 | |||||||||
| Strength | 0.14 | 0.98 | 1 | 0.59 | -0.27 | 0.23 | -0.39 | 0.23 | -0.29 | |||||||||
| Slope | 0.04 | 0.41 | 0.59 | 1 | -0.39 | 0.06 | -0.40 | 0.06 | -0.39 | |||||||||
| Quantity of fiber | 0.19 | -0.21 | -0.27 | -0.39 | 1 | 0.07 | 0.81 | 0.06 | 1.00 | |||||||||
| Sample weight | 0.04 | 0.24 | 0.23 | 0.06 | 0.07 | 1 | -0.06 | 1.00 | 0.04 | |||||||||
| *RNF | -0.40 | -0.34 | -0.39 | -0.40 | 0.81 | -0.06 | 1 | -0.07 | 0.82 | |||||||||
| Mass mortar | 0.04 | 0.24 | 0.23 | 0.06 | 0.06 | 1.00 | -0.07 | 1 | 0.03 | |||||||||
| **Fiber Concentration | 0.18 | -0.23 | -0.29 | -0.39 | 1.00 | 0.04 | 0.82 | 0.03 | 1.00 | |||||||||
* RNF: Relative number of fibers: (g fiber/g mortar/m fiber length); **Fiber concentration (g fiber/kg mortar)
4 Conclusion
The experiments and measurements carried out have shown the high importance of using systems capable of extending the amortization time of the breakdown of architectural structures. The use of natural fibers in this concept was stated from the great interest which can generate the definition of a new process of purification of many cellulose-based fibers from all other compounds (lignin, hemicellulose...). The Tripolium coupling DIC with intermittent organosolv process should have a large-scale technical and economic impact.
The use of fibers in seismic-resistant construction is all the more interesting as the fibers may have a rougher surface, more spread-out bending resistance and a longer breakage time. The random distribution of fibers within the mortar should particularly facilitate the widespread adoption of this process.
5 Acknowledgment
This research was carried out under the Kreative Habitat project, funded by the Interreg Sudoe program
References
- 1. Silva FDA, Mobasher B, Filho RDT. Cracking mechanisms in durable sisal fiber reinforced cement composites. Cem Concr Compos 2009; 31:721–30.
- 2. Mazars, J., 1986. A description of micro- and macroscale damage of concrete structures. Engineering Fracture Mechanics 25, 729–737.
- 3. Bortolotti, L., 1988. Double-punch test for tensile and compressive strengths in concrete. IACI Materials Journal 85-M4, 26–32.
- 4. Peled A, Bentur A. Fabric structure and its reinforcing efficiency in textile reinforced cement composites. Compos Part A 2003: 34: 107–18.
- 5. Peld A, Sueki S, Mobasher B. Bonding in fabric cement systems: effects of fabrication methods. Cem Concr Res 2006: 36: 1661–71.
- 6. Gencoglu M. Effect of fabric types on the impact behavior of cement based composites in flexure, Materials and Structures 2009; 42: 135–47.
- 7. Zhu D, Gencoglu M, Mobasher B. Low velocity impact behavior of AR glass fabric reinforced cement composites in flexure. Cem Concr Compos 2009; 31 (6): 379–87.
- 8. Peled A, Mobasher B. Tensile behavior of fabric cement-based composites: pultruded and cast. J Mater Civ Eng 2007; 19(4):340–8.
- 9. Ardanuy M, Claramunt J, Toledo Filho RD. Cellulosic fiber reinforced cement based composites: a review of recent research. Constr Build Mater 2015; 79: 115e28.
- 10. Santos SF, Schmidt R, Almeida A, Tonoli GHD, Savastano Jr H. Supercritical carbonation treatment on extruded fiber-cement reinforced with vegetable fibers. Cem Concr Compos 2015; 56:84e94.
- 11. Yan L, Chouw N. Compressive and flexural behaviour and theoretical analysis of flax fiber reinforced polymer tube encased coir fibre reinforced concrete composite. Mater Des 2013; 52:801e11. 2013
- 12. Filho JAM, Silva FA, Toledo Filho RD. Degradation kinetics and aging mechanisms on sisal fiber cement composite systems. Cem Concr Compos 2013; 40: 30e9.
- 13. Savastano JH, Warden PG, Coutts RSP. Brazilian waste fibers as reinforcement for cement-based composites. Cem Concr Compos 2000; 22:379e84.
- 14. Yan L, Chouw N. Dynamic and static properties of flax fiber reinforced polymer tube confined coir fiber reinforced concrete. J Compos Mater 2014; 48: 1595e610.
- 15. Yilmaz, N. D., Powell, N. B., Banks-Lee, P., Michielsen, S., Multi-fiber needle-punched nonwoven composites: Effects of heat treatment on sound absorption performance. J. Ind. Text., 43(2), 231, 2013.
- 16. Vijay Kumar Thakur., ManjuKumari Thakur andRaju Kumar Gupta Review: Raw Natural Fiber–Based Polymer Composites Int. J.Polym. Anal. Charact.19: 256–271, 2014.
- 17. Williams, G. I.; Wool, R. P. “Composites from natural fibers and soy oil resins,” Applied Composite Materials. 2000, 7, 421–432.
- 18. Yilmaz, N. D., Khan, G. M. A., Biofiber reinforced acrylated epoxidized soybean oil (AESO) composites. in: Handbook of Composite from Renewable Materials Volume 4: Functionalization, V. K. Thakur, M. K. Thakur, M. R. Kessler (Eds.), 211–251, Scrivener, Beverly, MA, USA, 2017.
- 19. Aziz, M. A., Paramasivam, P., & Lee, S. L. (1984). New reinforced concretes. 3: Concrete reinforced with natural fibres. Guildford: Surrey University Press.
- 20. Morton, J. H., Cooke, T., & Akers, S. (2010). Performance of slash pine fibers in fiber cement products. Construction and Building Materials, 24, 165–170.
- 21. Ramakrishna, G., & Sundararajan, T. (2005). Studies on the durability of natural fibers and the effect of corroded fibers on the strength of mortar. Cement and Concrete Composites, 27, 575–582.
- 22. Khan GMA, Yilmaz ND, Yilmaz K (2016) Okra bast fiber as potential reinforcement element of biocomposites: Can it be the flax of the future? In: Thakur VK (ed) Handbook of Composite from Renewable Materials. Wiley Scrivener.
- 23. Panthapulakkal S, Sain M, Injection-molded short hemp fiber/glass fiber- reinforced polypro¬pylene hybrid composites— mechanical, water absorption and thermal properties, J. Appl. Polym. Sci., 103, pp. 2432–2441, 2007.
- 24. Panthapulakkal, S., Sain, M., Studies on the water absorption properties of short hemp-glass fiber hybrid polypropylene composites. J. Compos. Mater., 41(15), 1871–1883, 2007b.
- 25. Faruk, O., Bledzki, A. K., Fink, H., Sain, M., Progress report on natural fiber reinforced composites. Macromol. Mater. Eng., 299(1), 9–26, 2014.
- 26. Adekunle K, Akesson D, Skrifvars M. Biobased composites prepared by compression molding with a novel thermoset resin from soybean oil and a natural-fiber reinforcement. J Appl Polym Sci 2010; 116(3):1759–65.
- 27. Hernandez-Olivares, F., Oteiza, I., & de Villanueva, L. (1992). Experimental analysis of toughness and modulus of rupture increase of sisal short fiber reinforced hemihydrated gypsum. Composite Structures, 22, 123–137.
- 28. Mansur, M. A., & Aziz, M. A. (1982). A study of jute fiber reinforced cement composites. International Journal of Cement Composites and Lightweight Concrete, 4, 75–82.
- 29. Ardanuy, M., Claramunt, J., García-Hortal, J. A., & Barra, M. (2011). Fiber-matrix interactions in cement mortar composites reinforced with cellulosic fibers. Cellulose, 18, 281–289.
- 30. Pacheco-Torgal F, Jalali S. Cementitious building materials reinforced with vegetable fibers: a review. Constr Build Mater. 2011; 25:575–81.
- 31. M. Ardanuy, J. Claramunt, J.A. García-Hortal, M. Barra, Fiber-matrix interactions in cement mortar composites reinforced with cellulosic fibers, Cellulose. 18 (2011) 281–289.
- 32. B.J. Mohr, H. Nanko, K.E. Kurtis, Durability of kraft pulp fiber–cement composites to wet/dry cycling, Cem. Concr. Compos. 27 (2005) 435–448.
- 33. B.J. Mohr, J.J. Biernacki, K.E. Kurtis, Microstructural and chemical effects of wet/dry cycling on pulp fiber–cement composites, Cem. Concr. Res. 36 (2006) 1240–1251.
- 34. R.D. Tolêdo Filho, K. Scrivener, G.L. England, K. Ghavami, Durability of alkali sensitive sisal and coconut fibers in cement mortar composites, Cem. Concr. Compos. 22 (2000) 127–143.
- 35. Mohr, B. J., Nanko, H., & Kurtis, K. E. (2005). Durability of kraft pulp fiber–cement composites to wet/dry cycling. Cement and Concrete Composites, 27, 435–448.
- 36. Mohr, B. J., Biernacki, J. J., & Kurtis, K. E. (2006). Microstructural and chemical effects of wet/dry cycling on pulp fiber–cement composites. Cement and Concrete Research, 36, 1240–1251.
- 37. Toledo Filho, R. D., Scrivener, K., England, G. L., & Ghavami, K. (2000). Durability of alkali-sensitive sisal and coconut fibers in cement mortar composites. Cement and Concrete Composites, 22, 127–143.
- 38. Tonoli, G. H. D., Santos, S. F., Savastano, H., Delvasto, S., Mejia de Gutierez, R., & Lopez de Murphy, M. D. M. (2011). Effects of natural weathering on microstructure and mineral composition of cementitious roofing tiles reinforced with fique fiber. Cement and Concrete Composites, 33, 225–232.
- 39. Li, X., Tabil, L.G. and Panigrahi, S. (2007) Chemical Treatments of Natural Fiber for Use in Natural Fiber-Reinforced Composites: A Review. Journal of Polymers and the Environment, 15, 25-33.
- 40. A. K. Bledzki and J. Gassan, Composites reinforced with cellulose based fibers, Prog. Polym. Sci. 24, 221–274 (1999).
- 41. Qin C, Soykeabkaew N, Xiuyuan N, Peijs T. The effect of fiber volume fraction and mercerization on the properties of all-cellulose composites. Carbohydrate Polymers 2008; 71:458–67.
- 42. Savastano Jr., H., Warden, P. G., Coutts, R. S. P.: Ground iron blast furnace slag as a matrix for cellulose-cement materials. Cement and Concrete Composites, 2001, 23, pp. 389–397.
- 43. Yan, L., Su, S., & Chouw, N. (2015). Microstructure, flexural properties and durability of coir fiber reinforced concrete beams externally strengthened with flax FRP composites. Composites Part B: Engineering, 80, 343–354.
- 44. Yan L., Chouw N., Experimental study of flax FRP tube encased coir fiber reinforced concrete composite column, Construction and Building Materials, 40, 1118, 2013.
- 45. Iskhakov I., Ribakov Y., Holschemacher K., Mueller T., High performance repairing of rein¬forced concrete structures. Mater.Des., 44, 216, 2013.
- 46. Ferrari, V.J., Hanai, J.B.D., Souza, R.A.D., Flexural strengthening of reinforcement concrete beams using high performance fiber reinforcement cement-based composite (HPFRCC) and carbon fiber reinforced polymers (CFRP). Constr. Build. Mater., 48, 485–498, 2013.
- 47. Dong, J., Wang, Q., Guan, Z., Structural behaviour of RC beams with external flexural and flex¬ural–shear strengthening by FRP sheets. Composites Part B, 44, 604, 2013.
- 48. Kim, H.S., Shin, Y.S., Flexural behavior of reinforced concrete (RC) beams retrofitted with hybrid fiber reinforced polymers (FRPs) under sustaining loads. Compos.Struct., 93, 802, 2011.
- 49. Ceroni, F., Experimental performances of RC beams strengthened with FRP materials. Constr. Build.Mater., 24, 1547, 2010.
- 50. Al-Amery, R., Al-Mahaidi, R., Coupled flexural–shear retrofitting of RC beams using CFRP straps. Compos.Struct., 75, 457, 2006.
- 51. Grace, N.F., Ragheb, W.F., Sayed, G.A., Development and application of innovative triaxi¬ally braided ductile FRP fabric for strengthening concrete beams. Compos.Struct., 64, 521, 2004.
- 52. Grace, N.F., Ragheb, W.F., Sayed, G.A., Development and application of innovative triaxi¬ally braided ductile FRP fabric for strengthening concrete beams. Compos.Struct., 64, 521, 2004.
- 53. Lau, K.T., Zhou, L.M., Mechanical performance of composite-strengthened concrete structures. Composites Part B, 32, 21, 2001.
Document information
Published on 15/04/21
Accepted on 04/07/19
Submitted on 19/06/19
Volume 05 - Comunicaciones Matcomp19 (2021), Issue Núm. 2 - Caracterización analítica, numérica y experimental de los materiales compuestos. Materiales multifuncionales. Comportamiento de componentes estructurales., 2021
DOI: 10.23967/r.matcomp.2021.04.007
Licence: Other
Share this document
Keywords
claim authorship
Are you one of the authors of this document?
