Abstract
Issues related to the pause of global warming in the last decade are reviewed. It is indicated that: (1) The decade of 1999–2008 is still the warmest of the last 30 years, though the global temperature increment is near zero; (2) Natural factors such as volcanism, solar radiation, ENSO, and thermohaline circulation can have impact on the inter-annual and inter-decadal variability of global mean temperatures. However, it will not mask the global warming trend for a long time; (3) Temperatures of China continue to increase in 1999–2008 with an increment of 0.4–0.5°C per 10 years.
Citation
Wang, S., X. Wen, Y. Luo, et al., 2010: Does the global warming pause in the last decade: 1999–2008? Adv. Clim. Change Res., 1, doi: 10.3724/SP.J.1248.2010.00049.
Keywords
1999–2008 ; global warming ; pause
1. Introduction
Climate change has currently become one of the most popular topics in the intergovernmental summits on climate-related policies and treaties. A variety of arguments and perspectives regarding global warming gained extraordinary attention from scientific communities, and also from policy makers and the public. Two highlighted topics still remain controversial: (1) the observed pause of global warming during 1999–2008, and (2) the underestimated climatic impacts in the IPCC 4th Assessment Report (AR4) [ IPCC, 2007 ]. In this paper, we will conduct a comprehensive literature review and explain why those two inconsistent arguments are both intrinsically correct.
2. The pause of global warming during 1999–2008
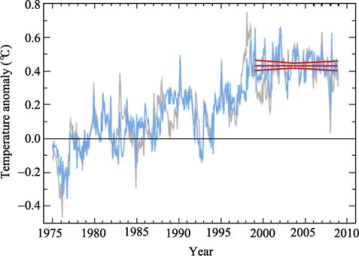
In August 2009, Bulletin of the American Meteorological Society (BAMS) released the report on “State of the Climate in 2008”. Within it, Knight et al. [2009] demonstrates that the increment of global surface air temperature (SAT) is 0.07±0.07°C per 10 years during 1999–2008, estimated by using the HadCRUT3 dataset. This increment is significantly lower than that for the period 1979–2008 with 0.18°C per 10 years, and even lower than the estimated warming trend of the IPCC AR4 with 0.20°C per 10 years [ IPCC, 2007 ]. Two months later, Kerr [2009b] reviewed those up-to-date results in Science (October 2009) and proposed to the whole community a question “what happened to global warming?”. In Kerr’s article, he analyzed the time series of global mean SAT for 1999–2008 using the Had-CRUT3 dataset [Brohan , 2006], as shown in Figure 1 , in which the red line stands for the warming trend of 1999–2008, which tends to be zero. In fact, Had-CRUT3 is not the only data source for examining the change of global mean SAT. There are two public accessible datasets from GISS [ Hansen, 2001 ] and NCDC [ Smith, 2005 ] that could be used for this purpose. In particular, the observations from GISS’s and NCDC’s assimilated satellite data improve the data quality over the polar caps. Although all three series are very similar [ Thorne , 2009 ], GISS still shows a relatively strong warming for the recent 10 years [ Allison et al., 2009 ].
|
|
|
Figure 1. Global mean temperature anomalies (relative to 1961–1990) (gray), global mean temperature anomalies after subtracting the effect of ENSO (blue), and temperature trend of 1999–2008 (red) [ Kerr, 2009a ] |
3. The warmest decade (1999–2008)
It should be noted that the recent 10 years account for the warmest decade for the past hundred years (as shown in Table 1 ), although the trend of global warming nearly stopped since 1999. The data suggests that the long-term warming trend still remains or even becomes more serious. This is also the basic point of the Climate Change Science Compendium [ Balint, 2009 ], which was compiled by the Scientific Committee on Problems of the Environment (SCOPE) and the World Meteorological Organization (WMO), and served as the fundamental materials for the United Nations Climate Change Conference at Copenhagen (COP15) in September 2009. Most of the new findings following the IPCC AR4 regarding climate change and its impact were reviewed in this compendium.
| Decade | 1979–1988 | 1989–1998 | 1999–2008 |
|---|---|---|---|
| Temperature anomaly | 0.07 | 0.22 | 0.40 |
| Temperature increment | 0.07 | 0.29 | 0.07 |
A variety of observations [ Allison et al., 2009 ] show that the status of global warming is worse than it was predicted by the IPCC AR4 [ IPCC, 2007 ]. The conditions of the Arctic sea ice are good example. The annual mean area of the Arctic sea ice in 2007 reduced by 34% compared to the 1970–2000 mean, which was the lowest record ever observed. More than that, The Copenhagen Diagnosis [ Allison et al. , 2009 ] indicated that this area was predicted to decrease to 7,000,000 km2 in September 2008, but in fact it went down to 4,500,000 km2 . Not only observations confirm the bad situation, but also a number of modeling works show that the Arctic sea ice cap will nearly disappear in September 2028 and completely vanish in September 2037 [ Allison et al., 2009 ], which could be much worse than what is expected. Furthermore, several evidences revealed that the mass budget of ice cap over Greenland and Antarctica is negative, indicating that the two huge ice sheets experience a rapid shrinking [ Kerr, 2009b ]. As a result, the global mean sea level will continuously increase. The rate of the sea level increase is 1.7 mm per year in the 20th century, while it reaches 3.1 mm per year during the recent period of 1993–2003. After 2003, the rate tends to decrease slightly, roughly 2.5 mm per year, which is still significantly higher than the averaged value of the 20th century [ Allison et al., 2009 ]. Some evidences [ Allison et al., 2009 ] indicate that the animals could be attacked, vanish, and be replaced for ecological disasters in the ocean by 2050, when 60% of the species might be replaced. At the end of the 21st century, 12%–39% of the land species have to adapt to the new climate, while 10%–48% might vanish [ Allison et al., 2009 ]. There are also some evidences that the serious status was caused by global warming. The tropics are expanding with a speed abnormally faster than the expectation. As consequence towards the mid-latitudes, a reduction of precipitation within the tropics, especially in the dry season, is expected. Many regions (e.g., southern and northern Africa, Mediterranean region, Middle East, Central Asia, Indian subcontinent, southeastern Australia, northern Mexico, and the southwestern United States) could shift to a dry phase with increasing lack of water. Some of them, such as Mediterranean region, could experience severe droughts in the worst case.
4. Why paused?
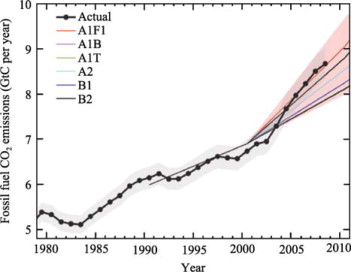
Figure 2 shows the time series of CO2 emissions associated with fossil fuel burning during the period 1980–2010. The concentration of emitted CO2 is increasing in recent decades and even stronger in the 21st century. For instance, the annual mean increase rate is 0.9% in 1990–1999, but grows up to 3.5% in 2000–2007 [ Allison et al., 2009 ], which is even worse than the worst scenario projected by the IPCC AR4. A strengthened greenhouse gases (GHGs) emissions and/or a weakened carbon sink could be responsible for this issue. But we still underestimate the latter one.
|
|
|
Figure 2. Annual CO2 emissions from fossil fuel burning and cement production (black) compared with IPCC emission scenarios (color) [ Allison et al., 2009 ] |
An important question is why does global mean SAT go flat, especially considering the condition of linear increasing GHGs emissions in recent 20 years? A possibility is that there must be some other factors rather than anthropogenic emissions which reduce the warming effect of GHGs.
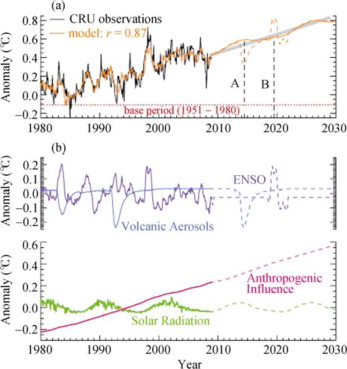
The 9th chapter [ Hegerl , 2007 ] of IPCC AR4 (named Understanding and Attributing Climate Change ) presented the multi-model ensemble results regarding the simulation for the 20th century temperature series. They experienced that the inter-decadal signal before 1960 failed to be simulated, but was successful with just a minor bias after 1960. Lean and Rind [2008] proposed a statistical method to reproduce the time series of global mean SAT by considering 4 factors: anthropogenic emissions including GHGs and aerosols, solar radiation, volcanic sulfate aerosols, and ENSO. The simulated global monthly mean SAT of 1980–2008 highly correlated with the observations (correlation coefficient of 0.87), which can explain 76% of the variance [ Lean and Rind, 2009 ].
Figure 3 shows the results derived from the work of Lean and Rind [2009] . We can see the simulated temperature is greatly consistent to the observations from 1999 to 2008, when anthropogenic emissions kept growing but a few of La Niña events occurred and solar radiation weakened. Therefore, it can be concluded that ENSO cold events and weakened solar radiation possibly stall the warming effect of anthropogenic activities in a certain magnitude.
|
|
|
Figure 3. (a) Global mean temperature observations (black), and based on an empirical model (orange), (b) Individual contributions of ENSO (purple), volcanic aerosols (blue), solar radiation (green) and anthropogenic effects (pink) [ Lean and Rind, 2009 ] |
5. Pause or stop?
“Scientists say just wait a bit”, which is the subtitle in Kerr’s essay [ Kerr, 2009a ], indicating that the current pause is not a stop but probably the warming trend will keep on going in the near future. Kerr arguments that the mainstream perspective on this issue, i.e. pause of global warming in the last 10 years, is true, but will not continue much longer. A strong support came from a series of simulations conducted by the Hadley Centre, using a fully coupled climate model HadCM3. Collins et al. [2006] designed a set of simulations, including one control run and sixteen members, to test the sensitivities of some physical parameters and schemes to transient forcing of CO2 doubling within 70 years. The results show that the seventeen modeled decades show an anomaly of –0.05 to 0.05°C for the amplitude in the recent 10 years, but none of them lasts for more than 15 years. So, the modeling work supports having such an interval with relatively flat trend under long-term warming background, but only for not more than 15 years.
The models did not provide answers to the physical causes for warming pause. The mechanism still remains controversial. Generally, the researchers consider the internal feedback processes within the climate system and such as the modulating of the upper layer of the oceans, to be the reason. Other scientists believe that external forcing, such as enhanced solar radiation in the starting phase of its 11-year cycle, will restart the warming trend in a few years [ Lean and Rind, 2009 ]. The problem, however, is that the variation of solar radiation within the 11-year cycle is too small to drive global climate, and that ENSO and volcanic activities are difficult to predict accurately [ Allison et al., 2009 ]. That is why Lean and Rind [2009] randomly added one volcanic event in 2014 and one El Niño event in 2019, so that they can discuss the approximate range of changes in global SAT. Therefore, the assumption of Lean and Rind does not help predicting global SAT for the next 10 years. Nevertheless, we can conclude that the linear warming trend has more probability than the natural and unpredictable processes to affect Earth’s climate in the near future.
There is another natural process which can affect the global climate on time scales of inter-decadal to centennial: Atlantic meridional overturning circulation (MOC). However, the uncertainty in observing the strength of MOC still remains. Smith et al. [2007] observed that MOC is strengthening and therefore global warming should proceed, while Keenlyside et al. [2008] believe that MOC is weakening, which would neutralize the warming effect caused by human activities. It can be seen that many uncertainties still remain in inter-decadal forcing, such as the MOC.
It is still an open question whether the global warming trend will restart or not in the next few years. In any case, global warming will definitely continue in a long-term point of view.
6. No pause in China
It should be noted that the discussion above is regarding the pause of a warming trend in global mean SAT. For some regional areas, however, the warming trend did not pause from 1999 to 2008. In some extreme cases, the increment was even greater than 3°C per 10 years. The calculated warming increment within the recent 10 years is shown in Figure 4 , from which we can see the warming is still obvious for most of the mid-to-high latitudes in the Northern Hemisphere, except for the northern part of North America, the 30°–40°N and 40°–60°S cooling belts, and Southeast Asia. More investigations are needed to understand the cause for these two cooling belts.
|
|
|
Figure 4. Global mean SAT increments (°C per 10 years) [ Knight et al., 2009 ] (black squares indicate where the trends are inconsistent at two standard deviations level with simulations) |
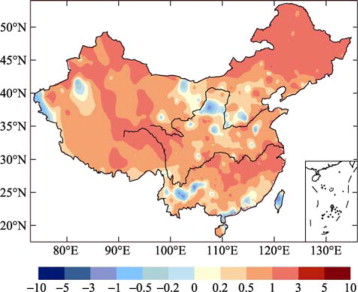
North Asia, from Siberia to the Far East, was one of the regions with a strong warming trend in the past 10 years. Northeast China is located in this region. Figure 5 shows the spatial distribution of the warming increment over China using station observations from 1999 to 2008. We can see that most of the areas were experiencing a warming trend in the recent decades.
|
|
|
Figure 5. Temperature increments (°C per 10 years) of 1999–2008 in China |
The decadal anomaly and increment of temperature in China for the last 30 years (departures from the reference period 1961–1990) was listed in Table 2 . Two datasets were used. One is derived from Wang et al. [1998] , which is referred to as the W series; another is derived from Tang et al. [2005] , which is referred to as the T series. It is shown that the warming increment for 1999–2008, which is slightly lower than that for 1989–1998 though, still remains positive and reaches above 1°C per 10 years. Why the warming trend in China did not pause in the recent decades is still unknown. Many factors can contribute to this situation, such as the natural greenhouse effect, ENSO, solar radiation, volcanic activity, the urban heat island effect, and the Atlantic MOC.
| Decade | 1979–1988 | 1989–1998 | 1999–2008 |
|---|---|---|---|
| W series anomaly | 0.08 | 0.52 | 1.00 |
| T series anomaly | 0.05 | 0.56 | 1.04 |
| W series increment | 0.10 | 0.67 | 0.46 |
| T series increment | 0.05 | 0.63 | 0.40 |
7. Conclusions
The conclusions are summarized as below:
- The increment of global warming in 1999–2008 is 0.07±0.07°C per 10 years, which is much less than that in 1989–1998 with 0.29°C per 10 years.
- The last 10-year period is still the hottest decade in the recent 30 years, although the increment in 1999–2008 is close to zero. As a result, a number of evidences can still be observed, such as glaciers retreat and sea-ice melting.
- The pause of global warming in the recent 10 years can be attributed to natural forcing, such as solar radiation and ENSO, which somewhat stall the warming effect associated with anthropogenic activities.
- One of the mainstream perspectives tends to believe the pause of global warming can be restart in a few years, which, however, is still controversial.
- The warming does not pause in China from 1999 to 2008. China, especially Northeast China, is one of the regions experiencing the strongest warming around the globe.
Acknowledgements
This work was supported by R&D Special Found for Public Welfare Industry (Meteorology) under Grant No. GYHY200706010. We also appreciate the anonymous reviewers for their comments and suggestions.
Received 7 June 2010; revised 28 June 2010; accepted 2 July 2010
References
- Allison et al., 2009 I. Allison, N.L. Bindoff, R.A. Bindoff, et al.; The Copenhagen Diagnosis; Accessed http://www.copenhagendiagnosis.com (2009) Accessed
- Balint et al., 2009 M. Balint, J. Jabbour, C. McMullen, et al.; Climate change science compendium 2009; United Nations Environment Programme, 1–68 (2009)
- Brohan et al., 2006 P. Brohan, J.J. Kennedy, I. Harris, et al.; Uncertainty estimates in regional and global observed temperature changes: a new data set from 1850; J. Geophys. Res., 111 (2006) http://dx.doi.org/10.1029/2005JD006548 D12106
- Collins et al., 2006 M. Collins, B.B.B. Booth, G.R. Harris, et al.; Toward quantifying uncertainty in transient climate change; Climate Dynamics, 27 (2–3) (2006), pp. 127–147
- Hansen et al., 2001 J. Hansen, R. Ruedy, M. Sato, et al.; A closer look at United States and global surface temperature change; J. Geophys Res., 106 (D20) (2001), pp. 23947–23963
- Hegerl et al., 2007 G.C. Hegerl, F.W. Zwiers, P. Braconnot, et al.; Understanding and attributing climate change; S. Solomon (Ed.), et al. , Climate change 2007: the physical science basis. Contribution of working group I to the fourth assessment report of the Intergovernmental Panel on Climate Change, Cambridge University Press (2007), pp. 661–745
- IPCC, 2007 IPCC; S. Solomon (Ed.), et al. , Climate Change 2007: The Physical Science Basis. Contribution of Working Group I to the Fourth Assessment Report of the Intergovernmental Panel on Climate Change, Cambridge University Press (2007), p. 996
- Keenlyside et al., 2008 N.S. Keenlyside, M. Latif, J. Jungclaus, et al.; Advancing decadal-scale climate prediction in the North Atlantic sector; Nature, 453 (2008), pp. 84–88
- Kerr, 2009a R.A. Kerr; What happened to global warming? Scientists say just wait a bit; Science, 326 (5949) (2009), pp. 28–29
- Kerr, 2009b R.A. Kerr; Both of the world’s ice sheets may be shrinking faster and faster; Science, 326 (5950) (2009), p. 217
- Knight et al., 2009 J. Knight, J.J. Kennedy, C. Folland, et al.; Do global temperature trends over the last decade falsify climate predictions?; Bull. Amer. Meteor. Soc., 90 (8) (2009), pp. S22–S23
- Lean and Rind, 2008 J.L. Lean, D.H. Rind; How natural and anthropogenic influences alter global and regional surface temperatures: 1889 to 2006; Geophys. Res. Lett., 35 (2008) http://dx.doi.org/10.1029/2008GL034864 L18701
- Lean and Rind, 2009 J.L. Lean, D.H. Rind; How will earth’s surface temperature change in future decades; Geophys. Res. Lett., 36 (2009) http://dx.doi.org/10.1029/2009GL038932 L15708
- Smith et al., 2007 D.M. Smith, S. Cusack, A.W. Colman, et al.; Improved surface temperature prediction for the coming decade from a global climate model; Science, 317 (5839) (2007), pp. 796–799
- Smith and Reynolas, 2005 T.M. Smith, R.W. Reynolas; A global merged land-air-sea surface temperature reconstruction based on historical observations (1880–1997); J. Climate, 18 (12) (2005), pp. 2021–2036
- Tang and Ren, 2005 G. Tang, G. Ren; Reanalysis of surface air temperature change of the last 100 years over China; Climatic and Environmental Research (in Chinese), 10 (4) (2005), pp. 791–798
- Thorne, 2009 P.W. Thorne; Global climate; Bull. Amer. Meteor. Soc., 90 (8) (2009), pp. S17–S21
- Wang et al., 1998 S. Wang, J. Ye, D. Gong, et al.; Construction of mean annual temperature series for the last one hundred years in China; Quarterly Journal of Applied Meteorology (in Chinese), 9 (4) (1998), pp. 392–401
Document information
Published on 15/05/17
Submitted on 15/05/17
Licence: Other
Share this document
Keywords
claim authorship
Are you one of the authors of this document?


![Global mean SAT increments (°C per 10 years) [Knight et al., 2009] (black ...](/wd/images/9/9b/Draft_Content_585730915-1-s2.0-S167492781050008X-gr4.jpg)
