Abstract
A Local Ensemble Transform Kalman Filter assimilation system has been implemented into an aerosol-coupled global nonhydrostatic model to simulate the aerosol mass concentration and aerosol optical properties of 3 desert sites (Ansai, Fukang, Shapotou) in northwestern China. One-month experiment results of April 2006 reveal that the data assimilation can correct the much overestimated aerosol surface mass concentration, and has a strong positive effect on the aerosol optical depth (AOD) simulation, improving agreement with observations. Improvement is limited with the Ångström Exponent (AE) simulation, except for much improved correlation coefficient and model skill scores over the Ansai site. Better agreement of the AOD spatial distribution with the independent observations of Terra (Deep Blue) and Multi-angle Imaging Spectroradiometer (MISR) AODs is obtained by assimilating the Moderate Resolution Imaging Spectroradiometer (MODIS) AOD product, especially for regions with AODs lower than 0.30. This study confirms the usefulness of the remote sensing observations for the improvement of global aerosol modeling.
Keywords
Aerosol properties ; Aerosol assimilation ; Moderate Resolution Imaging Spectroradiometer ; Multi-angle Imaging Spectroradiometer ; PM10
1. Introduction
Aerosols have been in the climate research spotlight because of their direct and indirect impacts on radiative balance and their interaction with other earth systems such as clouds (Forster et al., 2007 ). In addition to the important ground-based observation networks, satellite platforms such as the Moderate Resolution Imaging Spectroradiometer (MODIS) and Multi-angle Imaging Spectroradiometer (MISR) provide various global observations of aerosol optical depth (AOD), which is a measure of light extinction by aerosols in the atmospheric column above the Earths surface (Levy et al., 2013 ; Ma et al., 2016 ; Sayer et al., 2013 ; van Donkelaar et al., 2010 ; van Donkelaar et al., 2015 ). In addition, numerical simulation and prediction have offered a more global view of aerosol emission, transport and interaction with nonlinear physical processes than the observations. Uncertainties still remain in estimating the radiative effect of aerosols, although research is in progress using both observational and numerical approaches. Considering the perceived inadequacies of models, the data assimilation system that combines model output with observations to obtain a weighted mean, which is much closer to the actual, improves aerosol predictions and provides a consistent framework for assessing various model error sources (Liu et al., 2011 ; Schutgens et al., 2010a ; Schutgens et al., 2010b ). Collins et al., 2001 ; Yu et al., 2003 , and Adhikary et al. (2008) utilized the Optimal Interpolation to assimilate AODs in both regional and global chemical transport models. Using the three-dimensional variational method (3D-var), AODs of POLarization and Directionality of the Earths Reflectances (POLDER), Along Track Scanning Radiometer (ATSR) and MODIS have been assimilated (Henzing, 2005 ; Generoso et al., 2007 ; Niu et al., 2008 ). In both the Optimal Interpolation and 3D-var techniques, the model error covariant structure has to be assumed a priori and is usually constant in space or time. Therefore, a 4D-var and Ensemble Kalman filter (ENKF) were developed for aerosol assimilation to represent the varying spatiotemporal model covariance, estimate the posterior error, and generate the analysis ensemble (Evensen, 1994 ; Whitaker and Hamill, 2002 ; Benedetti et al., 2009 ). Recently, new attempts for assimilation have been developed. Liu et al. (2011) and Pagowski et al. (2014) implemented the Gridpoint Statistical Interpolation (GSI) 3D-var data assimilation system and its extension for assimilating the surface measurements of PM2.5 , PM10 , and MODIS AOD satellite data. The Local Ensemble Transform Kalman filter (LETKF) was applied to global aerosol transport for assimilating AErosol RObotic NETwork (AERONET) and MODIS data (Hunt et al., 2007 ; Schutgens et al., 2010a ; Schutgens et al., 2010b ; Dai et al., 2014b ). The Chinese desert is regarded as one of the largest sources of Asian dust aerosols, and a lot of results on the dust emissions, optical properties, and effects on the climate system have been obtained by observation and simulation (Wang et al., 2012 ; Che et al., 2013 ; Wang and Niu, 2013 ; Yu et al., 2015 ; Zong et al., 2015 ).
Suzuki et al. (2008) implemented a global three-dimensional aerosol transport-radiation model SPRINTARS (Spectral Radiation Transport Model for Aerosol Species) in NICAM (Nonhydrostatic ICosahedral Atmospheric Model) to perform a simulation using the Earth Simulator. In our previous studies, the global aerosol optical properties were simulated and evaluated using the standard NICAM-SPRINTARS, which were also validated with AERONET and MODIS data (Dai et al., 2014a ; Dai et al., 2015 ). Furthermore, the sensitivity tests of the LETKF assimilation system were performed by assimilating AERONET and MODIS data, respectively. And the aerosol optical properties, simulated by the NICAM-SPRINTARS with and without the data assimilation, have been validated on a global scale or over East Asia (Schutgens et al., 2010a ; Schutgens et al., 2010b ; Dai et al., 2014b ). In this paper, the LETKF methodology is applied to the NICAM-SPRINTARS, to study aerosol properties over the Chinese desert region, and analyze the differences and improvements in the model simulations without (standard) and with data assimilation. The simulated results are validated by independent observations from MODIS Collection 6 (Deep Blue), MISR Level 3, and ground-based observations offered by our cooperators.
2. Data and model description
In this study, we use the NICAM-SPRINTARS model as the forecast model for the assimilation system of the LETKF methodology (Hunt et al., 2007 ). The forecast model predicts the mass mixing ratios of the major tropospheric aerosols (sulfate, carbonaceous aerosols including BC and OC, sea salt, and soil dust) (Takemura et al., 2000 ; Takemura and Nakajima, 2002 ). In this study, the mass mixing ratios are adjusted by assimilating the United States Naval Research Laboratory (NRL) MODIS Level-3 (L3) AOD products (Zhang and Reid, 2006 ). In the assimilation experiment, the ensemble size is assigned to ten members, the perturbation factors are performed spatiotemporally dependent, and the local patch size is set to 1500 km (Dai et al., 2014b ). The model wind, water vapor, pressure, and temperature fields are nudged to the NCEP Final (FNL) analysis data over a time-scale of 6 h. The aerosol emission inventories come from the anthropogenic sources of the AeroCom Phase-II dataset, while the dust and sea salt emissions depends on the near-surface wind speed, vegetation, soil moisture, leaf area index, and amount of snow and ice (Takemura et al., 2009 ).
The statistical metrics, including the correlation coefficient (R ), and the skill score (S ) are used to evaluate the model performance.
|
|
( 1) |
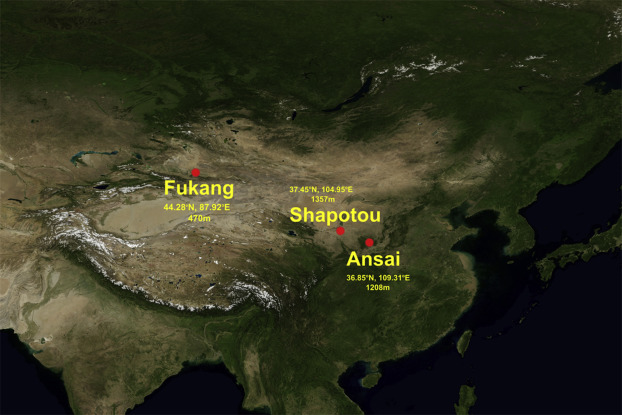
S is a relatively comprehensive statistical index for model simulation, D is the ratio of the standard deviation of the model to that of the observation, and R0 is the maximum attainable R , which is set to 1 ( Taylor, 2001 ; Chin et al., 2009 ; Dai et al., 2014a ). The independent validation observations are the PM10 grid data (0.5° × 0.5°) offered by Guo (2014) , the Chinese Sun Hazemeter Network (CSHNET) data offered by Xin et al. (2007) , the monthly MODIS Collection 6 Deep Blue AOD (Terra) at 550 nm (Hsu et al., 2013 ), and the global monthly MISR Level3 retrievals (http://dx.doi.org/10.5067/Terra/MISR/MIL3MAE_L3.004 ) ( Diner et al., 2001 ; Liu et al., 2004 ; Liu et al., 2010 ; Kahn et al., 2010 ). CSHNET is the first standard network established to measure aerosol optical properties and their spatiotemporal variations throughout China. Fig. 1 shows the spatial distribution of 3 CSHNET sites: Ansai, located in the Loess Plateau in Shaanxi province, where mineral dust aerosols are emitted due to the intensive farming and the exposure of bare soil; Fukang, located in glacial to desert transition zone, where agricultural and pastoral activities take place; and Shapotou, situated in an arid part of the Tengger Desert with more persistent dust aerosols.
|
|
|
Fig. 1. Three selected CSHNET sites with their coordinate and altitude information used in this study. |
3. Results
3.1. Temporal variation of PM10 mass concentration
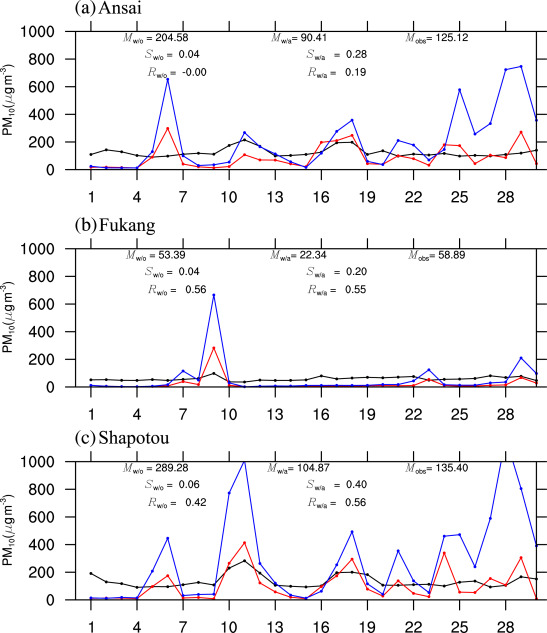
Fig. 2 depicts the daily time-series comparison between the NICAM-SPRINTARS simulated PM10 surface concentrations without and with the data assimilation, and the independent measurements for April 2006 over the 3 sites Ansai, Fukang, and Shapotou. The standard experiment (blue lines) shows the PM10 near-surface mass concentration to be far above the observations (black lines), while the simulated PM10 concentration values with the data assimilation (red lines) are much closer to the observations, although to different extents among the sites and dates. The peak values of the surface PM10 concentration over the Ansai site (Fig. 2 a) during 16–19 April are simulated accurately by the data assimilation experiment, and the overestimations by the standard simulation are also corrected by the data assimilation during 21–30 April. The simulated monthly averaged PM10 concentration value with the data assimilation (90.41 μg m−3 ) is much closer to the observation of 125.12 μg m−3 . When compared with the measurements of PM10 mass concentration over the Shapotou site, the modeled counterparts of the standard simulation show a large positive bias with overestimation by a factor of up to 2 (Fig. 2 c). The much overestimated monthly averaged PM10 value of the standard experiment is significantly improved to 104.87 μg m−3 by data assimilation and is much closer to the observation of 135.40 μg m−3 . Moreover, the improved S and R for both sites also indicate that the data assimilation can better reproduce the temporal variation of the PM10 mass concentrations, and gives a better agreement with the observations. For the Fukang site (Fig. 2 b), where the complex human activities such as agricultural and pastoral activities lead to changes in the dominant aerosol types during the year (Xin et al., 2007 ), the positive effect of the data assimilation is not obvious with a slightly decreased S . The PM10 mass concentration over the Fukang is underestimated after the assimilation, which may be related to the underestimated aerosol burdens.
|
|
|
Fig. 2. Temporal variation of the daily PM10 mass concentration for April 2006 over the CSHNET sites of (a) Ansai, (b) Fukang, (c) Shapotou. Blue and red lines represent for the model results without and with assimilation, respectively; black curve represents for the observation; M = monthly mean value; w/o = model without assimilation; w/a = model with assimilation; obs = observation; S = model skill score; R = correlation coefficient between the simulations and observations. |
3.2. Temporal variation of AOD
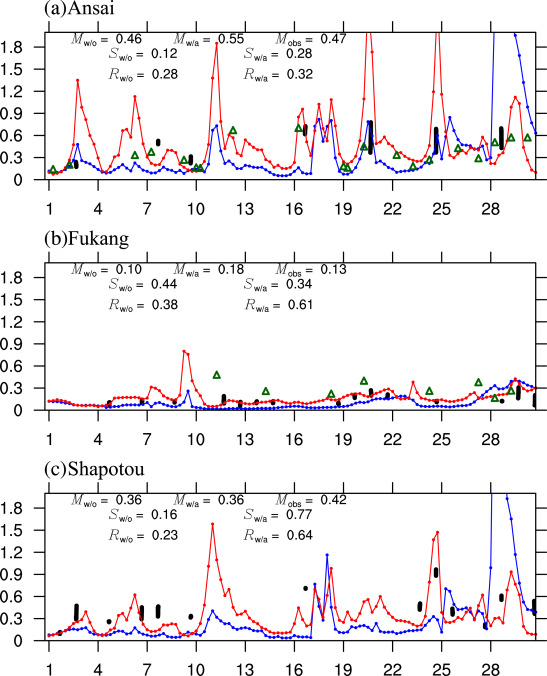
In Fig. 3 , the temporal variations of the simulated AOD at 675 nm (4 results per day at 0:00, 6:00, 12:00, and 18:00 UTC) over the 3 sites are compared with the CSHNET observations at 650 nm (around 12:00). For the Ansai site, the standard simulated AOD (blue line) of 0.46 is much closer to the observation (black dots) of 0.47, while the AOD with the data assimilation (red line) is overestimated by 0.08. When taking the NRL MODIS AODs (green triangles) prepared for the data assimilation as reference, it can be seen that the assimilation experiment has similar temporal variation and AOD values to the MODIS data, which shows the usefulness of the data assimilation. The overestimation of the assimilated AOD may be caused by the larger contribution of dust aerosols with larger AODs due to the data assimilation, or MODIS observations being higher than the CSHNET observations (more CSHNET observations are needed for validation). The positive effect of the data assimilation on the AOD simulation over the Ansai site can be seen from the improved R and S . Over the Fukang ( Fig. 3 b) and Shapotou (Fig. 3 c) sites, the simulated AODs of the assimilation experiments have better correlation coefficients (R = 0.61 and R = 0.64, respectively) with the CSHNET AODs than those from the standard results (R = 0.38 and R = 0.23, respectively), which quantifies the improvement in the dust simulation and transport processes achieved with the data assimilation. Also, the AOD values over the Fukang site around 12–14, 18–22, 24, and 28 April are better simulated by the assimilation experiment, and the capability of the data assimilation to capture multi-day events over the Shapotou site around 25 April and other short-term events (2, 6 and 29 April) is also much more evident. For the Fukang site ( Fig. 3 b), it can be seen that the assimilated NRL MODIS AOD retrievals are higher than the observations, leading to an overestimated AOD in the model with the data assimilation, and a slightly decreased S . For the Shapotou site, both the simulations without and with the data assimilation underestimate the AODs compared with the CSHNET observations. Even though there is no MODIS data to be assimilated over the Shapotou site, the analysis increments are generated and the assimilation experiment still performs well. This proves the positive effect of the local patch size and the sensitivity of LETKF assimilation system, which transfers the observational information to nearby regions. The data assimilation reproduces a better temporal variation of AOD, and improves the S from 0.16 to 0.77 over the Shapotou site where the aerosol composition is simple (mainly dust), indicating that the assimilation can modify the dust burdens caused by uncertainties in the dust emission parameterization.
|
|
|
Fig. 3. Temporal variation of the simulated aerosol optical depth (AOD) (0:00, 6:00, 12:00 and 18:00 UTC during one day) at 675 nm and observed AOD at 650 nm for April 2006 over the CSHNET sites at (a) Ansai, (b) Fukang, (c) Shapotou. Blue and red curves represent for the model results without and with assimilation, respectively; black dots denote the CSHNET observations; green triangles denote the assimilated MODIS AOD retrievals. M = monthly mean value; w/o = model without assimilation; w/a = model with assimilation; obs = observation; S = model skill score; R = correlation coefficient between the simulations and observations. |
3.3. Temporal variation of Ångström Exponent
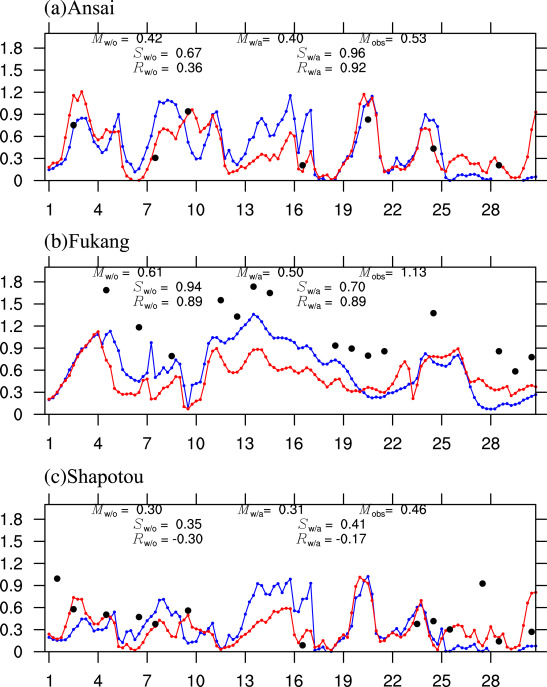
Fig. 4 shows the comparison between the temporal variation of the observed Ångström Exponent (AE) at wavelengths of 650 nm and 405 nm, and the model simulated AE at 675 nm and 440 nm. For the Ansai site (Fig. 4 a), the simulated AEs are 0.42 and 0.40 for the model without (blue line) and with (red line) the data assimilation, respectively, and both are lower than the corresponding observed AE (black dots) of 0.53. The underestimated AE of the assimilation experiment indicates an overestimation of coarse dust aerosols with low AEs over Ansai by the data assimilation. The strong effect of the data assimilation on R and the S is obvious as they rise from 0.36 to 0.92 and from 0.67 to 0.96, respectively. This indicates that the data assimilation can better reproduce the temporal variation of AE over Ansai site. For the Fukang site ( Fig. 4 b), the observed AEs are larger overall than the standard and assimilated results, which may be related to the overestimated contribution of the coarse dust aerosols with a lower AE (Dai et al., 2014a ), and the underestimated fine mode aerosols by the model. The data assimilation has little effect on R and a slightly negative effect on S because of the larger deviation between the assimilated and observed AEs, caused by the higher NRL MODIS AOD ( Fig. 3 b). For the Shapotou site in Fig. 4 c, the data assimilation slightly improved the AE values, which may be related to the limited MODIS AOD assimilated. The AE (Fig. 4 c) and AOD (Fig. 3 c) of the assimilation experiment are both lower than the corresponding observations, and this may be caused by the smaller aerosol burden (Fig. 2 c) and the overestimated contribution of the coarse dust aerosol with a lower AE (Dai et al., 2014a ) at this site. While there are shortcomings in both experiments regarding the correlation coefficient R , AE with the data assimilation produces standard deviations that were close to that of the observed AE except for 2, 6, 28 and 30 April, which leads to improved S .
|
|
|
Fig. 4. Temporal variation of the Ångstrüm Exponent (AE) (0:00, 6:00, 12:00 and 18:00 UTC during one day) for April 2006 at CSHNET sites in (a) Ansai, (b) Fukang, (c) Shapotou. Blue and red curves represent for model results without and with assimilation, respectively; black dots denote the CSHNET observations; M = monthly mean value; w/o = model without assimilation; w/a = model with assimilation; obs = observation; S = model skill score; R = correlation coefficient between the simulations and observations. |
3.4. AOD spatial grid distribution
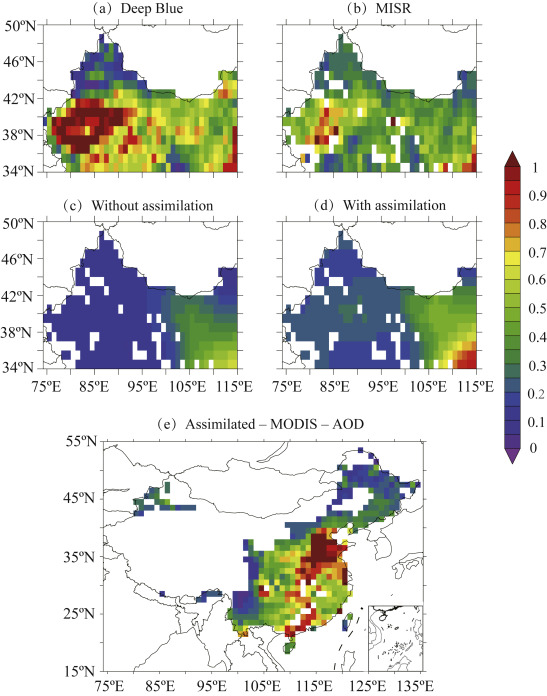
Fig. 5 (a) and (b) show the spatial distribution of the aerosol AOD at 550 nm from the Collection 6 MODIS Terra Deep Blue and the total-column AOD from the MISR Level 3 retrieval over Northwest China, respectively. Fig. 5 (c) and (d) are the corresponding model AOD spatial distributions at 550 nm without and with the data assimilation, respectively. The standard simulated aerosol AODs are significantly underestimated over the Tarim Basin and Junggar southern margin-Turpan in Fig. 5 (c), while the underestimation is improved to some extent especially over the regions where the AODs are low (about 0–0.30). Also, the spatial distribution pattern of the AODs can be better reproduced with the data assimilation (Fig. 5 d) compared with the corresponding standard results. Considering the limited NRL MODIS AODs that have been assimilated over the Junggar Basin and that no data existed over other desert areas of northwest China (Fig. 5 e), much useful information for the data assimilation has been obtained in this study from the surrounding areas within the local patch size of 1500 km. Therefore, the improvement resulting from the data assimilation is acceptable, especially compared with the MISR AODs.
|
|
|
Fig. 5. Spatial distributions of monthly co-located experiment and MODIS/MISR AOD over the Chinese desert region for April 2006. (a) AOD of Terra_Deep Blue at 550 nm; (b) AOD of MISR Level 3 at 555 nm; (c) AOD of model without assimilation; (d) AOD of model with assimilation; (e) AOD of NRL MODIS for assimilation. |
4. Conclusion
The impact of the LETKF assimilation system is demonstrated by application to aerosol surface mass concentration and aerosol optical properties simulations with NICAM-SPRINTARS model over the Chinese desert during April 2006. The assimilation system is successfully validated against independent observations. Compared with the independent PM10 surface mass concentrations, the simulations are substantially improved and the peak values are correctly adjusted by assimilating the MODIS AOD data over the Ansai and Shapotou sites, leading to improved R and S . The PM10 concentration is underestimated and R is slightly decreased over Fukang site, which is related to the complex and time-varying dominant aerosol types. Data assimilation has a strong positive influence on the AOD simulation and better reproduces the temporal variations of AOD with higher R and S , except for the Fukang site, which showed slightly decreased S , caused by the higher MODIS AODs being assimilated. While for the AE, the performance is not so good except for the Ansai site where more available MODIS AODs can be assimilated showing much improved R and S . Considering the limited improvement on AE, this encourages us to assimilate AE observations in further studies. The AOD spatial distribution illustrates that grids of AODs with assimilation are closer to the observations, especially over areas where AODs are low (<0.30).
Acknowledgments
This research is supported by the funds from the National Natural Science Funds of China (41475031 , 41130104 ), the Public Meteorology Special Foundation of MOST (GYHY201406023 ), the special fund of State Key Joint Laboratory of Environment Simulation and Pollution Control (15K02ESPCP ), the JAXA/EarthCARE , the MEXT/VL for Climate System Diagnostics, the MOE/Global Environment Research Fund S-12 (14426634 ) and A-1101 , the NIES/GOSAT , the NIES/CGER , and the MEXT/RECCA/SALSA . The authors express their sincere thanks to the NASA MODIS team for preparing and making available MODIS observations and the NRL data for assimilation as well as the Deep Blue data. We are grateful to the entire MISR team. We also thank Dr. GUO Yuan-Xi for offering the gridded daily PM10 concentrations with the resolution of 0.5° × 0.5° in China during 2000–2010 and Prof. WANG Yue-Si for the observations of the Chinese Sun Hazemeter Network standard network established in China.
References
- Adhikary et al., 2008 B. Adhikary, S. Kulkarni, A. Dallura, et al.; A regional scale chemical transport modeling of Asian aerosol with data assimilation of AOD observations using optimal interpolation technique; Atmos. Environ., 42 (37) (2008), pp. 8600–8615
- Benedetti et al., 2009 A. Benedetti, J.J. Morcrette, O. Boucher, et al.; Aerosol analysis and forecast in the European Centre for Medium-Range Weather Forecasts Integrated Forecast System: 2. Data assimilation; J. Geophys. Res., 114 (D13) (2009) http://dx.doi.org/10.1029/2008JD011115
- Che et al., 2013 H. Che, Y. Wang, J. Sun, et al.; Variation of aerosol optical properties over the Taklimakan Desert of China; Aerosol Air Qual. Res., 13 (2013), pp. 777–785
- Chin et al., 2009 M. Chin, T. Diehl, O. Dubovik, et al.; Light absorption by pollution, dust, and biomass burning aerosol: a global model study and evaluation with AERONET data; Ann. Geophys., 27 (9) (2009), pp. 3439–3464
- Collins et al., 2001 W.D. Collins, P.J. Rasch, B.E. Eaton, et al.; Simulating aerosols using a chemical transport model with assimilation of satellite aerosol retrievals: methodology for INDOEX; J. Geophys. Res., 106 (D7) (2001), pp. 7313–7336
- Dai et al., 2014a T. Dai, D. Goto, N.A.J. Schutgens, et al.; Simulated aerosol key optical properties over global scale using an aerosol transport model coupled with a new type of dynamic core; Atmos. Environ., 82 (2014), pp. 71–82
- Dai et al., 2014b T. Dai, N.A.J. Schutgens, D. Goto, et al.; Improvement of aerosol optical properties modeling over Eastern Asia with MODIS AOD assimilation in a global non-hydrostatic icosahedral aerosol transport model; Environ. Pollut., 195 (2014), pp. 319–329
- Dai et al., 2015 T. Dai, G.Y. Shi, T. Nakajima; Analysis and evaluation of the global aerosol optical properties simulated by an online aerosol-coupled non-hydrostatic icosahedral atmospheric model; Adv. Atmos. Sci., 32 (6) (2015), pp. 743–758 http://dx.doi.org/10.1007/s00376-014-4098-z
- Diner et al., 2001 D.J. Diner, W.A. Abdou, C.J. Bruegge, et al.; MISR aerosol optical depth retrievals over southern Africa during the SAFARI-2000 dry sea-son campaign; Geophys Res. Lett., 28 (16) (2001), pp. 3127–3130
- Evensen, 1994 G. Evensen; Sequential data assimilation with a nonlinear quasi-geostrophic model using Monte Carlo methods to forecast error statistics; J. Geophys. Res., 99 (C5) (1994), pp. 10143–10162
- Forster et al., 2007 P. Forster, V. Ramaswamy, P. Artaxo, et al.; Changes in atmospheric constituents and in radiative forcing; S. Solomon (Ed.), et al. , Climate Change 2007: the Physical Science Basis. Contribution of Working Group I to the Fourth Assessment Report of the Intergovernmental Panel on Climate Change, Cambridge Univ. Press, Cambridge (2007), pp. 129–234
- Generoso et al., 2007 S. Generoso, F. Bŕeon, F. Chevallier, et al.; Assimilation of POLDER aerosol optical thick-ness into the LMDz-INCA model: implications for the arctic aerosol burden; J. Geophys. Res., 112 (D2) (2007), p. D02311
- Guo, 2014 Y.X. Guo; Retrieval and Estimation of Gridded Daily PM10 Concentrations With 0.5° Resolution in China During 2000–2010; (Ph.D. thesis) Beijing Normal University, China (2014) (in Chinese)
- Henzing, 2005 B. Henzing; Aerosol Modelling: Spatial Distribution and Effects on Radiation; (Ph.D. thesis) Technical University Eindhoven, Netherlands (2005)
- Hsu et al., 2013 N.C. Hsu, M.J. Jeong, C. Bettenhausen, et al.; Enhanced Deep Blue aerosol retrieval algorithm: the second generation; J. Geophys. Res. Atmos., 118 (16) (2013), pp. 9296–9315
- Hunt et al., 2007 B.R. Hunt, E.J. Kostelich, I. Szunyogh; Efficient data assimilation for spatiotemporal chaos: a local ensemble transform Kalman filter; Phys. D. Nonlinear Phenom., 230 (1) (2007), pp. 112–116
- Kahn et al., 2010 R.A. Kahn, B.J. Gaitley, M.J. Garay, et al.; Multiangle Imaging spectroradiometer global aerosol product assessment by comparison with the aerosol robotic network; J. Geophys Res., 115 (D23) (2010) http://dx.doi.org/10.1029/2010JD014601
- Levy et al., 2013 R.C. Levy, S. Mattoo, L.A. Munchak, et al.; The Collection 6 MODIS aerosol products over land and ocean; Atmos. Meas. Tech., 6 (11) (2013), pp. 2989–3034
- Liu et al., 2004 Y. Liu, J.A. Sarnat, B.A. Coull, et al.; Validation of multiangle imaging spectroradiometer (MISR) aerosol optical thickness measurements using aerosol robotic network (AERONET) observations over the contiguous United States; J. Geophys Res., 109 (D6) (2004) http://dx.doi.org/10.1029/2003JD003981
- Liu et al., 2010 J. Liu, X. Xia, Z. Li, et al.; Validation of multi-angle imaging spectroradiometer aerosol products in China; TellusSer B, 62 (2) (2010), pp. 117–124
- Liu et al., 2011 Z.Q. Liu, Q.H. Liu, H.C. Lin, et al.; Three-dimensional variational assimilation of MODIS aerosol optical depth: implementation and application to a dust storm over East Asia; J. Geophys. Res. Atmos., 116 (D23) (2011) http://dx.doi.org/10.1029/2011JD016159
- Ma et al., 2016 Z.-W. Ma, X.-F. Hu, A.M. Sauer, et al.; Satellite-based spatiotemporal trends in PM2.5 concentrations: China, 2004–2013; Environ. Health Perspect., 124 (2) (2016), pp. 184–192 http://dx.doi.org/10.1289/ehp.1409481s
- Niu et al., 2008 T. Niu, S.-L. Gong, G.F. Zhu, et al.; Data assimilation of dust aerosol observations for the CUACE/dust forecasting system; Atmos. Chem. Phys., 8 (13) (2008), pp. 3473–3482
- Pagowski et al., 2014 M. Pagowski, Z. Liu, G.A. Grell, et al.; Implementation of aerosol assimilation in gridpoint statistical interpolation (v. 3.2) and WRF-Chem (v. 3.4.1); Geosci. Model Dev., 7 (2014), pp. 1621–1627
- Sayer et al., 2013 A.M. Sayer, N.C. Hsu, C. Bettenhausen, et al.; Validation and uncertainty estimates for MODIS Collection 6 “Deep Blue” aerosol data; J. Geophys. Res. Atmos., 118 (14) (2013), pp. 7864–7872 http://dx.doi.org/10.1002/jgrd.50600
- Schutgens et al., 2010a N.A.J. Schutgens, T. Miyoshi, T. Takemura, et al.; Applying an ensemble Kalman filter to the assimilation of AERONET observations in a global aerosol transport model; Atoms. Chem. Phys., 10 (5) (2010), pp. 2561–2576
- Schutgens et al., 2010b N.A.J. Schutgens, T. Miyoshi, T. Takemura, et al.; Sensitivity tests for an ensemble Kalman filter for aerosol assimilation; Atmos. Chem. Phys., 10 (14) (2010), pp. 6583–6600 http://dx.doi.org/10.5194/acp-10-6583-2010
- Suzuki et al., 2008 K. Suzuki, T. Nakajima, M. Satoh, et al.; Global cloud-system-resolving simulation of aerosol effect on warm clouds; Geophys. Res. Lett., 35 (19) (2008)
- Takemura and Nakajima, 2002 T. Takemura, T. Nakajima; Single-scattering albedo and radiative forcing of various aerosol species with a global three-dimensional model; J. Clim., 15 (4) (2002), pp. 333–352
- Takemura et al., 2000 T. Takemura, H. Okamoto, Y. Maruyama, et al.; Global three-dimensional simulation of aerosol optical thickness distribution of various origins; J. Geophys. Res., 105 (D14) (2000), pp. 17853–17873
- Takemura et al., 2009 T. Takemura, M. Egashira, K. Matsuzawa, et al.; A simulation of the global distribution and radiative forcing of soil dust aerosol at the last glacial maximum; Atmos. Chem. Phys., 9 (9) (2009), pp. 3061–3073
- Taylor, 2001 K.E. Taylor; Summarizing multiple aspects of model performance in a single diagram; J. Geophys. Res., 106 (D7) (2001), pp. 7183–7192
- van Donkelaar et al., 2010 A. van Donkelaar, R.V. Martin, M. Brauer, et al.; Global estimates of ambient fine particulate matter concentrations from satellite-based aerosol optical depth: development and application; Environ. Health Perspect., 118 (6) (2010), pp. 847–855
- van Donkelaar et al., 2015 A. van Donkelaar, R.V. Martin, M. Brauer, et al.; Use of satellite observations for long-term exposure assessment of global concentrations of fine particulate matter; Environ. Health Perspect., 123 (2) (2015), pp. 135–143
- Wang and Niu, 2013 H. Wang, T. Niu; Sensitivity studies of aerosol data assimilation and direct radiative feedbacks in modeling dust aerosols; Atmos. Environ., 64 (2013), pp. 208–218
- Wang et al., 2012 J. Wang, X.G. Xu, D.K. Henze; Top-down estimate of dust emissions through integration of MODIS and MISR aerosol retrievals with the GEOS-Chem adjoint model; Geophys. Res. Lett., 39 (8) (2012)
- Whitaker and Hamill, 2002 J. Whitaker, T. Hamill; Ensemble data assimilation without perturbed observations; Mon. Weather Rev., 130 (2002), pp. 1913–1924
- Xin et al., 2007 J. Xin, Y. Wang, P. Wang, et al.; Aerosol optical depth (AOD) and Ångström exponent of aerosols observed by the Chinese Sun Hazemeter Network from August 2004 to September 2005; J. Geophys. Res., 112 (D5) (2007)
- Yu et al., 2003 H. Yu, R.E. Dickinson, M. Chin, et al.; Annual cycle of global distributions of aerosol optical depth from integration of MODIS retrieval and GOCART model simulations; J. Geophys. Res., 108 (D3) (2003)
- Yu et al., 2015 J. Yu, H. Che, Q. Chen, et al.; Investigation of aerosol optical depth (AOD) and Ångström exponent over the desert region of northwestern China based on measurements from the China Aerosol Remote Sensing Network (CARSNET); Aerosol Air Qual. Res., 15 (2015), pp. 2024–2036
- Zhang and Reid, 2006 J. Zhang, J.S. Reid; MODIS aerosol product analysis for data assimilation: assessment of over-ocean level 2 aerosol optical thickness retrievals; J. Geophys. Res., 111 (D22) (2006)
- Zong et al., 2015 X. Zong, X. Xia, H. Che; Validation of aerosol optical depth and climatology of aerosol vertical distribution in the Taklimakan Desert; Atmos. Pollut. Res., 6 (2) (2015), pp. 239–244
Document information
Published on 15/05/17
Submitted on 15/05/17
Licence: Other
Share this document
Keywords
claim authorship
Are you one of the authors of this document?
