Abstract
The present paper makes an effort to find the flow separation characteristics under high Reynolds number in pipe bends. Single phase turbulent flow through pipe bends is investigated using k-ε turbulence model. After the validation of present model against existing experimental results, a detailed study has been performed to study the influence of Reynolds number on flow separation and reattachment. The separation region and the velocity field of the primary and the secondary flows in different sections have been illustrated. Numerical results show that flow separation can be clearly visualized for bend with low curvature ratio. Distributions of the velocity vector show the secondary motion clearly induced by the movement of fluid from inner to outer wall of the bend leading to flow separation. This paper provides numerical results to understand the flow characteristics of fluid flow in 90° bend pipe.
Keywords
90° pipe bend ; k-ε turbulence model ; Turbulent flow ; Flow separation
1. Introduction
Pipe bends are the most important part of any pipeline network system as these provide flexibility in routing. Investigations of the flow through bends are of great significance in understanding and improving their performance and minimizing the losses. It is already well known that the flow of incompressible viscous fluids through pipe bends is characterized by flow separation, secondary flow and unsteadiness, which are dependent on Reynolds number as well as the radius of curvature of the bend. Whenever a fluid flows through a bend, there is a radial pressure gradient developed by the centrifugal force acting on the fluid. Because of this, a double spiral flow field and a pair of counter-rotating vortices can also be observed inside the bend i.e. because of the presence of pressure gradient, fluid at the centre of pipe moves towards the outer side and comes back along the wall towards the inner side. Now if the bend curvature ratio is very small (Rc/D ≤ 1.5), the adverse pressure gradient near the inner wall and immediately downstream of the bend may lead to flow separation, giving rise to a large increase in pressure losses [1] , [2] and [3] . However, the flow characteristics of incompressible flows in pipe bends are not fully clarified yet. Accurate estimation of mass flow rate and losses is critical for most incompressible flow systems. The applications of water-flows through pipe bends are found in many engineering applications. Some of the excellent reviews bear testimony to this fact. A number of researchers have investigated turbulent flows in pipe bends by means of theoretical, experimental and numerical methods [4] , [5] , [6] , [7] , [8] and [9] . To perform numerical simulation of fluid flow in curved pipes, on the other hand, the Navier–Stokes equation has to be expressed in curvilinear or body fitted coordinate system. A very useful database for direct numerical simulation (DNS) and large eddy simulation (LES) on pipe bend is provided by two studies [10] and [11] . Recently, in the nuclear sector due to the fatigue by the unsteady motion of the vortices, this has also attracted the interest of the researchers [2] , [12] and [13] . Hence, it is interesting to see the flow separation and reattachment under high Reynolds number. Micro and nano size particle erosion in 90° pipe bend and over the backward-facing steps were studied numerically [14] , [15] , [16] , [17] and [18] . Very recently, studies on turbulent mixed convection heat transfer [19] , [20] , [21] , [22] , [23] , [24] and [25] attracted the interest of investigators; many researchers used Lattice Boltzmann methods to solve natural convection heat transfer problem [26] and [27] . Magneto hydrodynamic flow (MHD) has attracted much interest of researchers in recent years due to the effect of magnetic field on the boundary layer flow control [28] , [29] , [30] , [31] , [32] and [33] . Different exact and approximate techniques have also been used to solve the different problems in fluid mechanics [34] , [35] , [36] , [37] and [38] . In this paper, the flow separation in the most common 90° pipe bend is studied by numerical methods based on computational fluid dynamics. The paper is structured in the following fashion. Section 1 gives a brief idea on the previous research works and motivation for the present work. Section 2 contains the necessary theoretical background. Problem definition with validation is provided in section 3 . Section 4 contains the study on various parameters affecting the flow pattern and is followed by summary bulletin of the study under section 5 .
2. Governing equations and numerical methodology
Three dimensional Reynolds Averaged Navier–Stokes (RANS) equations are solved using the segregated implicit solver. The right choice of a turbulence model is critical when an industrial turbulent flow problem is faced, especially when this problem involves three dimensional flow phenomena, which needs an accurate modelling. The second order scheme is used for the U-RANS equations calculations, with a pressure velocity coupling achieved using SIMPLE algorithm. The time step size used in the present study is 0.001 s with 1000 time steps. The default under relaxation factors were used to aid convergence for all models.
The governing equations for incompressible fluid flow with constant properties are
|
|
( 1) |
|
|
( 2) |
Equations (1) and (2) are conservations of mass and momentum, respectively; fi is a vector representing external forces, υ is the kinematic viscosity.
2.1. Turbulence model
It is well known that turbulent flows are basically designated by the fluctuations of the velocity fields. Different transported quantities such as momentum, energy, etc. also fluctuate for this fluctuation of velocity field and these fluctuations can be of very high frequency and small scale; they are very difficult and computationally crucial to analyse directly in industrial engineering calculations. The turbulence model needs to be selected based on some considerations, e.g., the physics of the flow, the insight into the capabilities and limitations of turbulence models, the attempt for the specific problem by other researchers, the accuracy needed, the available computational resources, and time.
The k-ε turbulence model is adopted for the present study as k-ε turbulence model performs better for both single-phase and two-phase flows in pipe bend [3] , [39] , [40] , [41] , [42] and [43] . In this model, the turbulence kinetic energy (k ) and the turbulence dissipation rate (ε ) are solved to determine the coefficient of turbulent viscosity (µt ).
Transport equation for k-epsilon
|
|
( 3) |
|
|
( 4) |
where represents velocity component in corresponding direction, represents component of rate of deformation, and represents eddy viscosity.
Equations (3) and (4) also consist of some adjustable constants [44] ; these are as follows
|
|
3. Problem definition
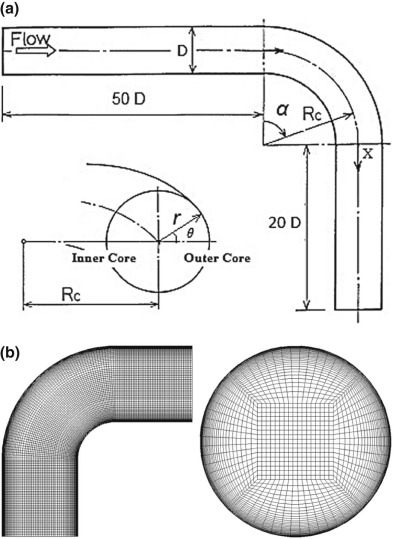
The problem that is considered here is the fluid flow through 90° pipe bends having inner diameter of 0.01 m with curvature ratio (Rc/D ) = 1 for different Reynolds numbers ranging from 1 × 10⁵ to 10 × 105 . The inlet length of straight pipe in the calculations was set up 50D for all cases to save computational time. The fluid medium was air having density (ρ ) of 1.2647 kg/m3 and dynamic viscosity (µ ) of 1.983 × 10⁻⁵ kg/m-s for validation purpose and water having density (ρ ) of 990.2 kg/m3 and dynamic viscosity (µ ) of 0.0006 kg/m-s for the present study with working temperature of 300 K in both cases. Three dimensional structured mesh was used containing hexahedron elements, which was optimized via a grid-independence study. The bend geometry and mesh are shown in Fig. 1a and b respectively. It is defined that the axial direction downstream the bend is x-coordinate, the direction from inner core to outer core of the bend is y-coordinate and the perpendicular direction to x and y is z-coordinate.
|
|
|
Fig. 1. Schematic diagram of the bend geometry and present model with computational grid. |
3.1. Validation
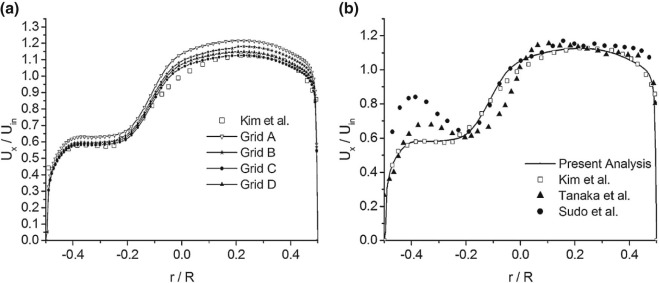
At the very beginning of our study, our model and simulation setup are first validated against the existing experimental and numerical data in References [3] , [7] and [45] . For that intension, same geometrical configuration is adopted. In their experiment, the authors of the previously mentioned studies used a circular cross sectioned 90° bend with a curvature ratio (Rc /D ) of 2 and the measurements of velocities were performed at a Reynolds number of 6 × 10⁴ . For the validation of our present model, the simulation is performed on a computational mesh containing total 2.85 million hexahedron elements, which was optimized via a grid-independence study, see Fig. 1a . The value of non-dimensional distance from wall (Y+ ) is strictly controlled using standard wall treatment function (30 < Y+ < 90 for a near wall cell used for present study). The mean axial velocity profile normalized with inlet velocity along symmetry line at bend outlet (α = 90°) shows very good agreement with both experimental and numerical results [3] , [7] and [45] , see Fig. 2b . In the inner core region of the bend (negative X-axis in Fig.), some discrepancies between experimental and numerical data are observed. This discrepancies may arise due to the adverse pressure gradient near the inner wall of the bend and this is also consistent with a recent study [3] . From the validation part, it has been seen that the model is in close approximation with the published results; hence, this procedure of mesh generation and simulation set up has been used for further analysis.
|
|
|
Fig. 2. Comparison of normalized axial velocity profile of present analysis with published experimental and numerical results. |
4. Results and discussions
The main objective of the present study is to characterize the effect of Reynolds number on flow separation of single phase turbulent flow in a 90° pipe bend through numerical simulation. The results of the mean velocity profile, velocity fluctuation and separation reattachment points for different Reynolds numbers along the different positions of the bend in central symmetry plane are presented in this section.
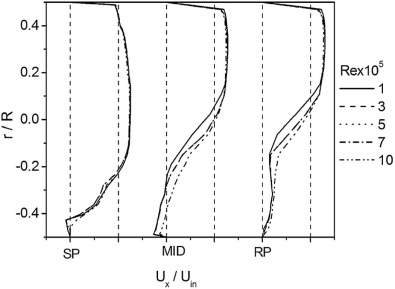
Fig. 3 shows the mean velocity profile normalized with inlet velocity (Uin ) for different Reynolds numbers (Re = 1 × 10⁵ to 10 × 105 ). The negative r values represent the inner core of the bend and SP, RP, MP represent positions of separation point, reattachment point, middle point between separation and reattachment points respectively. Velocity acceleration is depicted at the outer core of the bend as expected. It is found that with the increase of Reynolds number, the velocity profile at the inner core of the pipe bend tries to recover its fully developed shape by decelerating and accelerating effects at the outer and the inner parts of the pipe bend respectively. Hence, it may be speculated for higher values of the Reynolds number that pipe curvature effects are reducing.
|
|
|
Fig. 3. Normalized velocity profiles at different positions in the bend for different Re . |
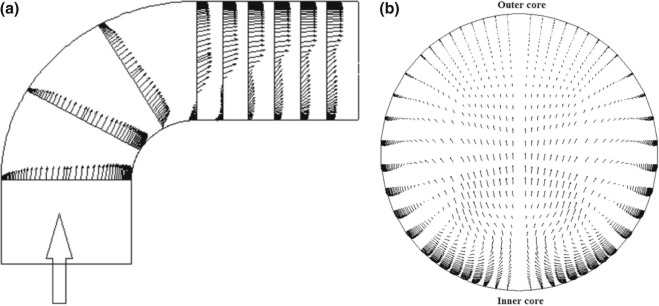
Fig. 4 shows the normalized flow velocity vector fields at the central plane and at the bend outlet (α = 90°) for Re = 1 × 10⁵ , Rc/D = 1. The mean velocity is shifted upward due to the faster moving fluid near the outer core as expressed in Reference [7] . Secondary flow pattern can clearly be observed in this section. At the inner core of the bend, a region having very low velocity was found and the flow was highly unsteady and complex.
|
|
|
Fig. 4. Normalized velocity vector field for Re = 1 × 10⁵ and Rc/D = 1. (a) Symmetry plane (centre cross section). (b) Cross section at bend outlet (∝ = 90°). |
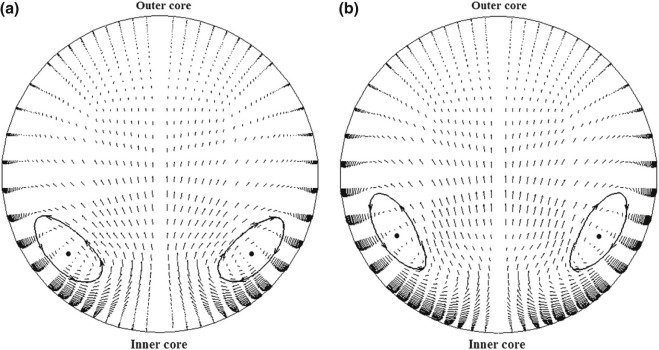
Fig. 5 shows the normalized velocity fields for two different Reynolds numbers (Re = 1 × 10⁵ & 10 × 105 ) at the bend outlet. The top of the each figure is the outer core of the bend and the bottom is the inner core of the bend. The low velocity region near the inner core of the bend was seen clearly. This region is concluded to be the separated region [46] . Because of the relation between the centrifugal force with high velocity and pressure gradient on the flow, two identical counter rotating Dean vortices were also found for both Reynolds numbers.
|
|
|
Fig. 5. Normalized velocity vector field. (a) Re = 1 × 10⁵ . (b) Re = 10 × 105 . |
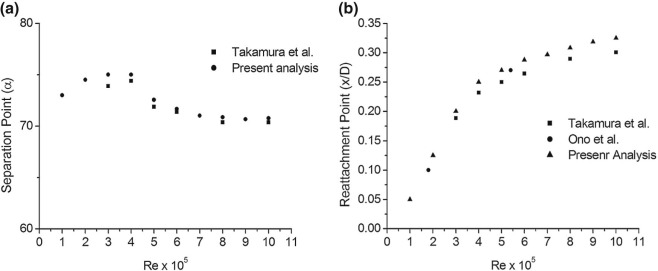
As mentioned above, a flow separation region was found at the inner core of bend outlet; another study has been made to understand the dependency of separation and reattachment points on Reynolds number. Fig. 6 shows various starting points of flow separation from the bend inlet and corresponding reattachment points from the bend outlet. It was found that the starting point of flow separation moves upstream in the bend as Reynolds number increases, while the reattachment point moves downstream. This trend corresponds to the dependency of Reynolds number on the total pressure loss [45] and consistent with experimental results in References [2] and [13] .
|
|
|
Fig. 6. Dependency of separation and reattachment points on Reynolds number. (a) Separation points. (b) Reattachment points. |
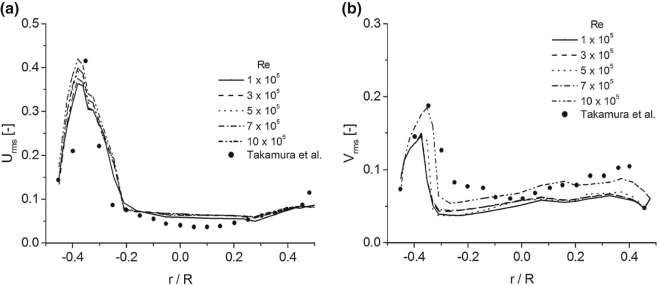
The rms velocity fluctuations at bend outlet in the x and y directions are depicted in Fig. 7 for bend with Rc/D = 1 at different Reynolds numbers. Non-dimensional fluctuating velocities Urms and Vrms , normalized by the mean flow velocity in x and y directions respectively. Negative values of r represent the inner core of the bend. It is found that velocity fluctuation is maximum in both x and y directions at the separation region; however, the intensity of fluctuation is higher in the x direction. The Urms profiles do not show much Reynolds number dependency, the peak position is almost same for all measurements but the peak value is high for higher Reynolds number. For the Vrms profiles, a clear Reynolds number dependency can be observed. The peak value becomes larger and shifted from the inner core towards the centre of the bend with increasing Reynolds number.
|
|
|
Fig. 7. rms profiles of velocity fluctuations at the bend outlet. (a) rms in x direction. (b) rms in y direction. |
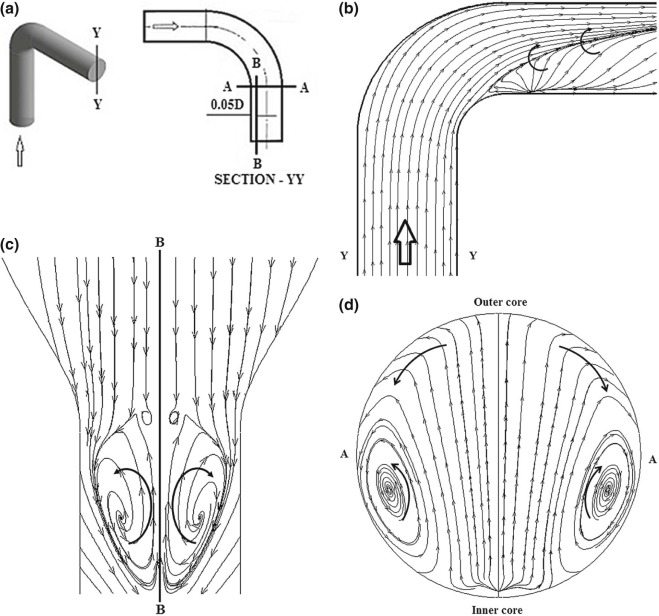
As mentioned earlier, a very complicated fluid structure is formed at the downstream of bend outlet due to the flow fluctuation induced by the movement separation region and the acceleration of flow velocity. Fig. 8a–d shows the complex flow motions in the bend. Fig. 8a describes the three cross sectional planes for the flow visualizations. Three types of flow motions are observed. Takamura et al. [2] studied these three motions by statistical analysis (frequency analysis) in terms of Strouhal number (St) and explained as vortices motion with St ≈ 1.0 (Fig. 8b ), separated vortices shedding with St ≈ 0.5 (Fig. 8c ) and circumferential motion with St ≈ 0.5 (Fig. 8c ).
|
|
|
Fig. 8. Complex flow structure in the pipe bend. (a) Cross sectional planes for flow visualization. (b) Flow at symmetry plane. (c) Flow in separated region. (d) Circumferential flow from outer core to inner core. |
5. Conclusions
Turbulent flow of single phase incompressible fluid through 90° pipe bend has been simulated numerically using k-ε turbulent model in the present study. The validation of 3D models used for the present study with experiments reported in Reference [7] and numerical works in References [3] and [45] indicates a good agreement. The following conclusions can be made from the present study:
- It is found that with the increase of Reynolds number, the velocity profile at the inner core of the pipe bend tries to recover its fully developed shape by decelerating and accelerating effects at the outer and the inner parts of the pipe bend respectively. Hence, it may be speculated for higher values of the Reynolds number that pipe curvature effects are reducing. The separation region for all bends was generated and a clear Reynolds number dependency on flow separation was found. As Reynolds number increased, the separation point moved towards the upstream, while the reattachment point moved towards downstream of the bend. A low velocity region was found near the inner core of the bend leading to the flow separation. Two counter rotating Dean vortices were formed at the bend outlet.
- The rms of the velocity fluctuation in x direction of flow has no significant Reynolds number dependence, the peak value and the position of the peak value are nearly the same for different Reynolds numbers; however, the peak value was observed for the highest Reynolds number. For the rms profile in y direction, a little Reynolds number dependence can be observed. With increasing Reynolds number, the peak value becomes larger and situated further from the wall. Overall velocity fluctuation became larger in the separation region near the inner core of the bend; however, the intensity of fluctuation in x direction is lower than that of y direction. The flow became very complex, unsteady and coherent at the downstream of the bend due to the flow separation showing three flow motions.
The above conclusions refer especially for present study range. To provide a correlation between the separation region, curvature ratio and the Reynolds number, additional studies is required with different Reynolds numbers and curvature ratio and will remain for future work.
References
- [1] L.H. Hellström, A. Sinha, A.J. Smits; Visualizing the very-large-scale motions in turbulent pipe flow; Phys. Fluids, 23 (1) (2011), p. 011703
- [2] H. Takamura, S. Ebara, H. Hashizume, K. Aizawa, H. Yamano; Flow visualization and frequency characteristics of velocity fluctuations of complex turbulent flow in a short elbow piping under high Reynolds number condition; J. Fluids Eng, 134 (10) (2012), p. 101201
- [3] J. Kim, M. Yadav, S. Kim; Characteristics of secondary flow induced by 90-degree elbow in turbulent pipe flow; Eng. Appl. Comput. Fluid Mech, 8 (2) (2014), pp. 229–239
- [4] P.L. Spedding, E. Benard, G.M. McNally; Fluid flow through 90 degree bends; Dev. Chem. Eng. Miner. Process, 12 (1–2) (2004), pp. 107–128
- [5] P. Naphon, S. Wongwises; A review of flow and heat transfer characteristics in curved tubes; Renew. Sustain. Energy Rev, 10 (5) (2006), pp. 463–490
- [6] N. Crawford, S. Spence, A. Simpson, G. Cunningham; A numerical investigation of the flow structures and losses for turbulent flow in 90 elbow bends; Proc. Inst. Mech. Eng, Part E: J. Process Mech. Eng, 223 (1) (2009), pp. 27–44
- [7] K. Sudo, M. Sumida, H. Hibara; Experimental investigation on turbulent flow in a circular-sectioned 90-degree bend; Exp. Fluids, 25 (1) (1998), pp. 42–49
- [8] A. Kalpakli, R. Örlü; Turbulent pipe flow downstream a 90 pipe bend with and without superimposed swirl; Int. J. Heat Fluid Flow, 41 (2013), pp. 103–111
- [9] P. Dutta, N. Nandi; Study on pressure drop characteristics of single phase turbulent flow in pipe bend for high Reynolds number; ARPN J. Eng. Appl. Sci, 10 (5) (2015), pp. 2221–2226
- [10] T.J. Hüttl, R. Friedrich; Direct numerical simulation of turbulent flows in curved and helically coiled pipes; Comput. Fluids, 30 (5) (2001), pp. 591–605
- [11] A. Noorani, G.K. El Khoury, P. Schlatter; Evolution of turbulence characteristics from straight to curved pipes; Int. J. Heat Fluid Flow, 41 (2013), pp. 16–26
- [12] J. Sakakibara, N. Machida; Measurement of turbulent flow upstream and downstream of a circular pipe bend; Phys. Fluids, 24 (4) (2012), p. 041702
- [13] A. Ono, N. Kimura, H. Kamide, A. Tobita; Influence of elbow curvature on flow structure at elbow outlet under high Reynolds number condition; Nucl. Eng. Des, 241 (11) (2011), pp. 4409–4419
- [14] M.R. Safaei, O. Mahian, F. Garoosi, K. Hooman, A. Karimipour, S.N. Kazi, et al.; Investigation of micro-and nanosized particle erosion in a 90° pipe bend using a two-phase discrete phase model; ScientificWorldJournal, 2014 (2014) Article ID 740578
- [15] S. Shamshirband, A. Malvandi, A. Karimipour, M. Goodarzi, M. Afrand, D. Petković, et al.; Performance investigation of micro-and nano-sized particle erosion in a 90 elbow using an ANFIS model; Powder Technol, 284 (2015), pp. 336–343
- [16] M.R. Safaie, B. Rahmanian, M. Goodarzi; Investigation of the coal diameter effect on pulverized coal combustion for pollutant reduction; J. Math. Comput. Sci, 12 (2014), pp. 143–151
- [17] H. Togun, M.R. Safaei, R. Sadri, S.N. Kazi, A. Badarudin, K. Hooman, et al.; Numerical simulation of laminar to turbulent nanofluid flow and heat transfer over a backward-facing step; Appl. Math. Comput, 239 (2014), pp. 153–170
- [18] H. Togun, G. Ahmadi, T. Abdulrazzaq, A.J. Shkarah, S.N. Kazi, A. Badarudin, et al.; Thermal performance of nanofluid in ducts with double forward-facing steps; J. Taiwan Inst. Chem. Eng, 47 (2015), pp. 28–42
- [19] R. Davarnejad, M. Jamshidzadeh; CFD modeling of heat transfer performance of MgO-water nanofluid under turbulent flow; Eng. Sci. Technol. Int. J., 18 (4) (2015), pp. 536–542
- [20] H. Yarmand, S. Gharehkhani, S.N. Kazi, E. Sadeghinezhad, M.R. Safaei; Numerical investigation of heat transfer enhancement in a rectangular heated pipe for turbulent nanofluid; ScientificWorldJournal, 2014 (2014), p. 369593
- [21] M. Safaei, M. Goodarzi, M. Mohammadi; Numerical modeling of turbulence mixed convection heat transfer in air filled enclosures by finite volume method; Int. J. Multiphys, 5 (4) (2011), pp. 307–324
- [22] M.R. Safaei, H. Togun, K. Vafai, S.N. Kazi, A. Badarudin; Investigation of heat transfer enhancement in a forward-facing contracting channel using FMWCNT nanofluids; Numer. Heat Transfer Part A Appl, 66 (12) (2014), pp. 1321–1340
- [23] S. Eiamsa-ard, K. Kiatkittipong, W. Jedsadaratanachai; Heat transfer enhancement of TiO2 /water nanofluid in a heat exchanger tube equipped with overlapped dual twisted-tapes ; Eng. Sci. Technol. Int. J., 18 (3) (2015), pp. 336–350
- [24] A. Karimipour, M. Afrand, M. Akbari, M.R. Safaei; Simulation of fluid flow and heat transfer in the inclined enclosure; Int. J. Mech. Aerosp. Eng, 6 (2012), pp. 86–91
- [25] M. Goodarzi, M.R. Safaei, H.F. Oztop, A. Karimipour, E. Sadeghinezhad, M. Dahari, et al.; Numerical study of entropy generation due to coupled laminar and turbulent mixed convection and thermal radiation in an enclosure filled with a semitransparent medium; ScientificWorldJournal, 2014 (2014) Article ID 761745
- [26] B. Mliki, M.A. Abbassi, K. Guedri, A. Omri; Lattice Boltzmann simulation of natural convection in an L-shaped enclosure in the presence of nanofluid; Eng. Sci. Technol. Int. J., 18 (3) (2015), pp. 503–511
- [27] M. Goodarzi, M.R. Safaei, A. Karimipour, K. Hooman, M. Dahari, S.N. Kazi, et al.; Comparison of the finite volume and Lattice Boltzmann methods for solving natural convection heat transfer problems inside cavities and enclosures; Abstract and Applied Analysis, 2014 (2014) Hindawi Publishing Corporation http://dx.doi.org/10.1155/2014/762184http://www.hindawi.com/journals/aaa/2014/762184/abs/
- [28] S. Mukhopadhyay, I.C. Mandal; Magnetohydrodynamic (MHD) mixed convection slip flow and heat transfer over a vertical porous plate; Eng. Sci. Technol. Int. J., 18 (1) (2015), pp. 98–105
- [29] S. Das, R.N. Jana, O.D. Makinde; Mixed convective magnetohydrodynamic flow in a vertical channel filled with nanofluids; Eng. Sci. Technol. Int. J., 18 (2) (2015), pp. 244–255
- [30] A. Mahdy, S.E. Ahmed; Thermosolutal Marangoni boundary layer magnetohydrodynamic flow with the Soret and Dufour effects past a vertical flat plate; Eng. Sci. Technol. Int. J., 18 (1) (2015), pp. 24–31
- [31] K. Javaherdeh, M.M. Nejad, M. Moslemi; Natural convection heat and mass transfer in MHD fluid flow past a moving vertical plate with variable surface temperature and concentration in a porous medium; Eng. Sci. Technol. Int. J., 18 (3) (2015), pp. 423–431
- [32] A. Khalid, I. Khan, A. Khan, S. Shafie; Unsteady MHD free convection flow of Casson fluid past over an oscillating vertical plate embedded in a porous medium; Eng. Sci. Technol. Int. J., 18 (3) (2015), pp. 309–317
- [33] M. Hameed, A.A. Khan, R. Ellahi, M. Raza; Study of magnetic and heat transfer on the peristaltic transport of a fractional second grade fluid in a vertical tube; Eng. Sci. Technol. Int. J., 18 (3) (2015), pp. 496–502
- [34] I. Ebtehaj, H. Bonakdari, A.H. Zaji, H. Azimi, F. Khoshbin; GMDH-type neural network approach for modeling the discharge coefficient of rectangular sharp-crested side weirs; Eng. Sci. Technol. Int. J., 18 (4) (2015), pp. 746–757
- [35] F. Selimefendigil, H.F. Öztop; Mixed convection of ferrofluids in a lid driven cavity with two rotating cylinders; Eng. Sci. Technol. Int. J., 18 (3) (2015), pp. 439–451
- [36] P. Valinataj-Bahnemiri, A. Ramiar, S.A. Manavi, A. Mozaffari; Heat transfer optimization of two phase modeling of nanofluid in a sinusoidal wavy channel using Artificial Bee Colony technique; Eng. Sci. Technol. Int. J., 18 (4) (2015), pp. 727–737
- [37] M. Azimi, A. Mozaffari; Heat transfer analysis of unsteady graphene oxide nanofluid flow using a fuzzy identifier evolved by genetically encoded mutable smart bee algorithm; Eng. Sci. Technol. Int. J., 18 (1) (2015), pp. 106–123
- [38] M. Shahrbanozadeh, G.A. Barani, S. Shojaee; Simulation of flow through dam foundation by isogeometric method; Eng. Sci. Technol. Int. J., 18 (2) (2015), pp. 185–193
- [39] G.F. Homicz; Computational Fluid Dynamic Simulations of Pipe Elbow Flow; Department of Energy, USA (2004)
- [40] H. Rahimzadeh, R. Maghsoodi, H. Sarkardeh, S. Tavakkol; Simulating flow over circular spillways by using different turbulence models; Eng. Appl. Comput. Fluid Mech, 6 (1) (2012), pp. 100–109
- [41] P. Dutta, N. Nandi; Effect of Reynolds number and curvature ratio on single phase turbulent flow in pipe bends; Mech. Mech. Eng, 19 (1) (2015), pp. 5–16
- [42] M. Goodarzi, M.R. Safaei, K. Vafai, G. Ahmadi, M. Dahari, S.N. Kazi, et al.; Investigation of nanofluid mixed convection in a shallow cavity using a two-phase mixture model; Int. J. Therm. Sci, 75 (2014), pp. 204–220
- [43] M.R. Safaei, H.R. Goshayeshi, B.S. Razavi, M. Goodarzi; Numerical investigation of laminar and turbulent mixed convection in a shallow water-filled enclosure by various turbulence methods; Sci. Res. Essays, 6 (22) (2011), pp. 4826–4838
- [44] J. Tu, G.H. Yeoh, C. Liu; Computational Fluid Dynamics: A Practical Approach; Butterworth-Heinemann, Oxford, UK (2012)
- [45] M.A. Tanaka, H. Ohshima, H. Monji; Numerical investigation of flow structure in pipe elbow with large eddy simulation approach; in: ASME 2009 Pressure Vessels and Piping Conference, American Society of Mechanical Engineers (2009), pp. 449–458
- [46] T. Shiraishi, H. Watakabe, H. Sago, H. Yamano; Pressure fluctuation characteristics of the short-radius elbow pipe for FBR in the postcritical Reynolds regime; J. Fluid Sci. Technol, 4 (2) (2009), pp. 430–441
Document information
Published on 10/04/17
Licence: Other
Share this document
Keywords
claim authorship
Are you one of the authors of this document?
