1. Introducción
Due to their mechanical performance, lightweight, and adaptability to complicated geometries, Fibre Reinforced Polymers (FRP) are widely employed in the aerospace and defence industries [1]. The analysis and certification of FRP components, however, call for extremely complex methods, particularly in sectors with stringent safety regulations [2]–[4]. Current failure theories do not offer a thorough explanation of the events, but they do provide knowledge regarding material behaviour at the component size. On the other hand, the micro- and nano-scale testing method enables the characterization of the material constituents, neglecting their combined behaviour on greater scales [5]. Understanding the heterogeneous nature of FRP failure mechanisms, which vary on the material mix and interfacial properties, would require additional research and physical models. Particularly important in determining deformation and damage in these composites is the fibre-to-matrix interface [2]. Debonding of fibres from the matrix has a major impact on tension failure, according to computational studies by Naya [6] and Herrez [7]. Due to the concentration of stresses under transverse tension, the fibre-to-matrix interface is where damage first appears. In contrast, compressive residual stresses delay interface debonding if the interface strength is equal to, or greater than the matrix strength. Under these circumstances, once the matrix strength is reached, the failure happens and the damage is controlled by the matrix’s plastic deformation [8]. To define the fibre-matrix interface, a variety of experimental methods have been suggested, with a focus on determining the bonding strength and toughness [9]–[14]. These experiments demand specialized tools, specimen preparation, and intricate data analysis. Testing is done at both the macro- and micro-scales, and numerical techniques are used to assess the outcomes. However, a lack of knowledge at the chemical and physical levels, along with an absence of standardized testing procedures, results in confusion and contradictory findings.
Using micro-cantilever tests (MCT), this work suggests a novel way of characterizing the fibre-to-matrix interface. A cantilever beam is made from a single fibre and held to the polymeric matrix by the interface section. The interface behaviour is tested by applying shear or bending stresses to the beam. To validate the results and assess the FRP interface characterization, computational finite element analysis is integrated with experimental techniques. Combining experimental and computational methods attempts to provide a more thorough understanding of interface behaviour and properties in FRP components.
2. Microcantilever Tests
2.1. Material
Hexply® IM7/8552 UD carbon sheets with a surface weight of 268 g/m2, a ply thickness of 0.25 mm, and a fibre volume percentage of 60% are the material taken into consideration in this investigation. The specimens were extracted from a transversal piece of a 4-ply [0°/90°] laminate. The highest feasible micro-beam length corresponds to the reported fibre average diameter of 5 μm.
2.2. Specimen Fabrication and Testing
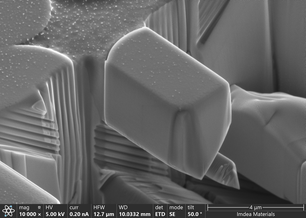
The production of the micro-cantilevers was carried out in a dual-beam combination system (Helios NanoLab 600i), where the electron and focused ion beams (FIB) overlap at a point with an angle of 52°, enabling simultaneous SEM imaging and FIB milling. The FIB technology enables milling the material surface with nanometric accuracy by precisely regulating the energy and intensity of the ion beam. Through three milling processes, in which the current and angle of incidence of the ion beam are changed (Table 1), regular micro-cantilevers were produced. Figure 1 displays an SEM image of a realized sample.
| Milling | Current [nA] | Voltage [Kv] | Depth [µm] | |
| Step I | Ga+ ion beam | 9.3 | 30 | 8 |
| Step II | Ga+ ion beam | 0.79 | 30 | 5 |
| Step III | Ga+ ion beam and assisting gas (MnSO4)7H2O | 2.5 | 30 | Refining |
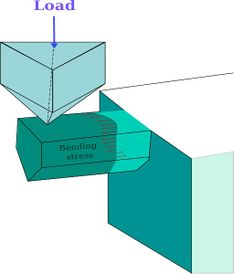
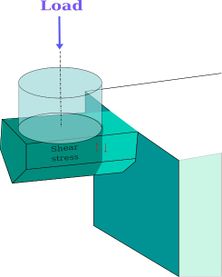
A total of 54 micro-cantilever samples were cut, then categorized according to cantilever lengths and section shapes and then tested using a Hysitron TI950 Triboindenter, a nano-indenter device. A cube-corner diamond tip was used to impart the load to the cantilever's end during the mode I test. A 3 µm diameter diamond flat punch was used to provide the load for the mode II tests. In this instance, the punch is placed as near to the contact as feasible to increase shear stress and decrease bending (Figure 2).
|
|
| a) | b) |
The experiments were carried out using displacement control, and a quasi-static loading state was achieved by setting the indenter's displacement rate to 5 nm/s.
3. FEM modelling and analysis
The experimentally suggested microcantilever samples' condensed size only allows for direct measurements of indenter displacements and related force, making them unsuitable for probing interface debonding directly. Due to this, a 3-D finite element model has been used to identify the fracture behavior at the fibre to matrix contact. On the Abaqus/Standard FEA program, the microcantilever tests are recreated as a single cut fibre that is inserted in a matrix block and is loaded.
With a global element size of 0.1 μm, fully integrated eight-node linear brick (C3D8) elements are used to mesh the fibre and the matrix block. The indenter is created as an analytical rigid surface. By suppressing the in-plane displacements, the matrix block is limited on the side and bottom faces, while the indenter has all rotation and displacements suppressed with the exception of the y displacement. Frictionless surface-to-surface contact is possible for the punch-to-fibre contact interaction. A surface-based cohesive zone model (CZM) technique is used to model the behaviour of fibre-to-matrix fracture propagation. A bilinear traction separation law is used.
An energy-based mixing rule is established in accordance with the Benzeggagh and Kenane (B-K) criterion to take into account how the various damage mechanisms interact with each other.
4. Results
4.1. Mode I and II experimental results
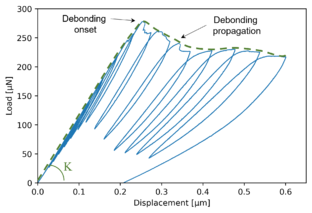
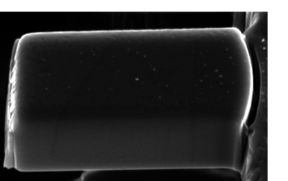
A mode I tested specimen's SEM image is shown in Figure 3 b), where it can be seen that the crack appropriately propagated on the interface surface after beginning at the upper interface edge. Figure 3 a) exhibits the corresponding load-displacement curve so that the impact of the cyclically applied displacement may be understood. The pre-debonding phase of the curve is defined by an initial linear behaviour, with K being the specimen's initial stiffness. At a load of 280 µN, a load drop caused by the debonding beginning is then noticed. The subsequent force plateau represents the stable propagation phase of the contact damage. Under a continually rising applied displacement, the green dashed line shows the load vs. displacement throughout pre-initiation and stable propagation.
|
|
| a) | b) |
A propagation kinking phenomenon that occurs shortly after the first cracking has an impact on the outcomes of the majority of unsuccessful experiments conducted to evaluate the mode I interface debonding. In these situations, the debonding correctly begins at the higher interface edge, but the entire debonding front within the matrix block kinks at the start of the stable propagation. Thus, the test follows a crack path that is 45 degrees from the horizontal. These experiments were considered a failure since the entire debonding front migrated into the matrix.
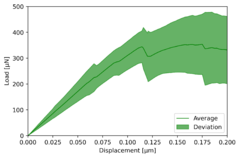
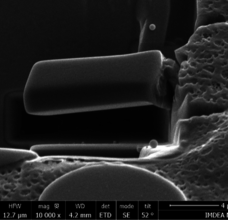
The load-displacement curve for tests conducted using Mode II, taking averages and standard deviations into consideration, is shown in Figure 4 a). The linear section of the curves stretches under these testing conditions until a load decrease close to a value of 350 ± 50 µN, indicating the beginning of debonding. When the load reaches its maximum before failing suddenly, the curve exhibits a toughened behaviour. All of the specimen failure mechanisms result in a clear debonded surface on the micro beam completely detached from the resin interface (see Figure 4 b)).
|
|
| a) | b) |
4.2. FEM results
The pre-debonding elastic specimen response was first determined by a series of simulations, which also confirmed the accuracy of the properties given in the literature [15]. The results were sufficiently accurate, so the cohesive reaction was investigated.
To match the experimental load-displacement curves, simulations were done using several cohesive property sets under mode I and mode II conditions. The cohesive set qualities are listed in Table 2 based on literature works [6], [14], [15]. The numbers correspond to the cohesive energy for modes I (GIC), mode II and mode III (GIIC=GIIIC), as well as the normal and transversal strength respectively and .
| Set | [MPa] | [MPa] | [J/m2] | |
| S1 | 49 | 74 | 2 | 6 |
| S2 | 150 | 74 | 2 | 6 |
| S3 | 120 | 74 | 25 | 100 |
| S4 | 100 | 120 | 30 | 120 |
| S5 | 100 | 135 | 11 | 100 |
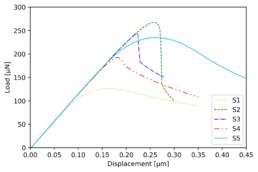
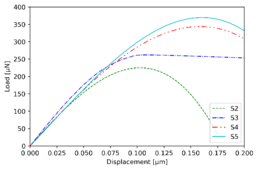
Figure 5 a) displays the mode I load versus displacement curves for the interface parameters from S1 to S5. It is clear from Mode I that a rise in cohesive strength results in a rise in maximum load. A rapid failure occurs if the elastic strain energy at the time of damage onset is close to the toughness; otherwise, a plateau region appears, signifying a steady debonding propagation. When comparing the curves from S1 to S3, which have the same toughness and increasing strengths, this effect can be seen. The curves S3 through S5, which exhibit increasing toughness and comparable strength, report a similar situation. The maximum load and stable propagation plateau increase in proportion to energy level.
Since S1 was already eliminated due to the low maximum load values achieved for the mode I experimental fitting, Figure 5 b) illustrates the mode II load-displacement curves relevant for the parameter sets S2 to S5. Similar to Mode I, the maximum load will increase as the strength or toughness increases. In the end, both for mode I and mode II simulations, the S5 cohesive properties set proves to be the optimal properties set.
|
|
| a) | b) |
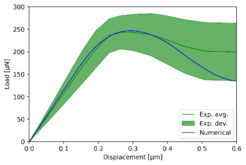
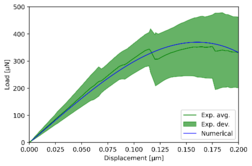
A comparison of mode I and mode II experimental numerical curves is provided in Figure 6, where the FE models are constructed using the S5 material set. The curve shows how the suggested model faithfully simulates the elastic pre-initiation specimen deflection as well as the initiation and initial propagation phase. In mode I, the computational solution tends to deviate from the experimental average curve showing a more pronounced load drop around the displacement values from 0.35 microns.
On the other hand, mode II exhibits good correlation throughout the entire range of displacement. As it relates to Mode I, matrix-cracking events that appear under advanced propagation circumstances can be linked to poor fitting in the extensive debonding. This matrix damage, which primarily affects Mode I, could contribute to the different debonding propagation and result in more energy being lost.
|
|
| a) | b) |
It is important to keep in mind that the presence of small-size voids or microcracks might affect how tough a material seems to be at larger testing scales. Because of this, the interface properties acquired in this work using micro-scale testing methods seem to be a little higher than those published in the literature, which were derived from larger interface surfaces.
In conclusion, the S5 set of interface parameters is a reliable tool for predicting the behaviour of mode I and mode II interface debonding, however, the higher strength and toughness values observed in this study are reasonable given by the microscopic scale of the experimental strategy.
5. Conclusions
The primary accomplishment of the current work is a novel experimental-numerical technique for identifying the properties of the fiber to matrix interface in a UD FRP. To describe the interface characteristics of composite materials at the micro-scale for Mode I and Mode II, an experimental approach was created. An assortment of micro-cantilever specimens were carved and tested, and the tests demonstrate good isolation of the single damages modes. Numerical simulations that mirrored the testing circumstances were used to support the experimental effort. The models were chosen to determine the behaviour and the evolution of the crack at the interface after being confirmed based on experimental evidence.
Bibliography
[1] C. Kassapoglou, Design and Analysis of Composite Structures. Wiley, 2013. doi: 10.1002/9781118536933.
[2] J. LLorca et al., “Multiscale Modeling of Composite Materials: a Roadmap Towards Virtual Testing,” Adv. Mater., vol. 23, no. 44, pp. 5130–5147, Nov. 2011, doi: 10.1002/adma.201101683.
[3] C. González, J. J. Vilatela, J. M. Molina-Aldareguía, C. S. Lopes, and J. LLorca, “Structural composites for multifunctional applications: Current challenges and future trends,” Prog. Mater. Sci., vol. 89, pp. 194–251, Aug. 2017, doi: 10.1016/j.pmatsci.2017.04.005.
[4] C. S. Lopes, C. González, O. Falcó, F. Naya, J. LLorca, and B. Tijs, “Multiscale virtual testing: the roadmap to efficient design of composites for damage resistance and tolerance,” CEAS Aeronaut. J., vol. 7, no. 4, pp. 607–619, Dec. 2016, doi: 10.1007/s13272-016-0210-7.
[5] L. Mishnaevsky and P. Brøndsted, “Micromechanical modeling of damage and fracture of unidirectional fiber reinforced composites: A review,” Comput. Mater. Sci., vol. 44, no. 4, pp. 1351–1359, Feb. 2009, doi: 10.1016/j.commatsci.2008.09.004.
[6] F. Naya, C. González, C. S. Lopes, S. Van der Veen, and F. Pons, “Computational micromechanics of the transverse and shear behavior of unidirectional fiber reinforced polymers including environmental effects,” Compos. Part A Appl. Sci. Manuf., vol. 92, pp. 146–157, Jan. 2017, doi: 10.1016/j.compositesa.2016.06.018.
[7] M. Herráez, A. C. Bergan, C. S. Lopes, and C. González, “Computational micromechanics model for the analysis of fiber kinking in unidirectional fiber-reinforced polymers,” Mech. Mater., vol. 142, p. 103299, Mar. 2020, doi: 10.1016/j.mechmat.2019.103299.
[8] T. J. Vaughan and C. T. McCarthy, “Micromechanical modelling of the transverse damage behaviour in fibre reinforced composites,” Compos. Sci. Technol., vol. 71, no. 3, pp. 388–396, Feb. 2011, doi: 10.1016/j.compscitech.2010.12.006.
[9] X.-F. Zhou, H. . Wagner, and S. . Nutt, “Interfacial properties of polymer composites measured by push-out and fragmentation tests,” Compos. Part A Appl. Sci. Manuf., vol. 32, no. 11, pp. 1543–1551, Nov. 2001, doi: 10.1016/S1359-835X(01)00018-5.
[10] R. J. Kerans and T. A. Parthasarathy, “Theoretical Analysis of the Fiber Pullout and Pushout Tests,” J. Am. Ceram. Soc., vol. 74, no. 7, pp. 1585–1596, Jul. 1991, doi: 10.1111/j.1151-2916.1991.tb07144.x.
[11] L. Yang and J. L. Thomason, “Interface strength in glass fibre–polypropylene measured using the fibre pull-out and microbond methods,” Compos. Part A Appl. Sci. Manuf., vol. 41, no. 9, pp. 1077–1083, Sep. 2010, doi: 10.1016/j.compositesa.2009.10.005.
[12] S. Sockalingam and G. Nilakantan, “Fiber-Matrix Interface Characterization through the Microbond Test,” Int. J. Aeronaut. Sp. Sci., vol. 13, no. 3, pp. 282–295, Sep. 2012, doi: 10.5139/IJASS.2012.13.3.282.
[13] A. Kelly and W. R. Tyson, “Tensile properties of fibre-reinforced metals: Copper/tungsten and copper/molybdenum,” J. Mech. Phys. Solids, vol. 13, no. 6, pp. 329–350, Dec. 1965, doi: 10.1016/0022-5096(65)90035-9.
[14] S. Ogihara and J. Koyanagi, “Investigation of combined stress state failure criterion for glass fiber/epoxy interface by the cruciform specimen method,” Compos. Sci. Technol., vol. 70, no. 1, pp. 143–150, Jan. 2010, doi: 10.1016/j.compscitech.2009.10.002.
[15] M. Rueda Ruiz, “Experimental and computational micromechanics of fibre-reinforced polymer composites at high strain rates,” Universidad Politécnica de Madrid, 2021. doi: 10.20868/UPM.thesis.67638.
Document information
Published on 30/07/23
Accepted on 18/06/23
Submitted on 19/05/23
Volume 08 - COMUNICACIONES MATCOMP21 (2022) Y MATCOMP23 (2023), Issue Núm. 1 - Caracterización - Sostenibilidad y Reciclaje, 2023
DOI: 10.23967/r.matcomp.2024.01.02
Licence: Other
Share this document
claim authorship
Are you one of the authors of this document?
