Abstract
In this work we identify the coherent vortices in the leeward wake of an HQ 17 airfoil with a Gurney flap. This high-lift device consists of a small plate perpendicular to the airfoil, at or near the trailing edge, with a height H of the order from 1% to 4% of the chord. The overall effect is to produce a significant increase in lift, together with a relatively minor increase in airfoil drag. Its geometry generates vortex shedding of spatial scale H, which modulates the wake and thus influence the global configuration of the flow. A numerical study was performed with the commercial software ANSYS Fluent. Simultaneously, experiments were carried out in the wind tunnel of the Aeronautical Departmental Area from the Engineering School of the National University of La Plata. With a Dantec StreamLine hot-wire anemometer, records of the instantaneous horizontal and vertical velocity components in the airfoil wake were obtained. Both the experimental data and those obtained by numerical simulation were analyzed with the continuous wavelet transform technique, in order to identify and characterize the coherent vortices in the wake. Results show the shed vortices structure and the organization degree of this periodic shedding.
Keywords: airfoils, high-lift devices, CFD, wavelets.
Resumen 1
En este trabajo se identifican los vórtices coherentes en la estela de un perfil aerodinámico HQ17 con un flap Gurney. Este dispositivo hipersustentador consiste en una pequeña placa perpendicular a la superficie del perfil situada en o cerca del borde de fuga del mismo, produciendo un incremento marcado de la sustentación junto con un incremento moderado en la resistencia. Su forma genera desprendimientos vorticosos de escala especial igual a su altura, que modulan la estela, influyendo en la configuración global del flujo. Se lleva a cabo una simulación numérica con ANSYS Fluent, en paralelo con experimentos realizados en el túnel de viento del Departamento Aeronáutica de la Facultad de Ingeniería de la Universidad Nacional de La Plata. Los resultados numéricos y experimentales fueron analizados con la transformada wavelet continua, para identificar y caracterizar los vórtices desprendidos en la estela. Los resultados muestran la escala y estructura de estos vórtices y el grado de organización de estos desprendimientos periódicos.
Palabras claves: dispositivos hipersustentadores, Mecánica de Fluidos Computacional, perfiles aerodinámicos, wavelets.
1. Introduction
1.1. The wavelet transform in turbulent flow analysis
The unpredictability and randomness of turbulence have made it difficult for it to be fully understood, even with powerful tools as statistical mechanics. Due to "non-deterministic" fluctuations in flow properties, one cannot accurately predict their value at a future instant. Turbulent flows contain a random part and ordered patterns, called coherent structures or vortices. In standard turbulence analysis, it is common to divide the flow into two parts: the time-averaged part and the fluctuating part.
Among the classical ways of analyzing turbulent flows are the statistical study of the fluctuation properties and a semi-empirical modeling of the mean turbulent magnitudes. Current turbulence research is based primarily on observations, laboratory experiments and numerical simulations. The measured parameters that characterize turbulent flows are scalar fields (temperature, concentrations, pressures, etc.), vector fields (velocity, vorticity, etc.) and tensor fields (stresses, strains, etc.) [1].
For many signals, Fourier analysis is very useful, due to its identification of the frequency contents of the signal. So, why another technique like wavelets? Because when transforming to the frequency domain, the temporal information is lost: it is impossible to say when a particular event occurred. The turbulent flows consist of two parts: coherent structures and background incoherent flow [2]. The size and spatial distribution of coherent structures are key to understanding turbulence, but spatial scale analysis is not possible with Fourier transform.
Wavelets are localized both in space and frequency. Therefore, the wavelet transform analyzes a signal locally in the frequency and space or time domains, something that is impossible to achieve in ordinary Fourier analysis.
The first works with wavelets applied to a turbulent flow field were developed by M. Farge in 1992 [3]. Many researchers have followed her steps, applying wavelets for the analysis of atmospheric flows [4,5], industrial flows [6], wakes [7] and others. A very recent paper from Farge highlights the importance of the continuous wavelet transform for a deeper understanding of turbulent flows, even 30 years after its introduction as a tool for their investigation [8].
The continuous wavelet transform attempts to express a continuous signal x(t) in time, through an expansion of terms or coefficients proportional to the internal product between the signal, and different scaled and translated versions of a prototype function Ψ(t), better known as mother wavelet. Assuming that both the signal and the new function Ψ(t) are of finite energy, then we can define
|
|
(Eq. 1) |
as the Continuous Wavelet Transform.
Variable a (scale parameter) controls the effective width or support of the function, and variable b (translation parameter) gives us the location in the time domain of Ψ. Large values of the scaling parameter a mean a large scale and correspond to small frequency ranges, whilst small values of said parameter correspond to high frequencies and very small scales. By using wavelets, we combine both physical and spectral space locations.
The ‘‘Mexican Hat’’ wavelet, a normalized second derivative of the Gauss function, used in the present research, has been successfully employed for the identification of events such as maxima, sign changes, etc. [4].
1.2. Gurney flaps and their wakes
Immediately behind a common airfoil operating normally at lift-generating angle of incidence, the nearby wake is asymmetric. This asymmetry is due to the noticeable differences between the boundary layer coming from the surface and being exposed to low pressure of the extrados, with respect to the boundary layer of the surface with overpressure of the intrados. Leaving the trailing edge, these different boundary layers break off and transform into shear layers that roll up into vortices, constituting the characteristic vortex structure of the wake near the trailing edge. At greater lift, the boundary layers and said shear layers from the intrados and extrados will differ even more, so the vortex structure of the nearby wake will be influenced by the aerodynamic load and the characteristics of the airfoil.
The turbulent flow of an airfoil with a blunt trailing edge —provided with a Gurney mini-flap (very small height plate, perpendicular to the airfoil surface), involves turbulent boundary layers that break off at a certain frequency forming shear layers that roll up, which in turn form a street of periodic vortices. Two shear layers emerge from both ends of a Gurney flap and roll up in a pattern of alternating and counter-rotating vortices, establishing what is called an absolute wake instability [9].
The advantage of this mini-flap is that it is a very simple and small device, with a height equal to 1.5% of the airfoil chord. At the same time, it can generate a significant increase in lift force (perpendicular to the current). For an HQ 17 airfoil, for example, the lift at 0° angle of attack can be increased by 60%, and the maximum lift value can be increased by 20% [9]. The counterpart of this device is that lift increase is accompanied by a drag increase, although the latter is not as significant. These effects are associated with vortex shedding in the wake of the mini-flap.
The studies focused on the search for asymmetries between the vortices leeward of the mini-flap generated by a different rolling of the shear layers coming from the extrados and intrados wing surfaces, in a wake region whose extension is two mini-flap chords. Simultaneously, the nearby wake region was explored in an attempt to detect and characterize the organized vortices shed in the Gurney flap wake, by identifying their characteristic frequency and spatial scale. Results have been published in Spanish in [10].
2. Methodology
2.1. Experimental Study
Wind tunnel experiments were conducted at the Boundary Layer and Environmental Fluid Dynamics Laboratory (LACLYFA) of the Engineering School from the National University of La Plata, operating at a Reynolds number of 5.105. The airfoil, located with the extrados above and the intrados below, will be considered with respect to the incident current direction.
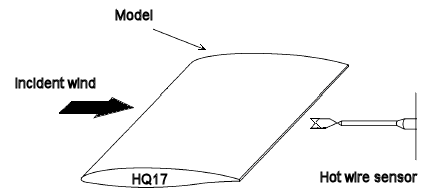
The profile selected for the study is the HQ 17, with a Gurney-type flap located on the trailing edge on the intrados, as shown in Fig. 1.
The tested model consists of a rectangular wing without torsion, with a chord of 0.45m and a wingspan of 0.8m, equipped with a Gurney mini-flap of height H equal to 1.5% chord. The model was horizontally placed in the test section of the tunnel. The speed of the current was 15m/s.
Velocities were measured with the StreamLine model from Dantec, a 2-channel, constant temperature, and hot-wire anemometer. X-wire Dantec 55R51 probes were used, with a data acquisition rate of 2000Hz per channel, as seen in Fig. 2.
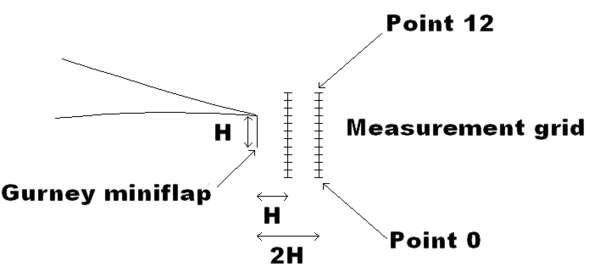
Longitudinal (u) and vertical (v) instantaneous velocities were measured upstream and downstream of the model, particularly in the wake region near the blunt trailing edge with Gurney flap: along a grid with horizontally spaced points at lengths H and 2H of the wing chord, and 12 vertical intervals spaced 2 mm apart (Fig. 3).
2.2. Numerical Study
In the Computational Fluid Dynamics Group of the Aeronautical Engineering Department from the National University of La Plata, a numerical simulation of the problem under study was conducted with ANSYS Fluent, in order to be able to visualize and analyze the wake that was generated from the Gurney flap. The details of the numerical model are:
Number of cells: 103,327.
Number of nodes: 77,331.
Mesh type: hybrid.
Turbulence model: k-ω SST.
Turbulence intensity: 10%.
Turbulence length scale: 0.1m.
Time step: 0.0002s.
Reynolds number: 5.105.
Dynamically adaptable mesh, according to the value of the pressure gradient.
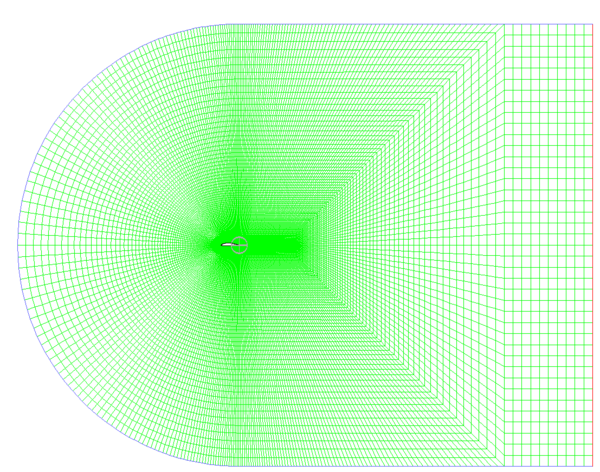
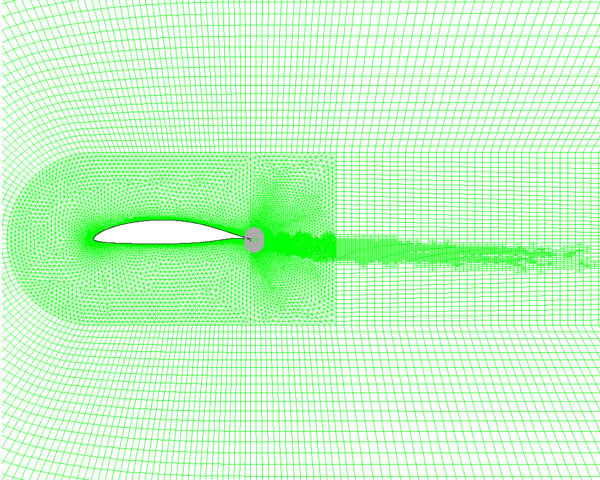
Figures 4 and 5 show the mesh with different levels of detail.
3. Results
3.1. Numerical Results
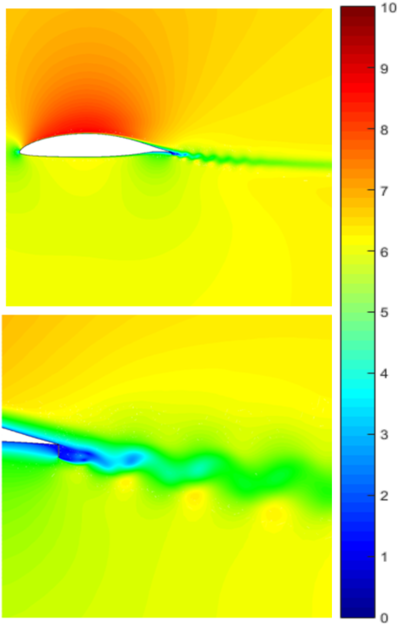
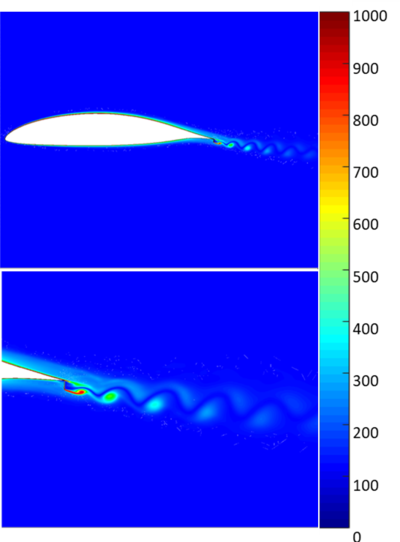
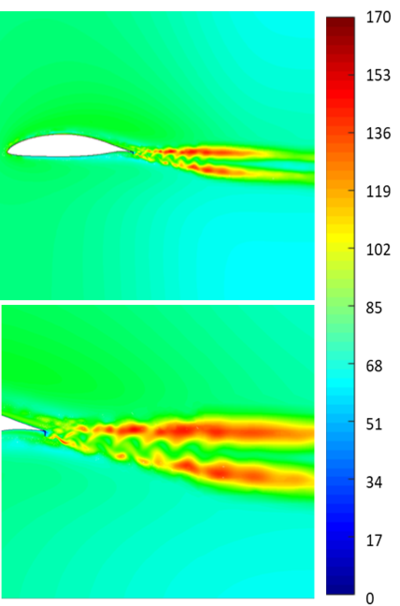
The results shown in Figures 6, 7 and 8 were obtained after about 2 seconds of flow time.
It can be seen in Figure 6 that velocity fluctuations in the wake are not symmetric. Figure 7 shows vorticity concentration in the coherent structures shed in the wake. In our numerical simulation, vortex shedding of a spatial scale similar to Gurney flap can be observed (Figure 7 and Figure 8), which develop downstream. In Figure 8, it can be seen that the maximum values of turbulence intensity correspond to shear layers between which the vortices travel and develop, introducing the maximum value of speed fluctuations there.
Due to our sensors position, the interesting measurements for analysis will be those corresponding to Points 0 and 7 (Figure 3) at distances H and 2H from the Gurney flap.
Vortices develop at the trailing edge and break off with a characteristic frequency; then, they travel downstream. An anemometry probe located in these regions will frequently be rammed and immersed in these vortices, being able to extract information from them.
3.2. Spectral Analysis
The acquired instantaneous velocities spectra were calculated with MATLAB “spectrum” function. In the graphs, frequency f was normalized as
|
|
(Eq. 2) |
where c is the airfoil chord (it is taken instead of the Gurney height [9]) and U is the free stream speed.
For the numerical study, the same Reynolds number was reproduced but with a different speed and chord, which caused shedding frequencies to be different. For this reason, frequencies were normalized with the corresponding chords and speeds, in order to be able to compare the experimental and numerical results. Strouhal numbers at the shedding frequency should be the same in both cases.
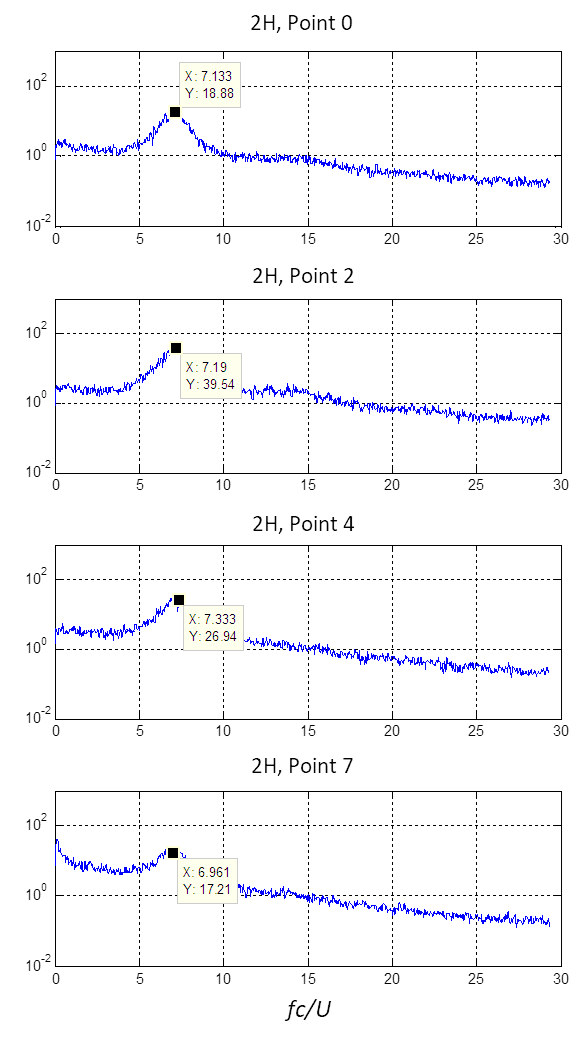
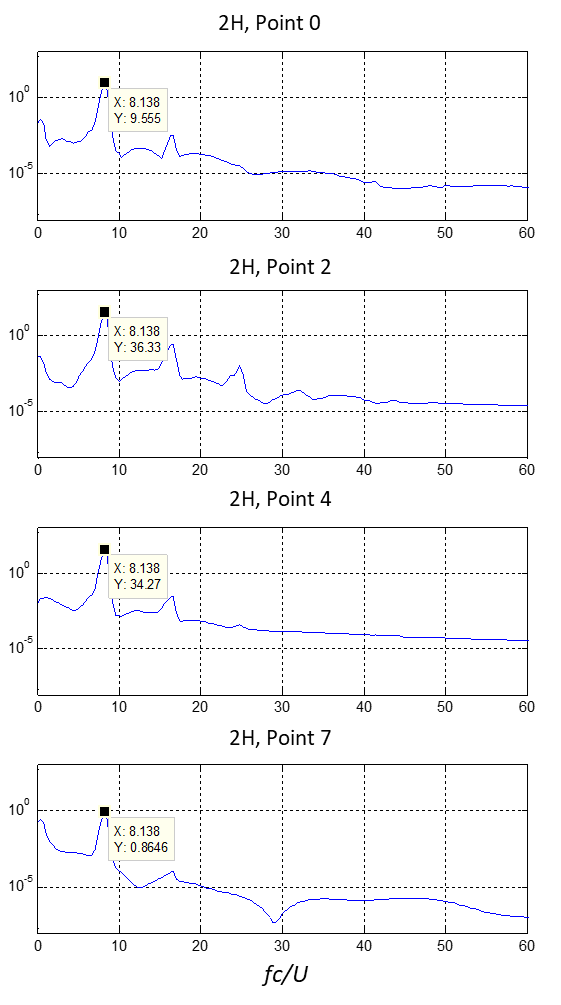
Measurements analysis shows that, in the regions of the wake close behind the mini-flap —where vortices begin their development, an important peak in the fluctuating velocities spectrum is observed, clearly indicating the presence of the absolute instability and the vortex street illustrated in Figures 6 and 7. Figure 8 shows the normalized spectra of the vertical instantaneous velocity v, at a distance of 2H downstream of the miniflap and different heights (points 0 to 8 in Figure 2). The spectral peak is marked at all measurement locations. The spectra at distance 1H, as well as those for the horizontal velocity component u, show spectral peaks at the same non dimensional frequencies.
The spectra of numerical results also show peaks at the vortex shedding frequency. When solving RANS-type equations (k-ω Shear Stress Transport in our case), the high frequency contents of the turbulence spectrum are filtered. The solution presents much less random speed fluctuations, and, in consequence, the spectrum is “cleaner” and less energetic (Fig. 10).
The detected shedding frequencies are 220Hz for the experimental measurements and 55Hz for the numerical ones. When normalized with the free stream speed and the airfoil chord, the vortices characteristic Strouhal number is found to be similar in both the experimental and numerical analysis (approximately 7 in the experimental and 8 in the numerical one).
The height of a spectral peak measured at a fixed point reflects the intensity of the velocity fluctuations caused by passing vortices, and the frequency of the vortex shedding.
3.3. Wavelet Analysis
Velocity-time records were checked for clues related to the second derivative of a Gaussian g2 (“Mexican Hat”). Assuming a “frozen flow” hypothesis, it is possible to deduce the spatial turbulent scale for an instantaneous velocity component by looking for its maximum in the wavelet map. This wavelet has the characteristic of identifying local maxima at different scales with high precision.
Our wavelet analysis will focus on those points for which the spectral analysis marks notorious shedding peaks: points 2 and 4, both at distance H and 2H. For this analysis, we will use MATLAB CWT function with “Mexican Hat” (“mexh”) wavelet, following the scales:
|
|
(Eq. 3) |
The relationship between the wavelet scale and the real time scale is:
where “ ” represents the wavelet scale, dt is the sampling interval (0.0005 s) and treal is the wavelet time scale.
To obtain an approximation to the real spatial scale (always considering "frozen flow" hypothesis), one simply multiplies the latter by the fluid local velocity:
|
|
(Eq. 5) |
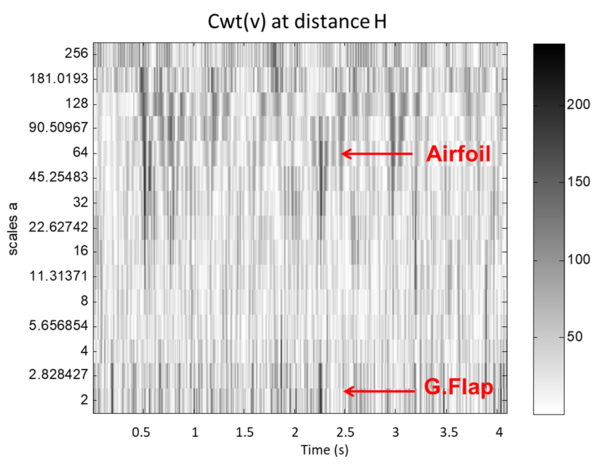
The wavelet analysis of experimental data (Figure 11) shows that the energy maxima are associated with two predominant time scales: one of 0.032 seconds (a = 64), corresponding to velocity fluctuations produced by the entire airfoil, and another time scale of 0.001 – 0.0015s (a = 2-3), corresponding to the energy associated to the passage of a vortex shed by the Gurney flap.
It must be pointed out at this stage that the frequency of vortex shedding identified by the spectral peak at a Strouhal number of 7, is fs = 233 Hz, which implies a time period between vortices of 1/fs = 0.0043 s. The wavelet map identifies not the fluctuations due to the periodic shedding, but the time scale of each single eddy, which results to be approximately 1/4 of the shedding period.
Although the data acquisition frequency of 2000 Hz allows the correct identification of vortex shedding frequency —with about 8 measurements per cycle, it is barely adequate for the fluctuation associated to a vortex passage. For this reason, a complementary analysis is performed in the numerical simulation, this time with the sampling frequency of 5000 Hz corresponding to the time step of 0.0002 s.
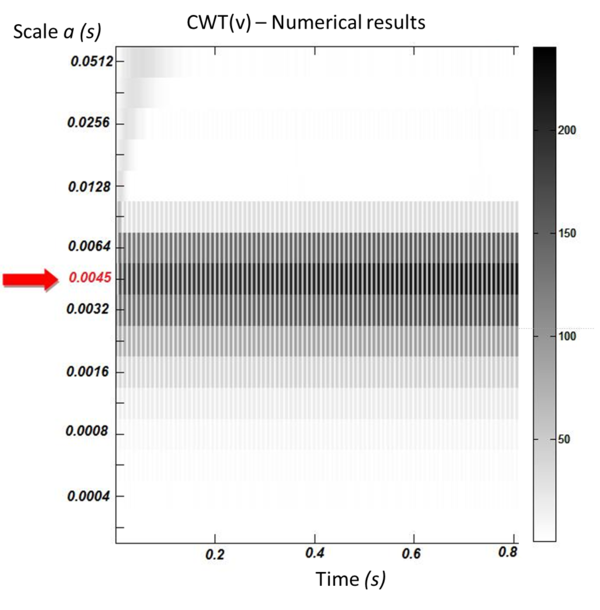
The wavelet map corresponding to the transverse component v of the velocity in the numerical results is shown in Figure 12.
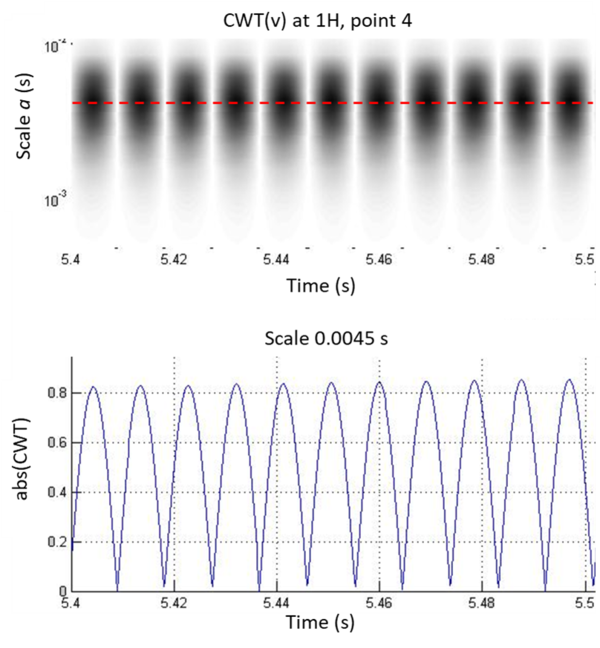
If a sector of Figure 12 is amplified to have more resolution, and the row of the coefficients matrix corresponding to the greater intensity scale is the only one plotted (Figure 13), the following is observed: CWT intensity maxima on this scale appear with a frequency of 22 peaks in 0.2 seconds, or 110Hz. In fact, considering that we are graphing the wavelet transform absolute value, and that the transverse velocity fluctuations corresponding to shed vortices are of alternate sign (one maximum of abs(CWT) corresponds to a positive fluctuation, and the next to a negative one), the conclusion is that the CWT maxima frequency in the time scale of 0.0045s is approximately 55Hz, giving a normalized frequency of 8, the same one that appears dominant in the spectrum (Figure 10).
But it should be noted that the time scale associated with these wavelet transform intensity maxima is not 1/110Hz (0.0091s) nor is it 1/55Hz (0.0182s) —as would occur in the case of a sinusoidal signal, but rather the scale of the maxima (0.0045s) is approximately a quarter of the period associated with a complete cycle. That is, the wavelet transform allowed detecting the real time scale of the intense energy fluctuations associated with the passage of an eddy, independently of the time scale associated with the frequency of eddies periodic shedding.
4. Conclusions
To contrast the contributions of the wavelet transform over the Fourier analysis we can mention that:
- It should be made clear that wavelet analysis has not appeared as the tool that displaces the Fourier Transform (FT), but rather as a tool that can complement it, or be a correct/incorrect choice depending on the type of signal to analyze, or the application in which it is to be used.
- Being many and very different, wavelet bases adapt very well to various applications and signal types, even giving the possibility of creating a new base for a specific application or for a certain type of signal.
- In non-stationary signals analysis, Fourier transform is not optimal since, although it provides complete information on the spectral content of the signal, it is not capable of locating the frequency components in time.
- Another advantage of the continuous wavelet transform over the frequency spectrum is that scale and frequency are not always related as reciprocals of each other, as they would be in a sinusoidal signal.
From the analysis of the problem under study, it is deduced that the time scale of the vortices released from the Gurney flap is approximately a quarter of the period between successive shedding. If we consider that the average speed is much lower in the airfoil wake than in the free flow, as can be seen in Figure 6, we obtain the reasonable result that the spatial scale is of the same order as the Gurney mini-flap chord.
Although Fourier analysis allows the correct detection of the shedding frequency, it is not enough to determine the scale or duration of the shed organized structures (vortices), which the continuous wavelet transform does achieve. This allows finding the temporary location of the vortices and correctly determining their scale and energy level, in addition to the characteristic frequency of the periodic shedding. In the experimental analysis, CWT also allows identifying energy fluctuations on a scale corresponding to the airfoil chord, which are lost in the classic spectral analysis, dominated by the characteristic frequency of the shedding.
On the other hand, the Gurney flap characteristic Strouhal numbers show good agreement in both the numerical simulation and experimental measurements, validating the quality of the numerical simulation performed.
Competing interests
The authors have declared that no competing interests exist.
Authors’ contribution
PG carried out the numerical simulations under the teaching and supervision of FB. JSD conducted the experimental measurements. PG implemented the spectral and wavelet analysis of both experimental and numerical data under the supervision of AS, who leaded the work, developed the scripts for spectral and wavelet analysis and corrected the manuscript.
All authors read and approved the final manuscript.
Acknowledgements
The authors are grateful to Micaela Schwab Bonfigli for her valuable help in the manuscript translation to English.
References
[1] Tennekes H. and Lumley J. L., A First Course in Turbulence. The MIT Press, 1972.
[2] Davies P. O. A. L. Coherent structures in turbulence. In Turbulent Mixing in Nonreactive and Reactive Flows, S. N. B. Murthy (Ed.), Plenum Press, 1975.
[3] Farge M., Wavelet transforms and their applications to Turbulence. Annu. Rev. Fluid Mech. vol. 24: 395-457, 1992.
[4] Dunyak J., Gilliam X., Peterson R., Smith D., Coherent gust detection by wavelet transform, J. Wind Eng. Ind. Aerodynamics vol. 77–78, 467–478, 1998.
[5] Boldes U., Scarabino A., Colman J. About the 3-Dimensional Behavior of the Flow within a Forest under Unstable Conditions, J. Wind Eng. Ind. Aerodynamics, vol. 95/2, 91-112, 2007.
[6] Li Y., Wang Y., Guan X., Zhou H., Ma X., A wavelet model on reconstructing complex aerodynamic field in furnace with acoustic tomography, Measurement, vol. 157, 107669, 2020.
[7] Mohd Razali S. F., Zhou T., Rinoshika A., Cheng L. Wavelet analysis of the turbulent wake generated by an inclined circular cylinder, Journal of Turbulence, vol. 11, 2010. DOI: 10.1080/14685248.2010.482562.
[8] Farge M., “The evolution of turbulence theories and the need for continuous wavelets” arXiv:2209.01808 [physics.flu-dyn]; DOI: 10.48550/arXiv.2209.01808. Sept. 2022.
[9] Delnero J.S., Marañon Di Leo J., Boldes U., Colman J., Bacchi F., Martinez M., Wassen E., Guenther B. and Thiele F. Numerical and Experimental Investigation of Mini–Flap Positions on an Airfoil; 45th AIAA Aerospace Sciences Meeting and Exhibit. 8-11 January 2007, Reno, USA, 2007.
[10] Giacopinelli P., Scarabino A., Delnero J.S., Bacchi F. Detección y análisis con wavelets de estructuras organizadas en la estela de un perfil aerodinámico. Actas del 2do. Congreso Argentino de Ingeniería Aeronáutica, 2010.
Document information
Published on 15/03/23
Accepted on 10/03/23
Submitted on 26/12/22
Volume 39, Issue 1, 2023
DOI: 10.23967/j.rimni.2023.03.001
Licence: CC BY-NC-SA license
Share this document
Keywords
claim authorship
Are you one of the authors of this document?

