1 Introduction
It is important to realize that measuring strains is not the same as detecting damage. Damage is not a physical parameter, it is just a local change of the material’s properties or at the structure boundaries (a crack is simply a new boundary), which degrades their structural performances [1]. A crack may be the failure initiation point, may drop by a large percentage the strength of the structure, but before the catastrophic failure, it produces negligible changes in most of the parameters of the structure (natural frequencies, global strain fields, and so on). Damage can only be detected by comparing the responses of the structure, acquired by sensors, before and after damage occurrence. Consequently, we cannot expect to have ‘damage sensors’, only we can get information about damage by processing and comparing the raw signals received from the sensors before/after damage, trying to identify the ‘features’, or parameters that are sensitive to minor damages, and that can be distinguished from the response to natural and environmental disturbances. In this sense, Structural Health Monitoring (SHM) requires sensor data and Damage Detection algorithms. Even in some cases, like for CVM (Comparative Vacuum Monitoring), the algorithm may be quite simple (loss of vacuum in some channels).
First attempts for damage detection with optical fibres dated back to 1990, under the heading ‘structures with nerves of glass’, by checking the continuity of the optical fiber [2]. The approach was not robust enough, and this research line was discontinued. The FBG (Fiber Bragg Grating) started to be used as strain sensors embedded in composite structures around 1995, and a few other articles appeared around year 2000, looking for the changes at the spectrum of the reflected peak, as an indicator of damage, when the damage was happening just onto the position of the embedded FBG. Again, the procedure cannot be extended to a general case of damage detection in structures.
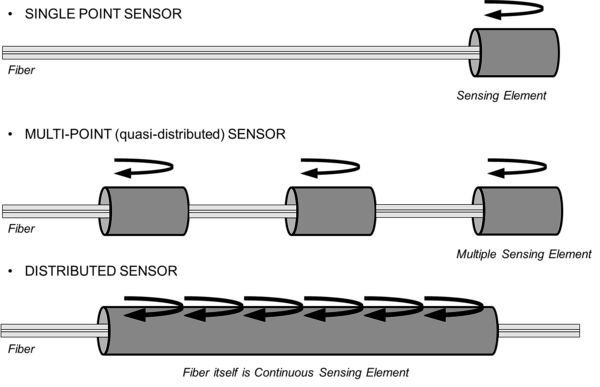
Fiber Optic sensors (FOS) offer a very low size, the optical fiber has a diameter of 150 microns, so it can be embedded within a ply into the composite material during manufacturing. Other benefits for FOS are EMI/RFI immunity, wide temperature range, very long cabling if needed, because of the low attenuation, and the multiplexing capability (several sensors on the same optical fiber). As sketched at figure 1, three topologies are possible:
* Point sensor: detect measurand variation only in the vicinity of a single sensor. Example: micromirror at fiber tip. This is mostly used for chemical sensors, but also for EFPI.
* Multiplexed sensor: Multiple localized sensors are placed at intervals along the fiber length. i.e . FBG (sensor length 10 mm typical). About 10 sensors/fiber if multiplexed by wavelength, up to 1000 sensors by using OFDR (Optical Frequency Domain Reflectometry).
- Distributed sensor: Sensing is distributed along the length of the fiber, the optical fiber works simultaneously for transmitting the information and for sensing the local external variables (temperature, strain).
Figure 1. Topology of Fiber Optic Sensors.
Fiber optic sensors (FOS) have reached a maturity as strain/temperature sensors. It can be said that its TRL (technology readiness level) is about 8-9, they have already been demonstrated in real aircrafts, and are routinely used in many other industrial applications, like monitoring oil wells. An excellent 50 pages review on FOS technologies has recently been done [3], including more than 170 references; so a long introduction describing FOS is not needed, readers are referred to it or to other similar documents [4].
In spite of the very large number of publications dealing on it, the Damage Detection with FOS is far less mature than strain sensing, corresponding to a TRL 2-3 (physical principles clarified and exploratory trials, but still far from validation on realistic structures). Currently the most widely known approach is based on embedding FBGs sensors for detecting the ultrasonic waves travelling through the laminates, either in a passive mode (acoustic emission), or in an active mode, combined with piezoelectric wafers as Lamb waves emitters. Ref [5] gives a quite clear explanation of the technique. Several authors have also worked on this concept, developing advanced interrogation systems, some of them now commercially available. This hybrid PZT/FBG technique has the same limitations as the “all PZT” technique: it deals with elastic waves propagating through the structure. It works very well on flat laminates, or very simple structures as pipes, but real structures use to have stiffeners and local reinforcements, which produce multiple reflections of the travelling waves, limiting the range of inspection and adding complexity to the received signals.
A review on strain based damage detection strategies, mainly oriented to civil structures applications, was done at Ref. [6], but was limited to vibration-based methods, which inherently have the advantage of a global survey of the whole structure, and the limitation that damage needs to be large enough to modify the modal shapes. They concluded that, at least for beam-like and trusses structures, the strain modal shapes are more sensitive to damage than modal displacements [7]; damage indexes were proposed, but few experimental results were presented. A similar approach was applied to composite stiffened panels, including numerical simulations and experimental tests [8,9], but the accuracy of that strategies for damage quantification has yet to be verified.
First approach to be discussed in this paper deals with the detection of the new internal strains that appears in a composite structure as a consequence of a damage appearance; these new strains are concentrated around the damaged area, and will be detected if some strain sensors were located just there. A few centimetres away from the damaged area there will not be any strain changes, and consequently nothing would be detected. The approach is quite robust, a delamination always produces a local strong change of strains, but the area under supervision is limited to the area covered by the strain sensors, so the technique is local, similar to the CVM. It may be done with FBGs, but even with a very dense array of sensors, only a small area could be supervised. The new available techniques for high spatial resolution distributed sensing (OFDR) may get the strain reading all along the optical fiber, allowing a wider coverage. Results of application to the surveillance of composite door surroundings is given. We will call this approach ‘Detection of damage-induced strains’.
The former technique may be applied to unloaded structures, so the strain readouts are zero everywhere (baseline) except at the damage area. For the second approach, when the structure is submitted to an external load, each strain sensor existing at the structure will give a readout for the local strain at that sensor position, with a linear dependence on the external load. A local damage will produce a change at the local stiffness, and consequently a change at the load paths, and on the readouts at each strain sensors (for the same external loads); nevertheless, the changes will be so small that they can hardly be detected, very precise algorithms are needed to distinguish them. This is the basic principle for the second approach to be discussed in this paper, sometimes referred as ‘strain mapping’.
At this paper we include results obtained by our group that have been formerly published, but isolated; by merging the results, a clearer understanding of possibilities and limitations may be get.
2 Detection of damage-induced strains
To be effective, this technique requires of distributed sensing, meaning getting the strains all along the optical fibre. Several kinds of Fiber Optic Distributed sensing systems are available, in dependence of the wavelength they are working with [10]. Table 1 summarizes its performances. Rayleigh system working with OFDR (Optical Frequency Domain Reflectometry) is the only one to offer spatial resolution in the range of mm, as needed for aeronautic applications; for civil engineering applications, a long measurement range may be the preferred quality, which may drive to other choices. Performances are quickly evolving, so this table must be taken with caution. Distributed sensing has opened new possibilities for the instrumentation of structural tests, particularly for very large structures, like civil engineering structures [11-13], wind turbine blades [14]. Again, getting strains is not the same as getting damage information, even though at concrete structures, cracks are easily identified as the points with very high strains readouts.
| Rayleigh | Raman | Brillouin | DAS
Rayleigh | |
| Domain | OFDR | OTDR | BOTDR,
BOTDA |
ɸ-OTDR |
| Sensing parameter | Strain & Temp | Temperature | Strain & Temp | acoustic signals |
| Max Distance | 70-100m | 20 km | 10 km | 40 km |
| Spatial Resol | 5mm | 1-2 m | 10 cm | 1-2 m |
| Strain accuracy | 1 πε | 0.1ºC | 25 πε | None |
Table 1. Comparison of Distributed Fiber Optic sensor systems
2.1 Detection of delaminations caused by impacts
Impact damage is considered the highest threat for composite structures during its service life. Low/medium energy impacts (called BVID = Barely Visible Impact Damage) do not leave any external visible marks, but cause internal delaminations that drop the compressive strength by nearly 50 %. They need to be identified and repaired as soon as possible to avoid the growth of the damaged area under repeated loads.
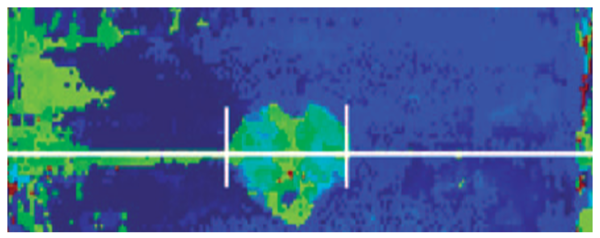
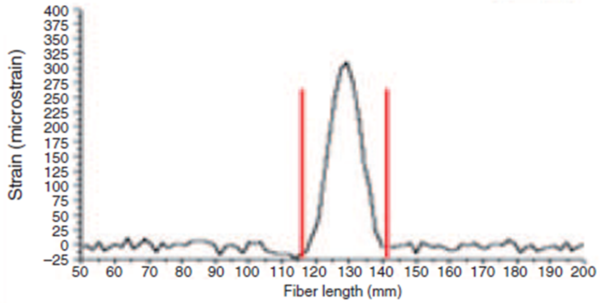
A sixteen plies crossply CFRP laminate was built from UD prepreg material by OOA (Out of Autoclave) procedures. A poliimide coated optical fiber was embedded inside the laminate during layup. The laminate was impacted by a drop weight test, and a delamination was produced. The white line show the position of the optical fibre, and the lower image (figure 3) show the strains measured by the optical fiber along this line. It can be seen the appearance of residual strains at the delaminated area. Worthy to mention strains caused by damage are significant, with a peak of 300 microstrains, and the delaminated length is perfectly depicted, 25 mm. In fact, the delaminated area can nearly be plotted if the optical fiber follows a crooked path, with parallel fibers every 5 mm. The strain field map of the area can be obtained with relatively high accuracy.
Figure 3.: Detection of the delamination caused by an impact; Ultrasonic C-Scan of the impacted laminate; (c) Strains measured along the white line of the upper figure by an O.F..
2.2 Detection of delaminations at laminate edges
The former approach may be used for SHM of similar structures, like small cylindrical pressure vessels [15], or for structural details, like monitoring stringer debondings [16]; it has also been used to monitor bonded and bolted joints [17 and 18, respectively]. But for practical reasons the whole surface of the aircraft can not be covered with a continuous optical fiber, the maximum inspectable length is about 100 meters. This concept is useful by reducing the covered area to critical regions with a higher risk of damage.
Laminate edges, like surroundings of cargo doors and man holes, are areas of high risk for accidental impacts, and consequently require a more frequent inspection; a permanent automated inspection system is highly desirable. The following experiments were done to demonstrate the validity and reliability of the approach, full details are given at Ref. [19].
Several identical CFRP 16 plies laminates were built from UD prepreg material, by OOA procedures, with the lay-up (04, 904)s. This special layup sequence was used for simplicity, to have only two delaminations interfaces; nevertheless the concept is also working for any other general laminate.
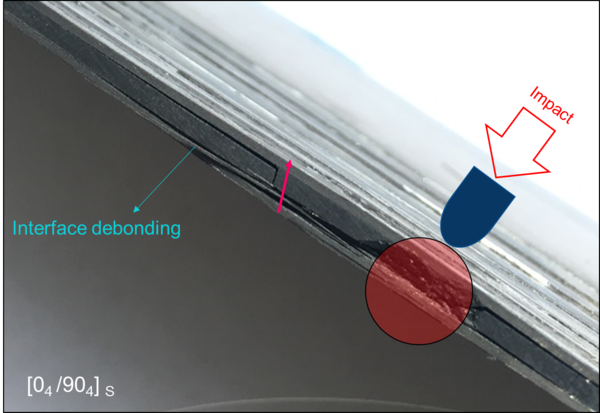
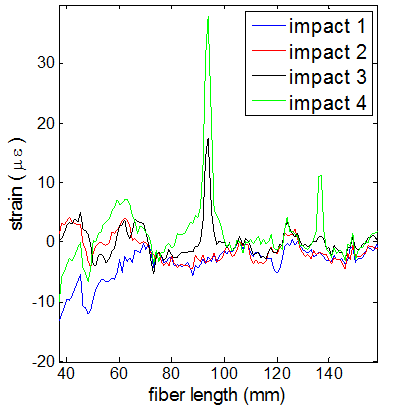
The laminates were submitted to impacts of controlled energy, by using a drop weight test machine, both perpendicular to the laminate and on-edge direction. The energy was gradually increased until a visible damage was produced (figure 5), and the residual strains were recorded after every impact (figure 6).
Figure 5. Delamination caused at a (04, 904)s CFRP laminate after a 5 J on-edge impact.
Figure 6. Strains recorded by the optical fiber after successive impacts of increasing .energy, from 2 to 5 joules. The two identifiable peaks recorded at 100 and 400 mm are for the first and second loops of the optical fiber, respectively
Similar findings were obtained when impacts were done at the direction normal to the laminate. For these tests, an embedded O.F. was used, located at the second ply of the surface opposed to the impact. The energy needed to cause a BVID was slightly higher than in the former case. These results show the high reliability of the technique, as far damage happen on the optical fiber path, and a system is available to get the strains all along the fiber with adequate spatial resolution.
3 Detection damage by strain mapping
There have been different attempts to use the strain data collected after static or dynamic loadings of the structure to derive damage information. Local damage may change slightly the strain readouts, more significantly at those sensors more closely located to the damage region. As it will be shown in the examples below, for realistic structures, a large number of sensors are needed, each sensor producing one data for each load case or load increment; so even for simple experiments, huge data sets, ranging Gigabits, will be generated, which contains redundant and repeated information, accompanied with noise.
Many algorithms are available to handle large data sets, one of the simplest and more effective approach is called Principal Component Analysis (PCA). PCA is a simple and non-parametric method of extracting relevant information from confusing data sets. It provides hints on how to reduce a complex data set to a lower dimension, revealing some hidden structure/patterns or abnormal data. This is done by converting a set of data of possibly correlated variables into a set of values of linearly uncorrelated variables called principal components. Texbooks and software tools are available explaining the use of PCA, and also related articles dealing with application of PCA to SHM [20], so only a brief explanation is given here. The steps to follow are:
1. Organize the data set as n x m matrix, where n is the number of tests (each load case or load increment is a new test) and m is the number of measured variables (sensors) . X
2. Normalize the data to have zero mean and unity variance
3. Calculate the eigenvectors-eigenvalues of the covariance matrix. C= X XT
4. Keep only the first eigenvectors as the principal components. Baseline
5. Project any new collected data into the former Baseline
6. Identify if new data follow global trends (Damage Index)
PCA belongs to the group of ‘data driven’ SHM methods, so at difference to ‘model based’ methods, like vibration analysis, an understanding of the physical meaning of the new variables is not needed, neither a detailed modeling of the structure. Also, it must be point out that among the five levels for Structural Health Monitoring,
1- Identification of damage occurrence
2- Localization
3- identification of damage type
4- Quantification of damage,
5- Prediction of residual strength.
This technique only may afford an alert for damage occurrence; it does not seems a main limitation, once damage is known to happen, it may be located by checking which area has the largest strain changes.
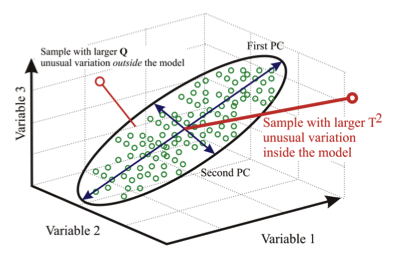
Figure 7. Schematics of the PCA algorithm. Firstly identify a new coordinate system which reduce the dimensionality of the data set. Secondly, identify if new data fits or not inside the former reference system.
3.1 Damage detection for a CFRP Isogrid structure
The concept of isogrid or lattice structures has been widely explored for space applications, both with and without attached skins. This kind of structure has an inherent high mechanical efficiency, particularly to withstand compressive loads.
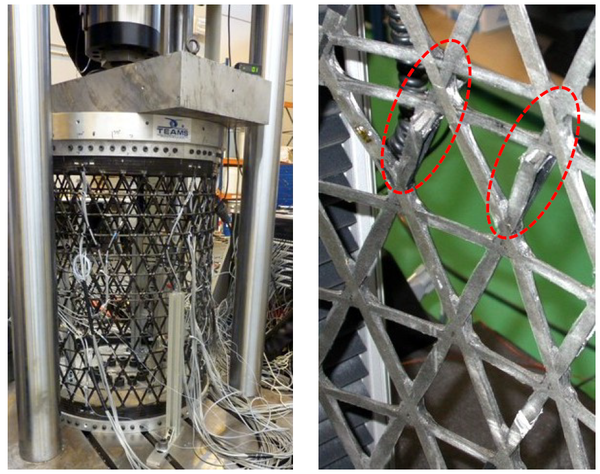
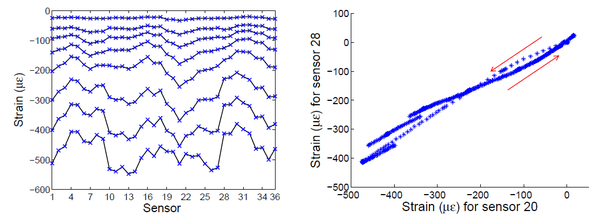
A large size structure, 1100 mm height and 800 mm diameter, has been manufactured by automatic tape laying process using high modulus graphite fiber and out of autoclave curable resin system. It was instrumented with 36 FBGs and tested to failure under compressive loads (figure 8). First failure happened at -330 kN, with some broken bars, but still the structure retained its load carrying capability. Figure 10 show the strains acquired during the test, which gives evidence that slight manufacturing imperfections cause an uneven strain distribution, and a nonlinear response under load/unload conditions.
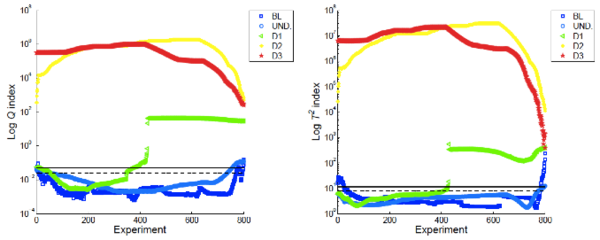
The application of the PCA algorithm to the former data set is straightforward, with quite good results (Figure 10). Worthy to mention that there is no need to prepare the data, neither a FEM model. It is only needed to arrange the X matrix (36 X 800), there were 36 sensors, and 800 measurements were taken to generate the baseline. Next measurements, projected on this baseline, easily discriminate the load which produce the first failure, and after that, next measurements have a clearly detectable damage index.
Figure 8. Isogrid structure under compression test. Detail of broken bars after. exceeding the max. load
Figure 9. Isogrid structure under compression test. Detail of a broken bars after exceeding the first failure load
Figure 10. PCA algorithm applied to isogrid strain data. Blue lines are damage indexes calculated from strains acquired on the undamage structure, each experiment means a new data acquisition (load level); green line correspond to data taken under increasing loads, first failure happened at test 400.
3.2 Damage detection for a wind turbine blade (WTB)
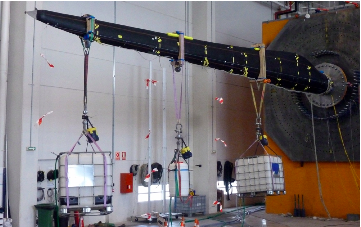
Compared to the former case, this experiment has two added difficulties: Firstly, the load cases are not as simple as it was for the isogrid structure, always uniformly distributed compressive loads of increasing values. As shown at Figure 11, different load cases, or distribution of weights were loads were applied, may be done; consequently, it will be found that there is not a single dominant Principal Component, the first three components play a similar role.
Fig. 11. PCA algorithm applied to isogrid strain data.
The second difficulty comes from the nature of the inflicted damage. To do a representative experiment, the typical damages that happen in WTB were reproduced, that is a partial debonding of the shells at the trailing edge The blade 13,5 mt long, manufactured in the conventional way as a long spar with two bonded shells, was instrumented with 4 optical fibres, with 6 FBGs each, regularly spaced. For a cantilever beam under flexural loads, a partial trailing edge debonding changes the torsional stiffness, but do not alter strongly the bending stiffness.
As before, the structure was submitted to loads of increasing levels, and strains were recorded, first without any damage, to obtain the baseline, and next after artificial damages.
[insert Figure 12]
Figure 12. PCA algorithm
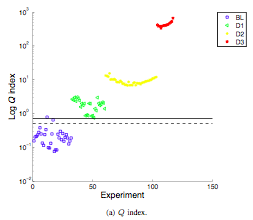
The damage index was calculated, and it was found that when debonding was 100 mm long, it was clearly detectable. Results are shown at figure 13, green dots. Obviously when new damages were inflicted at the main spar, as load carrying member, they were more easily detectable.
Figure 13. PCA algorithm applied to the Wind turbine blade
4 Discussion
Two independent approaches have been described and experimentally validated. The first one is based on detecting the new strains appearing as consequence of a damage, it requires a sensor to be located just there; it is a very robust technique, and very simple to apply, but the area of damage detection is limited to the fiber path. It should not be misconsidered, it has similar qualities for damage detection as CVM, which currently is the only certified SHM technology for aircraft structures. The examples given demonstrate the high resolution of the technique; being able to detect delaminations as small as 5 mm (twice the resolution of the OFDR distributed interrogation systems).
The second approach offers a full coverage of the whole structure. The two examples given demonstrate that the algorithm PCA is easy to apply, and that the damage index Q consistently identify the damaged structure.
Acknowledgements
This work was partially supported by the Spanish Ministry of Economy, Industry and competitiveness (grant number TRA2014-58263-C2-2-R)
References
1. C. R Farrar, K. Worden. An introduction to structural health monitoring. Phil. Trans. R. Soc. A (2007) 365 303-315
2. N.D.W. Glossop, S. Dubois, W. Tsaw, M. Leblanc, J. Lymer, R.M. Measures ∗, R.C. Tennyson, Optical fibre damage detection for an aircraft composite leading edge, Composites Vol. 21, 1990, Pages 71-80
3. R. Di Sante Fibre Optic Sensors for Structural Health Monitoring of Aircraft Composite Structures: Recent Advances and Applications. Sensors 2015, 15, 18666-18713
4. Güemes, A.,. Fiber Optic Strain Sensors. NATO Lecture Series, DOI: 10.14339/ STO-EN-AVT-220-03 (2014)
5. Guo, H.; Xiao, G.; Mrad, N.; Yao, J. Fiber Optic Sensors for Structural Health Monitoring of Air Platforms. Sensors 2011, 11, 3687-3705.
6. Peng Ren * and Zhi Zhou A Review on Strain Based Damage Detection Strategies for Structural Health Monitoring, Pacific Science Review, vol. 15, A, no 3, 2013, pp. 1~7
7. Li, Y . Y ., “Hypersensitivity of Strain-based Indicators for Structural Damage Identification: A Review”, Mechanical Systems and Signal Processing, Vol. 24: 653–664, 2010.
8. Grooteman FP (2012) Damage detection and probability of detection for a SHM system based on optical fibres applied to a stiffened composite panel. ISMA2012, Leuven
9. Piet Christof Wölcken, Michael Papadopoulos, Smart Intelligent Aircraft Structures (SARISTU),
10. Güemes, A, Fernandez-Lopez, A, Soller B. “Optical Fiber Distributed Sensing. Physical Principles and Applications” J. Structural Health Monitoring, Vol. 9, No. 3, 233- 245. (2010)
11. Leung, C. K., Wan, K. T., Inaudi, D., Bao, X., Habel, W., Zhou, Z., ... & Imai, M. (2015). Review: optical fiber sensors for civil engineering applications. Materials and Structures, 48(4), 871-906.
12. Barrias, A.; Casas, J.R.; Villalba, S. A Review of Distributed Optical Fiber Sensors for Civil Engineering Applications. Sensors 2016, 16, 748.
13. Ye XW, Su YH, Han JP. Structural Health Monitoring of Civil Infrastructure Using Optical Fiber Sensing Technology: A Comprehensive Review. The Scientific World Journal. 2014
14. Mikko Jaaskelainen. "Fiber optic distributed sensing applications in defense, security, and energy", Proc. SPIE 7316, Fiber Optic Sensors and Applications VI, 731606 (2009)
15. M Kunzler; E Udd; S Kreger; Damage Evaluation and Analysis of Composite Pressure Vessels Using Fiber Bragg Gratings to Determine Structural Health. Air Force Research Laboratory (AFMC) CONTRACT NB F04611-02-C-0007 (2005)
16. Güemes, A., Fernandez-Lopez, A., Lozano, A. Fiber Optic Distributed Sensing. NATO-STO Lecture Series, DOI: 10.14339/STO-EN-AVT-220-04 (2014)
17. Hideaki MURAYAMA, Daichi WADA, and Hirotaka IGAWA, “Structural Health Monitoring by Using Fiber-Optic Distributed Strain Sensors with High Spatial Resolution,” Photonic Sensors (2013) Vol. 3, No. 4: 355–376
18. Shu MINAKUCHI* and Nobuo TAKEDA Photonic Sensors (2013) Vol. 3, No. 4: 345–354 Damage monitoring of CFRP bolted joints using Brillouin strain distribution
19. Güemes, A., Fernandez-Lopez, A., Diaz-Maroto, P. F. A permanent inspection system for damage detection at composite laminates, based on distributed fiber optics sensing .8th International Symposium on NDT in Aerospace, November, 2016.
20. J. Sierra, A. Güemes and L. Mujica. Damage Detection by Using FBGs and Strain Field Pattern Recognition Techniques. Smart Materials and Structures. 25011-25020. 2013
Document information
Published on 29/04/18
Accepted on 29/04/18
Submitted on 29/04/18
Volume 02 - Comunicaciones Matcomp17 (2018), Issue Num. 2 - Aplicaciones y compuestos multifuncionales, 2018
DOI: 10.23967/r.matcomp.2018.04.014
Licence: Other
Share this document
Keywords
claim authorship
Are you one of the authors of this document?
