1 Introduction
The degradation of concrete infrastructures is a growing concern in cold countries due to the high costs of maintenance and repair. Research to tackle freeze-thaw related problems has been studied for many years, but has not been fully explained yet. The evaluation of resistance of concrete caused by Freezing and Thawing (F-T) cycles is mainly evaluated by accelerated laboratory tests which are subject to several standards such as, UNE 12390-9 [1], ASTM C666/C666M-03 [2], JIS A 1148-2001 [3], and Rilem TC 176-IDC [4, 5], among others.
The damage caused by freeze-thaw cycles in concrete is a complex process in which a dilation is produced of cement paste and/or aggregates when the water is frozen in a porous structure among others factors. This dilation process produces stress and when it goes beyond the limit the desintegration of the material may occur. The produced stresses are believed to be due to several factors, such as: hydraulic pressure generated when growing ice crystals displace unfrozen water, growth of capillary ice crystals, and osmotic pressures.
The strain variations have been characterized by several authors using strain gauges at the surfaces [6-7-8-9] or embedded in the specimens [10-11-12]. It is, generally known that concrete exhibits predominately linear contractions down to -20ºC [13] and a hysteresis may be observed in the strain temperature behaviour. Recently, investigations have shown the possibilities of fiber optic sensors embedded in concrete to measures strains [14-15].
In the F-T trials a real-time continuous monitoring of the behaviour of concrete during the tests is limited. In this sense, recent works have been published, where a monitoring of temperature, humidity and ultrasonic velocity was made along with freezing-thawing cycles, using embedded sensors [16] and strain measurements by strain gauges [17].
The embedded sensors and systems are essential for structural damage detection and control. They can be used to sense stress/strains and other parameters like temperature, humidity, and corrosion.
In this respect, the amorphous glass-coated microwires are a novel and quite promising material for technological applications. These microwires are composite materials that consist of metallic nucleus of diameter (from 100 nm to 100 µm) covered by a glass-coating with 500nm-20 µm thickness. Proposed tiny sensors can avoid any disturbance to the stress state of the concrete structure; insulating glass-coating being resistant to the alkaline environment of the cement material and very simple but efficient preparation method [18].
The cement-based stress/strain sensor was developed by utilizing the stress/strain sensing property of an embedded magnetic microwire in cement-based composite (MMCC) [19] where the microwire is placed coaxially in the center of a pick-up coil. This is a contact-less type sensor, that measures the magnetic induction variations related to the modification of hysteresis loop of the embedded microwire. Typically the remagnetization process of Fe-rich microwires runs past the propagation of a single-domain wall [18-21] along the microwire. It de-pins, or disconnects from the microwires end at a certain magnetic field called, the switching field. Consequently an electromotive force is generated when the domain wall passes through the pick-up coil, and a sharp peak may be displayed on the oscilloscope screen.
In our case, induced mechanical stresses when decreasing and increasing the temperature during the freezing-thawing cycles should be expected. Because of these phenomenon, the strain can be both, compressive and tensile, under decreasing or increasing temperature respectively [13].
The aim of this article is to study the internal strain of freeze-thaw exposure by MMCC sensors, as well as strain variations at the surface of the specimens by means of strain gauges. In addition, measurements of ultrasonic pulse velocity through the concrete specimens were taken simultaneously during the freeze-thaw cycle. This study is made in an Ultra High Strength Concrete (UHSC). During the F-T cycles the temperature and relative humidity was monitored together with ultrasonic signals by a Wireless Sensor Network (WSN), and WilTempUs, was developed by the research group. It is believed that strain variations would be an important part of any comprehensive model concerning freeze-thaw behaviour of concrete.
2 Experimental Section
In this work a characterization of the microwire and the MMCC sensor was made previously to F-T cycles in the concrete specimens, and to decoupling the possible effects and assess the behaviour of these components in relation to temperature.
2.1 Microwire
A glass-coated amorphous microwire with a nominal composition of Fe71.7B13.4Si11Nb3Ni0.9 (magnestostriction constant of λs ≈ 30×10−6), fabricated according to the Taylor-Ulitovsky method [18] was used to fabricate the MMCC sensor. The microwire length was 60 mm. A description of fabrication process can be found at [18, 19].
2.2 MMCC sensor
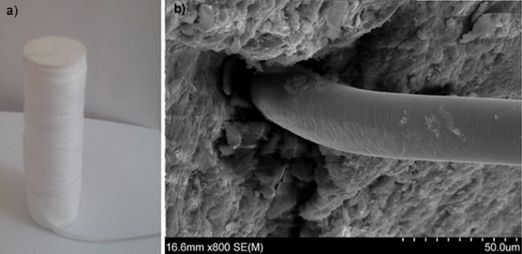
The MMCC sensors were made of magnetic microwires embedded in mortar, figure 1a. The use of magnetic microwires allows for the creation of a built-in stress/strain sensor inside the material without affecting its mechanical behaviour. The magnetic microwire was inserted into the axis of a mortar cylinder. The cylinder geometry was chosen because the calibration of the sensor is simple. Figure 1b shows an electronic micrograph of an embedded magnetic microwire in the transverse plane in the sectioned mortar cylinder.
The mix proportions of the mortar are shown in Table 1. The mix proportions of the cement-based composite were designed to obtain a similar compressive strength in relation to the aggregates used. The mortar was fabricated and stored in cylindrical mold for 24 hours; and after demolding, it was placed in immersion at 20ºC for 28 days. In this work, the mortar cylinder was fabricated with a diameter of 25mm and length of 64 mm of length. The process to cast and calibration of the MMCC sensor was similar to the use in [19].
| Materials | Mortar | UHSC |
| White cement I 52.5R | 0.150 kg | 506 kg/m3 |
| Siliceous sand | 0.450 kg | 1033 kg/m3 |
| Water | 0.0675 kg | 180 kg/m3 |
| Gravel | 698 kg/m3 | |
| Sika Viscocrete 5990 | 2.2% of weight of cement |
2.3 Concrete with MMCC sensor
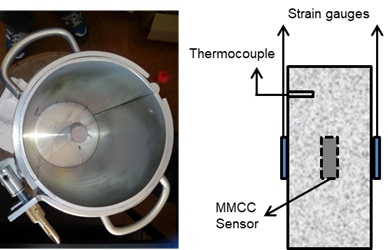
The MMCC sensor was placed in a vertical position, perpendicular to the base of the cylindrical mold and centred in height and width as shown in Figure 2a. The sensor was fixed in that position in the mould by means of four loops of nylon wire and before casting in concrete. During the fabrication process a thermocouple was placed in the upper part of the specimen, Figure 2b.
The ultra-high strength concrete (UHSC) was cast and stored in cylinder molds of 150x300 mm with a mixing parameter presented in Table 1. The high compressive strength was obtained by the combination of silica fume and superplasticizer (Khemeflow 1010 of Kheme Chemical S.L.) and a maximum size of gravel of 12 mm. Cylindrical concrete specimens were demolded after 24 hours and placed in a 100% RH curing environment during 28 days prior to testing. The density of concrete was determined before the F-T cycles with the specimens dry, and saturated, 2375 and 2387 kg/m3, respectively.
2.4 Test procedures
2.4.1 Compressive strength and elasticity modulus test
The determination of compressive strength and elasticity modulus in concrete were made according to UNE standards [22-23]. The compressive strength was determined after 40 days of curing and the elasticity modulus after 40 and 270 days of curing (under controlled moisture and temperature conditions). Both tests were made in the compression testing machine MEH, for structural and high strength materials.
2.4.2 Freeze-Thaw cycles
The specimens were immersed in water during 72 hours and subjected to repeated F-T cycles, being in total 28 cycles. Two types of F-T cycles were applied, using the same temperature range but different duration, as shown in Figure 3. The first two were denominated long cycle (Figure 3a) and the rest were the short cycles (Figure 3b). All F-T cycles were made in a DYCOMETAL CCK-40/1000 climatic chamber.
The F-T cycle, once finished, the microwire was embedded in a mortar. After the curing process of the mortar and the casting of the MMCC sensor it was subject to 28 F-T cycles, as shown in Figure 3a, to study the durability of mortar and stability of microwire. As soon as the cycles are finished the MMCC was placed in the concrete specimen during the fabrication process.
2.1.1 Monitoring during the Freeze-Thaw cycles
In this paper the concrete resistance to frost was evaluated by monitoring the temperature, ultrasonic parameters and internal and external strains along all F-T cycles.
The internal temperature in concrete was measured by a thermocouple embedded in the specimen during the casting process. The thermocouple was connected to a data acquisition system to record the temperature.
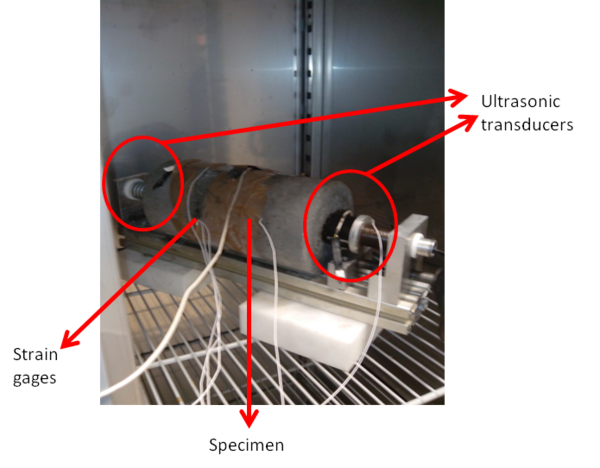
The ultrasonic measurements were made along the specimen and placed in a device that allows constant pressure to be kept along all the cycles, as shown in Figure 4, to overcome decoupling between transducers and the specimen. These measurements were made in transmission mode with longitudinal wave transducers of 54 kHz frequency. Meanwhile, the temperature in the climatic chamber was measured by means of a commercial sensor, SHT1 from Sensirion Company. Both parameters were measured with a wireless system network, WilTempUS, developed by the research group [24]. This system allows the simultaneous acquisition of two channels for temperature, relative humidity, and generates and receives the A-scan signals.
The ultrasonic velocity (V) was determined by the travelling time of the ultrasonic pulses in the specimen (t), the thickness (d = 300 mm) considered constant along all cycles and the reference travelling time (t0) in order to calibrate the ultrasonic acquisition system using a referenced aluminium specimen:
|
|
(2) |
The travel time, from the A-scan signals, was calculated using a zero-crossing algorithm. Further details can be found in [16].
In addition, the longitudinal and transversal velocity was measured manually using transducers of 54 kHz of Proceq and 250 kHz (V150 Panametrics) and the Pundit equipment, before the F-T cycles. The transversal velocity was also determined with the frozen sample at -18ºC during 12 hours. From the measurement of longitudinal and transversal velocities the dynamic elasticity modulus and Poisson ratio was calculated.
The variation of internal and surface stress of a concrete cylinder with temperature has been measured by MMCC and strain gages, respectively; see testing arrangements reported in figure 2b. The strain gauges with 10 mm in-length were bonded on the surface of a concrete cylinder by using quick-setting adhesive. They were installed symmetrically in the same transverse plane of the cylinder and connected to a data acquisition system.
The arrangement of MMCC sensor was described in subsection 2.3 and the set-up for the measurements is similar to what has been described in [19]. All measurements were recorded at 5 minutes along of the cycles and storage in PC for further processing.
3 Results and Discussion
3.1 Results of mechanical testing
The compressive strength of ultra-high-strength concrete after 40 days was 112 MPa, with a deviation less than 3%. The static elasticity modulus at 40 and 270 days was 38.5 GPa and 39.5 GPa, respectively, and this indicated that the properties were kept constant.
3.2 Results of temperature monitoring during the F-T cycles
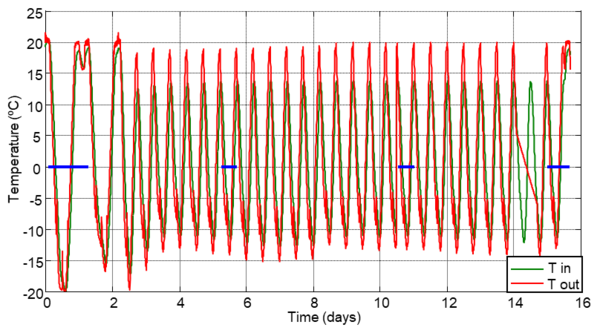
The temperature behaviour inside the concrete specimens (Tin) and the ambient conditions (Tout) in the climatic chamber along all F-T cycles is represented in Figure 5. The two first cycles were slower, after 24 hours, and to achieve that the temperature in the interior of concrete was equal to external temperature. In the rest of cycles it can be observed that the internal temperature is quite different to the ambient in the climatic chamber, this behaviour is more accentuated in the thawing stage. During the freeze stages, several peaks are observed in the curve of external temperature that correspond to the defrost process of the climatic chamber. This behaviour is not observed in the internal temperature. In the cycle 25, a discontinuity is observed due to a problem with the monitoring system. The blue lines on x-axis shown in Figure 5 points to the selected cycles, to study the comparative behaviour of strain gauges and the MMCC sensor.
3.3 Results of the ultrasonic measurements
The elastic properties determined from the longitudinal and transversal velocities are shown in Table 2. The dynamic elasticity modulus at 25ºC is similarly determined from the static tests, if you take into account the relation between static and dynamic modulus, E and Ed; proposed by Lydon and Balendran, E=0.83Ed [23].
| Temperature | E (GPa) | Poisson ratio |
| 25ºC | 46.3 | 0.257 |
| -18ºC | 48.4 | 0.264 |
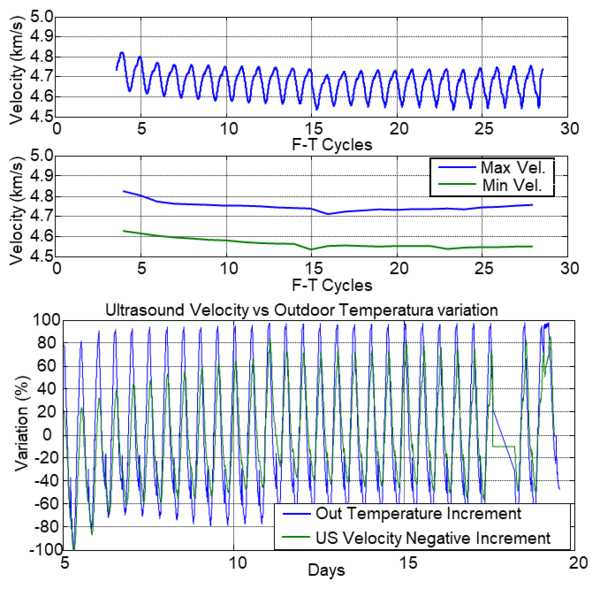
The behaviour of the ultrasonic velocity from the cycle 5 is shown in Figure 6. It can be seen that the velocity measurements follow the F-T cycles, and they increase as the temperature decreases and vice versa. The differences of velocity between the freeze and thawing cycles in the concrete is presented in Figure 6. These differences were calculated at the plateau of the cycles. The maximum velocity corresponds to the frozen concrete, and the decrement of this parameter indicates that the volume of ice increases progressively along the cycles. During the cycles, the difference between maximum and minimum velocity is constant, which indicates that the concrete is not damaged [16].
3.4 Results of the strain gauges measurements along of F-T cycles
The strain gauges are used for the measurement of strain. This technical term "strain" consists of tensile and compressive strain, distinguished by a positive or negative sign, respectively.
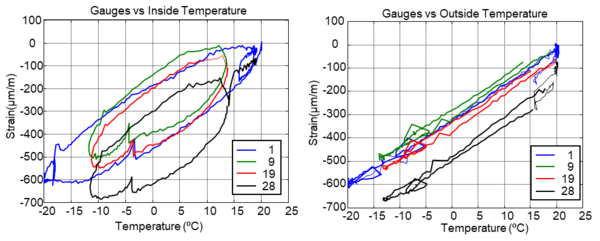
The behavior of external strains determined by the strain gauges as a function of internal and external temperature is represented in Figure 7. In both cases the behavior is similar, and the compressive strains under F-T cycles decreases at lower temperatures. Figure 8 shows a clear hysteresis on the F-T cycles, and the hysteresis increases between the freeze and melting and between the first and last F-T cycles. The climate chamber and specimen don’t take the same values of temperature at the same time. The obtained strains by the F-T cycles are similar until cycle 19, however cycle 28 shows that the deformations are not recovered completely, which indicates a generation of residual strains. The same slope of the hysteresis cycles in Figure 8b shows that the coefficient of thermal expansion reaches almost the same value during the FTC cycles, which indicates that the concrete is not damaged.
3.5 Results of MMCC sensor measurements along of F-T cycles
3.5.1 Effects of the temperature on the amplitude and position of the signal corresponding to switching field
One of the objectives of this paper is to investigate the internal strain of freeze-thaw exposure by means of the magnetic reversal process in a prepared amorphous glass-coated microwire.
One must be careful in order to avoid any temperature dependence of the copper coils. The coil resistance has a manufacturing tolerance (+/-5%) at room temperature, but the resistance of the wire has a positive temperature coefficient so coil resistance will increase as wire temperature increases, or decrease as wire temperature decreases.
Two stress sensing properties of the embedded sensor as a function of the temperature were studied: the amplitude and the position of the voltage peak in relation to the magnetic switching field.
The effect of temperature should be eliminated during the measurements in expectation of a stable excitation signal. To deal with this issue, the signal of the generator was compensated by means of continuous monitoring.
Also in this investigation, we choose a moderate excitation frequency of the excitation magnetic field, resulting in a better sensitivity to the mechanical stress [24] and small enough to keep the triangular shape of the exciting field.
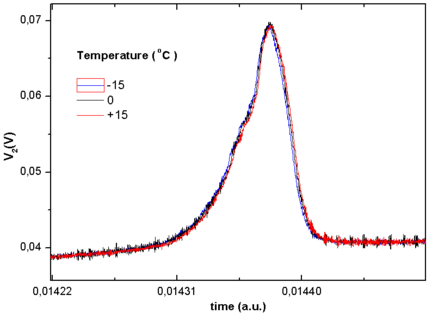
Change of shape (peak amplitude and peak position) of the voltage from the pick-up coil for the temperature range used in this work is showed in Fig. 8, and does not change appreciably over the operating temperature range.
3.5.2 3.5.2 Measurements of MMCC along the F-T cycles
From the below discussed experiments (Fig. 9a y 9b), it has been noticed that the amplitude-temperature behaviour of concrete with embedded microwires is quite linear over the whole operating temperature.
First of all, we should consider the properties of the main parts of the composite, i.e. UHSC concrete, the mortar MMCC cylinder and the amorphous metallic microwire [25]. Mortar MMCC sensor will expand when it is heated, and contract when it is cooled if it was free to deform. Consequently, such phenomenon acting upon the microwire should decrease or increase the internal stresses inside the metallic nucleus, similar to what has been observed in composites [26-27]. Since in the major part of the metallic nucleus the tensile stresses are the largest ones, the observed variation of the peaks amplitude and position can be related to the reinforcement or compensation of that internal tensile stresses.
This means that the amplitude of the MMCC sensor should be required to follow the strain-temperature behaviour of UHSC concrete, the same as was shown by the strain gauges in surface, (Figure 7b). For example, as temperature decreases, because of the shrinkage that take place in the UHSC concrete, the strain can be compressive under decreasing temperature. As was shown in ref. [19], such compression upon the amorphous microwire, gradually decreases the relative volume of the axially magnetized inner core which leads to a lower value of the induced voltage peak. However, in contrast to the behaviour found in that study the corresponding peak positions shifts at lower field in the opposite sense. We may assume that the domain wall at the end of the microwire becomes stronger at low temperatures and the switching field increases similarly as it was found in [28].
The variations of the amplitude of the peak from microwires versus temperature are very linear and anhysteretic, with respect to the internal temperature, as shown in Figure 9a. The behaviour of the determined strain by MMCC during the first cycle agrees with the obtained results by strain gauges (see Figure 7), i.e., a higher deformation in long cycle. During the short cycles, a residual strain is observed in Figure 9, but it is smaller than the measured by the strain gauges and after 19 cycle remains constant.
4
Conclusions
Thermal stress is one of the reasons for which there are induced cracks in concrete under the action of repeated freeze-thaw cycles. In order to monitor the strain of concrete which caused by freeze-thaw (F-T) cycles, a microwire-based sensor has been proposed. To study its feasibility a comparative study between strain gauge and microwire-based embedded sensor has been carried out. As introduced above, it is very important to emphasize the decisive role played by the way the microwire is covered, when a different temperatures are going to be applied. The results indicate that the proposed monitoring method is viable and the residual strain increases with F-T cycles.
Acknowledgments
This work was supported by Ministerio de Economía y Competitividad of Spain in the Call Retos Investigación [BIA2016-77992-R (AEI/FEDER, UE)]; by CSIC in the Call ICOOP 2017 [COOPB20293]; and by Ministery of Higher Education, Science and Technology (MESCYT) of the Dominican Republic (2015 FONDOCYT program for research).
References
1. Testing Hardened Concrete - Part 9: Freeze-Thaw Resistance - Scaling; UNE-CEN/TS 12390–9 EX; AENOR: Madrid, Spain, (2008).
2. Standard Test Method for Resistance of Concrete to Rapid Freezing and Thawing; ASTM C 666/C666M-03; ASTM International: West Conshohocken, PA, USA, (2003).
3. Method of Test for Resistance of Concrete to Freezing and Thawing; JIS A 1148:2001; Japanese Industrial Standards: Tokyo, Japan, (2001).
4. L. Tang, P.-E. Petersson. Materials and Structure. 37, 754–759, (2004). https://doi.org/10.1007/BF02480522
5. M.J. Setzer, et al. Materials and Structure, 37, pág. 743–753, (2004). https://doi.org/10.1007/BF02482179
6. V. Penttala, F. Al-Neshawy. Cement Concrete and Research, 32, pág. 1407-1420, (2006). https://doi.org/10.1016/S0008-8846(02)00785-8
7. M. Hasan, H. Okuyama, Y. Sato, and T. Ueda. Journal Advanced. Concrete Technology, 2, pág. 89-99, (2004). https://doi.org/10.3151/jact.2.89
8. H.L. Romero, M.J. Casati, J.C. Gálvez, M. Molero, and I. Segura, Study of the damage evolution of the concrete under freeze-thaw cycles using traditional and non-traditional techniques. XIII International Congress on the Chemistry of Cement, (2011).
9. E. Sicat, F. Gong, D. Zhang and T. Ueda. Journal Advanced. Concrete Technology, 11, pág. 333-346, (2013). https://doi.org/10.3151/jact.11.333
10. S. Bishnoi and T. Uomoto. Cement Concrete and Composites, 30, pág. 374-380, (2008). https://doi.org/10.1016/j.cemconcomp.2008.01.005
11. L. Wang, Y. Cao, Z. Wang, and P. Du. Journal of Wuhan University of Technology-Mater. Sci. Ed., 28, pág. 710-714, (2013). https://doi.org/10.1007/s11595-013-0757-7
12. Y. Ge, Z.E.B. Elshafie, M.; S. Dirar, and C.R. Middleton. Construction and Building Materials, 70, pág. 279-290, (2014). https://doi.org/10.1016/j.conbuildmat.2014.07.102
13. T. Miura, D. H. Lee. Deformation and Deterioration of Concrete at low Temperatures, in Freeze-Thaw and de-icing resistance of concrete. RILEM Committee TC-117 FDC, pág.19-34, (1991).
14. S. Yehia, T. Landolsi, M. Hassan, and M. Hallal. Measurements, 52, pág. 33-46,(2014). https://doi.org/10.1016/j.measurement.2014.02.030
15. T.L. Yeo, Y. Yuan, L.F. Boswell, T. Sun, and K.T.V. Grattan, Sensors and Actuators A, 153, pág. 166-170, (2009). https://doi.org/10.1016/j.sna.2009.04.031
16. J. Ranz, S. Aparicio, H. Romero, M.J. Casati, M. Molero, and M.G. Hernández. Sensors, 14, pág. 2280-2304, (2014). https://doi.org/10.3390/s140202280
17. H. L. Romero, M. J. Casati, J. C. Gálvez, M. Molero, and M. G. Hernández. Deterioro del hormigón sometido a ciclos de hielo-deshielo en presencia de cloruros. XXVIII Congreso del Grupo Español de Fractura. Gijón, España. Abril, (2011).
18. A. Zhukov, M. Ipatov, M. Churyukanova, A. Talaat, J. M. Blanco and V. Zhukova. Journal of Alloys and Compounds, 727 pp. 887-901, (2017). https://doi.org/10.1016/j.jallcom.2017.08.119
19. J. Olivera, M. González, J.V. Fuente, R. Varga, A. Zhukov, and J.J. Anaya. Sensors, 14, 19963-19978, (2014). https://doi.org/10.3390/s140202280
20. V. Zhukova, J. M. Blanco, V. Rodionova, M. Ipatov and A. Zhukov. Journal of Applied Physics 111 (2012) 07E311. https://doi.org/10.1063/1.3672076
21. R. Varga , K.L. García, M. Vázquez, A. Zhukov, P. Vojtanik. Physical Review B, 70, 024402-1, (2004). https://doi.org/10.1103/PhysRevB.70.024402
22. UNE-EN 12390-3:2009. Testing hardened concrete. Part 3: Compressive strength of test specimens.
21. UNE-EN 12390-13:2014. Testing hardened concrete. Part 13: Determination of secant modulus of elasticity in compression.
22. J. Ranz. Caracterización no destructiva del proceso de curado en materiales cementicios. Doctoral Thesis, Marzo, (2015).
23. J.S. Popovics , J. Zemajtis, and I. Shkolnik, A Study of Static and Dynamic Modulus of Elasticity of Concrete. ACI-CRC Final Report, (2008).
[24]. Zhukov, A.; González J.; Blanco J.M.; Vazquez M.; Larin V.; Torcunov A. in: H.S. Nalwa (Ed.) Nanocrystalline and Amorphous Magnetic Microwires: Encyclopedia of Nanoscience and Nanotechnology, American Scientific Publishers, (Chapter 62), p. 23, 2004.
[25] H. Chiriac, T.A. Ovari and Gh. Po. Physical Review B 42 (1995) 10105. https://doi.org/10.1103/PhysRevB.52.10104
[26]. A. Allue , et al. Composites Part A: Applied Science and Manufacturing 120 pp.12–20, (2019). https://doi.org/10.1016/j.compositesa.2019.02.014
[27]. A. Zhukov, et al. Journal of Magnetism and Magnetic Materials 203 pp. 238-240, (1999). https://doi.org/10.1016/S0304-8853(99)00240-1
[28] R. Varga, K.L. Garcia, A. Zhukov, P. Vojtanik, M. Vazquez. Applied Physics Letters 83, pp. 2620-2622, (2003). https://doi.org/10.1063/1.1613048
Document information
Published on 21/06/22
Accepted on 21/06/22
Submitted on 20/06/22
Volume 05 - Comunicaciones Matcomp19 (2021), Issue Núm. 3 - Procesos de Fabricación – Materiales Funcionales., 2022
DOI: 10.23967/r.matcomp.2022.06.031
Licence: Other
Share this document
claim authorship
Are you one of the authors of this document?
