Abstract
Attempting at the problems of surrounding rock pressure and initial supporting stress of deep-buried soft rock tunnel, a soft rock highway tunnel project in Northwest China was monitored on-site for surrounding rock deformation, surrounding rock pressure, initial stress and other items.Discuss the deformation laws and stress characteristics of surrounding rock and steel arch at different construction stages, and compare and analyze the deformation control effect of surrounding rock with different initial lining thickness, different initial elastic modulus and different anchor length through numerical simulation.The results show that the excavation stage of the upper step is a stage where the pressure and deformation of the surrounding rock increase rapidly. The steel arch support is mainly compressed, and the average stress can reach more than 50% of the peak value within 5 days. The stress is mostly higher than the measuring point of the lower step. The initial steel frame support of the upper step and the middle step bears a greater load. The excavation of the upper middle step should be "passed quickly and supported in time", and the construction should adopt The “letting first,then resisting” method appropriately increases the reserved deformation of the surrounding rock to relieve the support stress of the primary steel frame. When the deformation of the surrounding rock and the growth rate of the surrounding rock pressure slow down, the secondary lining can be applied in advance. The research results can provide reference and reference for the design and construction of similar tunnel projects.
Keywords: Weak surrounding rock, surrounding rock pressure, initial support stress, on-site monitoring, numerical simulation
1. Introduction
In recent years, China's transportation construction has been increasingly developed, and the length of highway and railway construction has reached a new milestone [1]. More and more tunnels encounter the phenomenon of a weak surrounding rock stratum or complex stress in construction. Excessive surrounding rock pressure is easy to cause insufficient support and leads to primary support invasion limit, large deformation of the surrounding rock, and even instability failure. Foreign projects such as Tauern tunnel (Austria), Enasan tunnel (Japan), domestic projects such as Jiazhuqing tunnel, wushaoling tunnel, etc. [2-3] have weak surrounding rock, the surrounding rock pressure big cause the invasion at the beginning of the limit of extrusion deformation characteristics of surrounding rock stress after the excavation is too large, affect the construction progress, causing delays and economic losses.
Scholars at home and abroad have done a lot of research in the field monitoring of surrounding rock pressure and primary supporting stress and the relationship between surrounding rock and supporting action and obtained abundant results. Salamon [4] studied the interaction and deformation between a surrounding rock and supporting structure and the energy transfer relationship between supporting structure and surrounding rock during the deformation process, and believed that supporting structure absorbed the energy released by surrounding rock and could control surrounding rock strain. Lunardi [5-6] analyzed the deformation effect of surrounding rock during tunnel excavation by summarizing a large number of tunnel engineering experience and proposed the construction method of rock-soil controlled deformation analysis (AdECO-RS). Orestel [7] proposed a method to determine the response curve of wall-support structure system interaction by studying the hardening characteristics of shotcrete. Pan and Dong [8], based on viscoelastic mechanics, studied the influence of tunneling rate on the interaction between surrounding rock and support structure system when considering the hardening characteristics of shotcrete. Peng et al. [9] analyzed the distribution characteristics of contact pressure between surrounding rocks and the support structure by on-site monitoring and theoretical analysis and proposed that the support design could adopt the lateral stiffness of the initial support steel frame and asymmetric design. Based on the field monitoring method adopted by Tianpingshan tunnel, Yong et al. [10] analyzed the interaction between the distribution characteristics of surrounding rock pressure and the supporting structure and proposed that the supporting form with faster deformation of surrounding rock is better to use section steel support than grid support. Dong [11] used theoretical analysis and field measurement to analyze the influence of support timing, buried depth, and other factors on the calculation results of surrounding rock pressure. Based on the field monitoring data, Mingnian et al. [12] analyzed the influence of the level of surrounding rock and the buried depth of tunnel on the deformation pressure of surrounding rock by theoretical analysis. By on-site monitoring, the contact pressure between surrounding rock and support structure, Peng [13] analyzed the law of surrounding rock pressure changing with time and spatial distribution characteristics and calculated the load of surrounding rock secondary lining structure.
At present, many results have been achieved in monitoring measurement and analysis of the surrounding rock pressure and supporting force of soft rock tunnels. However, due to the heterogeneity and complexity of the geological environment of soft rock tunnels, it is still important to carry out systematic monitoring and measurement. The focus of the study, its support and control measures have not yet formed a complete system. According to the soft rock tunnel project of an expressway in Northwest China, the support invasion and distortion occurred during the construction process. Combined with the monitoring of surrounding rock deformation, steel arch stress, surrounding rock pressure and other monitoring of the tunnel, the surrounding rock deformation laws and stress characteristics of deep-buried soft rock tunnels are analyzed, and numerical simulations are carried out for different initial lining thicknesses and different initial elastic modulus. The comparison and analysis of the surrounding rock deformation control effect and surrounding rock pressure of different anchor rod lengths provide a design basis for tunnel construction and support.
2. Project Overview
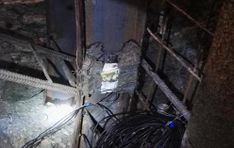
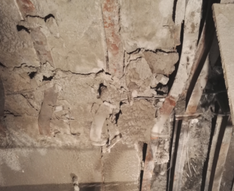
This article relies on a project for a highway soft rock tunnel in northwestern China. It adopts a two-way separation design. The left line tunnel is 5779m long, the starting and ending pile numbers are ZK192+126~ZK197+905, the right line is 5798m long, and the starting and ending pile numbers are YK192+140~YK197+938, both of which are extra-long tunnels. The tunnel has an 811m long inclined shaft. During the construction of the tunnel, the tunnel face collapse, initial support deformation, cracking, and limit invasion occurred during the construction process (Figure 1). The left line pile number ZK197+036~ZK197+313 section has a total of 277m, and the right line pile number YK197+036~YK197+326 total 290m has been changed from the original design level VI surrounding rock to level V surrounding rock. Meters and the second liner in some areas cracked, which seriously delayed the progress of the project [14].
|
| Figure 1. Distortion and deformation of on-site steel frame support |
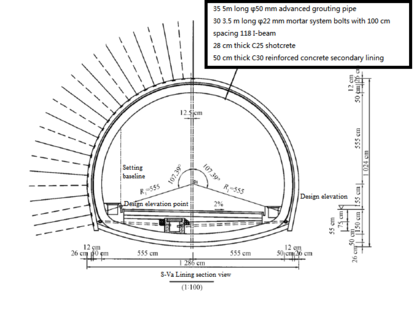
The surrounding rock grade is Ⅴ grade surrounding rock, and the new Austrian method is used for construction and advanced support is provided before the tunnel is excavated. The excavation method is a three-step seven-part method, and the supporting structure is the compound lining, the original design lining support structure parameters of the on-site stress monitoring section of the tunnel (Figure 2), the original design lining support structure parameters of the tunnel in the field stress monitoring section (Table 1).
|
| Figure 2. Structure diagram of the original tunnel lining |
| Lining type | Project | Specification |
|---|---|---|
| Advance support | Model | 50mm Grouting duct |
| Length/m | 5 | |
| Layout range | Arch 120° | |
| Initial support | Shotcrete/cm | 28 |
| Anchor model | 22 mortar bolt | |
| Length/m | 3.5 | |
| Steel frame model | 118 | |
| Steel frame spacing/cm | 100 | |
| Secondary lining | Concrete model | C30 |
| Thickness/cm | 50 |
3. Monitoring and measurement scheme design
3.1 Section layout, measurement method and monitoring content
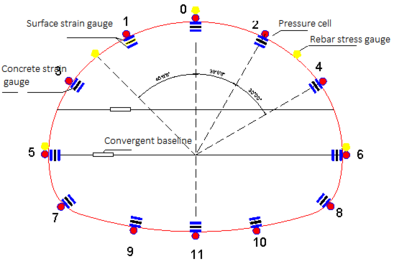
The Ⅴ-level surrounding rock section of the tunnel is selected as the test section for the field test. The layout of the stress monitoring points is shown in Figure 3. The typical section of the tunnel mileage is ZK197+129, and the vibrating wire type JXY-4 dual-mode pressure cell is used, with a diameter of 22mm. The JXH-3 type surface strain gauge monitors the surrounding rock pressure and steel frame stress. The overall monitoring layout time and test element conditions are shown in Tabla 2.
|
| Figure 3. Arrangement of tunnel stress measurement elements |
| Test section | Buried depth (m) | Initial monitoring time | Arrangement (a) | ||||
|---|---|---|---|---|---|---|---|
| Step up | Middle step | Step down | Inverted arch | Pressure box | Surface strain gauge | ||
| Section One | 212 | May 26 | May 29 | June 5 | June 14 | 12 | 24 |
3.2 Surrounding rock pressure and steel arch stress monitoring
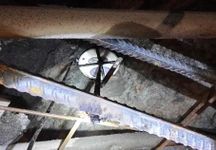
Primary branch surrounding rock pressure cells are arranged along the tunnel outline at each monitoring section, and protective measures are taken when installing the pressure cell to prevent concrete from entering and affecting the results (Figure 4). Steel chord surface strain gauges are respectively arranged on the monitoring section along with the tunnel profile above and below the I-shaped steel arch flange. There are 12 measuring points on each section, and a total of 24 strain gauges are arranged. The layout of monitoring components is shown in Tabla 2. Weld the calibration rod firmly, debug it in time after installing the strain gauge and protect it to prevent the position of the strain gauge from changing (Figure 5).
|
| Figure 4. Stallation of the initial pressure cell |
| Figure 5. Schematic diagram of welding and protection of strain gauge components |
4. Analysis of monitoring results
4.1 Analysis of monitoring results of surrounding rock pressure
The typical section of ZK197+129 is selected for analysis. The section is grade Ⅴ surrounding the rock section, and the construction method is the three-step method. The stress-time curve of surrounding rock above the inverted arch is shown in Figure 6, and the measurement point numbers are 0, 1, 2, 5, and 6 correspond to the vault, left abutment, right abutment, left arch foot and right arch foot, respectively. The measuring points 3 and 4 are damaged. After the excavation of the inverted arch, the pressure cells 7 to 11 are buried. The time-history curve of surrounding rock pressure monitoring at the inverted arch is shown in Figure 7, which specifies that the compression is positive and the tension is negative.

|
| Figure 6. Pressure stress curve of surrounding rock above the invert |

|
| Figure 7. Pressure stress curve of surrounding rock at the inverted arch |
By analyzing the time-history curve of surrounding rock pressure monitoring, the following conclusions can be drawn:
(1) All points of the surrounding rock are under pressure. After excavation on the upper step, the right abutment area increases rapidly with a growth rate of 0.038MPa/d. After excavation on the lower step, the surrounding rock pressure continues to increase with an increased rate of 0.039 MPa/d, reaching 0.81 MPa, the linear growth of the left arch shoulder and the right arch foot, which tends to a stable state after the application of the upward arch, the maximum value reaches 0.18 MPa, 0.20 MPa, and the surrounding rock pressure of the right arch shoulder-first increases slowly and then decreases, The maximum value reaches 0.97 MPa, and the surrounding rock pressure as a whole increase linearly and then stabilizes.
(2) The surrounding rock is loosened again due to the excavation of the lower step, which causes the secondary stress redistribution of the surrounding rock, which leads to a further increase in the surrounding rock pressure. After the upward arch is applied, the surrounding rock pressure increases slowly, and after the second liner is applied, the surrounding rock pressure gradually stabilizes. Therefore, the timely application of the second lining can effectively control the increase of surrounding rock pressure.
(3) After the construction of the upward arch, all parts are under compression. The monitoring results show that the pressure of the surrounding rock at the bottom of the arch increases rapidly with an increased rate of 0.025 MPa/d. After the second lining is applied, the growth rate is slow, and the maximum value is 0.36 MPa. The pressure of the surrounding rock in the middle of the arch increases linearly, and the maximum stress of the surrounding rock is 0.2 MPa, 0.14 MPa, and 0.15 MPa. After the second lining is applied, the growth is slow and gradually stabilizes. The maximum pressure of the surrounding rock at the arch is 0.36 MPa. The overall surrounding rock pressure at the site of the invert is rapidly increasing at first, slowly increasing, and tends to stabilize in three stages. The overall surrounding rock pressure value is less than the upper-stress value of the invert.
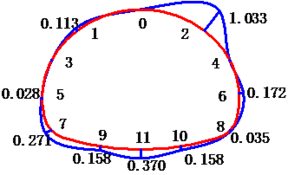
According to the surrounding rock pressure value, make a distribution map of surrounding rock pressure, as shown in Figure 8.
|
| Figure 8. Distribution map of surrounding rock pressure |
It can be seen from Figure 8 that the monitoring data of the surrounding rock pressure in section 1 is relatively complete, and the pressure distribution of the surrounding rock has a certain dispersion. The pressure of the surrounding rock of the right arch shoulder is obviously too large, indicating that there is certain horizontal stress, and the stress in the remaining parts is "upper". The distribution characteristics of "small and large" and the stress value of surrounding rock are within the design range.
4.2 Stress monitoring results of primary steel arch
Figure 9 shows the strain temporal curve of a typical steel arch. It is stipulated that the pressure is positive and the pull is negative.

|
| (a) Strain temporal curve of steel arch (inside) |

|
| (b) Strain temporal curve of steel arch (outside) |
| Figure 9. Stress temporal curve of a steel arch |
According to the analysis of the stress temporal change curve diagram:
(1) The stress of the steel frame of the tunnel is mostly under compression. After the upper step excavation, the stress above the upper arch of the steel frame increases rapidly, and the progress decreases after the excavation of the inverted arch. After the second lining is applied, it gradually stabilizes. Most of the above parts exceed the allowable stress value of the steel frame, and the stress rises first and then slowly, and tends to stabilize in three stages.
(2) The inside of the steel frame is compressive stress. After excavation on the upper step, the right arch waist increases linearly, exceeding the allowable stress value of the steel frame by 215MPa. After the lower guide excavation, the steel frame has a certain amount of sinking, which makes the surrounding rock The loose contact between the steel frames leads to a sudden drop in stress, and the stress value is within the allowable stress value after stabilization; after the lower step is excavated, the stress of the steel frame of the left arch shoulder, right shoulder, left arch waist and left arch foot increases linearly. After the construction of the inverted arch, the growth rate decreased, and the maximum stress values reached 353.5 MPa, 301.4 MPa, 287.3 MPa, and 256.8 MPa. The stress values were greater than the allowable stress values of the steel frame, and some of the test components were subjected to excessive stress due to the steel frame. Damage, the steel frame is dangerous. The stress value of the steel frame of the inverted arch is within the allowable stress range, and the maximum stress value is 76.6 MPa, which is located in the right middle of the inverted arch.
(3) The external stress of the steel frame is compressed except for the right arch foot, and the maximum tensile stress is 76.1 MPa, which is within the allowable range of the steel frame. After the excavation on the upper step, the stress on the dome and the left abutment increased rapidly, and the stress growth rates reached 48.3 MPa/d and 37.98 MPa/d respectively, and the maximum stress values reached 721.8 MPa and 441.9 MPa, respectively. Reduced to 408.1 MPa; the stress of the right arch waist, right shoulder, left arch waist and left arch foot steel frame increased linearly, the stress growth slowed down after applying the upward arch, and the stress was stabilized or tended to stabilize after the second liner was applied. 454.7 MPa, 387.3 MPa, 304.4 MPa, 452.2 MPa, the stress value is greater than the allowable stress value of the steel frame, the test element exceeds the strain measurement range, the steel frame is dangerous, and the steel frame on the scene is distorted. The stress value of the inverted arch is within the allowable range, and the stress of the steel frame at the bottom of the inverted arch is the largest, reaching 95.3 MPa.
(4) After the tunnel is excavated, the stresses at the measurement points of the upper steps are mostly higher than those of the lower steps, indicating that the steel frame of the upper step supporting the initial stage bears a greater load, and the steel frame is closed and looped effectively after the arch is applied. As the stress increases, the stress at the measuring point of the inverted arch is much lower than the upper stress.
5. Optimization analysis of initial support parameters
5.1 Model establishment
The finite element software ABAQUS simulates the study of the initial support lining thickness to influence the surrounding rock pressure and deformation. According to the creative construction method, the law of different initial lining thickness on the surrounding rock pressure distribution and deformation characteristics is obtained, and then the tunnel is targeted. Help modification to the structure to ensure smooth construction.
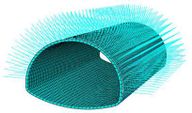
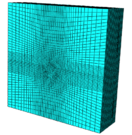
Establish a three-dimensional model according to the actual situation, so that the distance from the excavation section to the calculated boundary is greater than 3 times the maximum hole diameter. The overall size of the model is 100m100m30m, the monitoring section is buried at a depth of 250m, and the upper surface load pressure is taken close to 200m. The formation of gravity is about 5MPa. Displacement constraints are imposed on the front, back, left, right, and bottom boundary conditions of the model. The model uses hexahedral elements, a total of 40110 elements, and uses the Moore-Coulomb constitutive model. The model is divided as shown in Figure 10.
|
|
| Figure 10. Calculation model and meshing of supporting structure | |
5.2 Calculation parameters
The calculation parameters of the rock mass in the model are determined according to the geological report, on-site monitoring results, and the test values of the adjacent tunnels. The tunnel in the simulation section belongs to the Ⅴ-level surrounding rock section. The parameters of the supporting structure are the actual engineering values. In principle, the elastic modulus of the steel frame is converted into the elastic modulus of the concrete lining. The conversion method is shown in the following formula:
|
|
In the formula, is the elastic modulus of concrete after conversion (GPa), the original elastic modulus of shotcrete (GPa), the cross-sectional area of the steel arch (m2), the elastic modulus of the steel arch (GPa) and the crossed area of shotcrete (m2). The calculation related calculation parameters are shown in Table 3.
| Item category | Elastic Modulus E(GPa) |
Poisson's ratio | Cohesion c (MPa) |
Internal friction angle | |
|---|---|---|---|---|---|
| Surrounding rock | 1 | 0.30 | 0.25 | 30 | 25 |
| Anchor | 210 | 0.2 | \ | \ | 78 |
5.3 Calculation results and analysis
5.3.1 Influence of lining thickness on surrounding rock stress and deformation
From the stress change of the surrounding rock, as shown in Figure 11, the thickness of the surrounding rock increases, due to an increase of surrounding rock thickness the increase of overall stress of the surrounding rock, but the increase is small. The analysis shows that the increase in the thickness of the lining increases the support stiffness and the deformation of the surrounding rock cannot be released. While the pressure on the supporting structure increases, the thickness of the lining is limited to the control of the stress release of the surrounding rock. A continued increase in the thickness of the lining has no economic effect on the stability of the surrounding rock, and it can play a role in the surrounding of the deep buried soft rock tunnel. Rock self-supporting and ensure safety can choose 35cm lining thickness to control further deformation of surrounding rock.

|
| Figure 11. Change of surrounding rock stress with lining thickness |
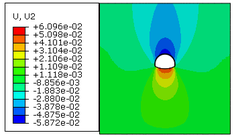
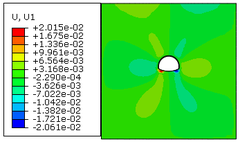
As the thickness of the lining increases, the convergence displacement of the surrounding rock and the settlement displacement of the vault both continue to decrease, but the reduction value is limited, and the changes are more consistent, showing an "inverted L" type change, as shown in Figure 12. The settlement of the dome is the main one. When the thickness increases from 20cm to 25cm, the convergence, and settlement of the surrounding rock decrease significantly, decreasing by 46% and 35% respectively; when the lining thickness increases to 30cm, the variation range of the surrounding rock displacement is small. As the thickness of the lining continues to increase, the settlement of the surrounding rock vault has remained unchanged, and the convergence deformation has decreased, indicating that increasing the thickness of the lining can control the displacement of the surrounding rock within a certain range. When the thickness exceeds 30cm, the convergence displacement of the surrounding rock has As a result, it has little effect on the settlement of the vault. Therefore, the thickness of the lining is 35cm, which has the most economic value. The displacement cloud is shown in Figure 13.

|
| Figure 12. Variation of wall rock deformation with lining thickness |
| |
| Figure 13. Deformation of surrounding rock when the lining thickness is 35cm | |
5.3.2 Influence of initial support elastic modulus on stress and deformation of surrounding rock
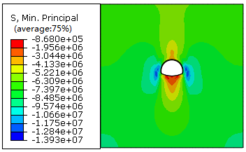
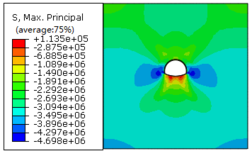
In tunnel construction, the elastic modulus of the primary support structure plays an important role in controlling the stability of the surrounding rock. From the characteristic curve of the surrounding rock support, it can be seen that the greater the elastic modulus of the supporting structure, the greater the stress it bears. As shown in Figure 15, the deformation of the surrounding rock with the elastic modulus of 15 GPa, 25 GPa, and 35 GPa as a function of the elastic modulus can be seen. As the elastic modulus of the initial support increases, the stress of the surrounding rock decreases toward the deep tunnel. It is mainly distributed around the tunnel, and the absolute value of stress is the largest in the arch waist and sidewalls, indicating that an appropriate increase in elastic modulus can effectively control the development of stress relief of surrounding rocks. Overall, the stress of surrounding rock with increased elastic modulus is lower than that of increasing lining thickness, indicating that increasing the elastic modulus allows the surrounding rock stress to be released and at the same time exerts a certain degree of self-supportability of surrounding rock. For the control of the surrounding rock stress of buried soft rock tunnels, increasing the elastic modulus is more effective than increasing the thickness of the lining. The stress cloud is shown in Figure 14.
| |
| Figure 14. Stress cloud diagram of surrounding rock at elastic modulus of 35GPa | |

|
| Figure 15. Change of surrounding rock deformation with an elastic modulus |
5.3.3 Influence of anchor rod length on stress and deformation of surrounding rock
By simulating the surrounding rock pressure cloud at 3.5m, 5m, and 7m, as shown in Figure 16, the increase in the length of the anchor makes the minimum principal stress increase, but the change in the force of the anchor is small, indicating that the anchor The increase in length has little effect on the stress variation of the surrounding rock, the control on the stress release of the surrounding rock is limited, and the safety and economy of the control of the growth bolt on the stability of the surrounding rock need to be discussed.

|
| Figure 16. Change of surrounding rock stress with anchor rod length |
From the results shown in Figure 17 of the displacement curve of surrounding rock, it can be seen that the bolt length increases from 3m to 4m, the dome settlement value and headroom convergence value are reduced by 23% and 29.1%, and the bolt length increases from 4m to 5m. , The two are reduced by 7.5% and 10% respectively, the bolt length is increased from 5m to 7m, the maximum displacement of the surrounding rock is reduced by 6.3%, and the displacement reduction value is smaller when the bolt length is 7-12m; The control of the displacement of surrounding rock by the length of the large bolt is not significant. When the length of the bolt is in the range of 3~5m, the displacement of the surrounding rock decreases with the increase of the length of the bolt. After more than 5m, the displacement of the surrounding rock decreases slowly. The control of the bolt length on the displacement of the surrounding rock is significantly weakened. Therefore, it is more economical to choose a bolt length of 4~5m for deep buried soft rock tunnels.

|
| Figure 17. Change of surrounding rock displacement with anchor rod length |
Conclusion
Based on a soft rock highway tunnel project in northwestern my country, this paper obtained the following conclusions by monitoring and analyzing the surrounding rock pressure and initial support stress at the site:
- When the three-step method is used for construction, the initial surrounding rock pressure increases rapidly, and the surrounding rock pressure increases slowly after the invert is constructed, and the surrounding rock pressure gradually stabilizes after the second lining is constructed. During the excavation stage of the upper step, the deformation of the surrounding rock increases sharply, and the deformation rate is large. The deformation rate of the surrounding rock during the middle step excavation is slowed down. At this stage, the surrounding rock deformation is mainly dominated by the excavation unloading effect, followed by extrusion deformation, which is the key to construction control.
- Steel arch stress monitoring The initial support steel frame is mainly compressed, and the stress of the upper step and the middle step are greater than the stress of the lower step, indicating that the initial support of the upper step and the middle step bears a greater load, and the upper step The middle steps should be passed quickly and supported in time. If necessary, double-layer support can be used.
- The situation is monitored from the site, and the method of first yielding and resisting can be adopted during construction, and the reserved deformation is appropriately increased to relieve the pressure of the initial support, and at the same time enhance the strength of the initial lining support. When the deformation rate of the surrounding rock slows down, the second lining shall be applied in advance.
- Through numerical simulation of the actual project, when the thickness of the lining increases to 30cm, the displacement of the surrounding rock changes little. As the thickness of the lining continues to increase, the settlement of the surrounding rock vault has basically no change. The stress of surrounding rock by increasing the elastic modulus of support is lower than the pressure of surrounding rock when the thickness of the lining is increased, indicating that increasing the modulus of elasticity allows the stress of surrounding rock to be released, and at the same time it can exert a certain degree of self-supporting of surrounding rock. For the control of surrounding rock stress in deep-buried soft rock tunnels, increasing the elastic modulus is more effective than increasing the lining thickness. Increasing the length of the bolt does not have a significant effect on the control of the surrounding rock displacement. When the length of the bolt is in the range of 3~5m, the displacement of the surrounding rock decreases as the length of the bolt increases. When the length of the bolt is greater than 5m, the surrounding rock displacement decreases. The rock displacement decreases slowly, and the control of the bolt length on the surrounding rock displacement is obviously weakened.
Data Availability:The Monitoring data used in this study were obtained from soft rock tunnel project of a Highway in Northwest China .The monitoring content includes Clearance convergence, vault settlement, surrounding rock pressure, spray concrete stress, steel frame stress. The monitoring instruments used include total station, pressure cell, concrete strain gauge and vibrating wire surface strain gauge.Data used to support the results of this study can be obtained from the corresponding author.
Conflicts of Interest
The authors declare that they have no conflicts of interest.
Acknowledgments
This study was supported by National Natural Science Fund Project (Grant No. 41877230), Open Fund of State Key Laboratory of Mechanical Behavior and System Safety of Traffic Engineering Structures (KF020-23).
References
[1] Ministry of Transportation. Statistical Bulletin of the Development of the Transportation Industry in 2018 [N]. China Communications News, 2019-04-12(002).
[2] Zhang Zhidao. Discussion and research on large deformation of squeezing surrounding rock tunnels [J]. Modern Tunnel Technology, 5-12+40,2003(02).
[3]Li Guoliang, Zhu Yongquan. Wushaoling tunnel high ground stress weak surrounding rock large deformation control technology [J]. Railway Engineering Journal, 54-59,2008 (03).
[4] Salamon M.D.G. Rock mechanics of underground excavations[C]. Proc, of the 3rd Congr, of the Inter, Soc, for Rock mech, 1974.
[5] Lunardi P. The design and construction of tunnels using the approach based on the analysis of controlled deformation in rocks [J]. Tunnels & Tunnelling International, 2000: 3-30.
[6] Lunardi, Pietro. Design and construction of tunnels: analysis of controlled deformation in rocks and soils (ADECO[M]. Springer, 2008.
[7]Sulem J,Panet M, Guenot A.Closure analysis, and deep tunnels[J].International Journal of RockMechanics&M Science in&Geomechanics Abstracts,24(3):145-154,1987.
[8]Pan Y W, DongJ J. Time -dependent tunnel convergence- -I. Formulation of the model[J]. InternationalJournal of Rock Mechanics & Mining Sciences, 1991, 28(6):469475.
[9] Sha Peng, Wu Faquan, Li Xiang, Liang Ning, Chang Jinyuan. Compression deformation and supporting stress characteristics of surrounding rock in layered stratum tunnel under high ground stress conditions[J]. Rock and Soil Mechanics, 36(05) :1407-1414, 2015.
[10] Zhao Yong, Liu Jianyou, Tian Siming. Experimental research on the mechanical characteristics of the soft surrounding rock support system of deep buried tunnels [J]. Journal of Rock Mechanics and Engineering, 30(08): 1663-1670, 2011.
[11]Wu Dong. Calculation method and applicability of surrounding rock pressure of mountain tunnel[D]. Beijing Jiaotong University, 2012.
[12] Wang Xiannian, Wang Zhilong, Zhang Xiao, Zhao Siguang, Liu Dagang, Tong Jianjun. Research on calculation method of deformation pressure of surrounding rock of deep buried tunnel [J]. Chinese Journal of Geotechnical Engineering: 1-10.
[13] Tian Peng. Research on surrounding rock pressure and stress characteristics of secondary lining in high-ground stress soft rock tunnels[J]. Railway Standard Design, 60(08): 108-112, 2016.
[14] Wang Yingfan, Liu Qin, Hu Yongzhi, Liu Bingfei, Wei Lai. High deformation stress soft rock tunnel large deformation monitoring and support optimization [J]. Science and Technology and Engineering,,19(30):317-323,2019.
Document information
Published on 06/04/21
Accepted on 03/01/21
Submitted on 24/10/20
Volume 37, Issue 2, 2021
DOI: 10.23967/j.rimni.2021.01.003
Licence: CC BY-NC-SA license
Share this document
claim authorship
Are you one of the authors of this document?
