Abstract
This study proposes a methodology for the calibration of combined sewer overflow (CSO), incorporating the results of the three-dimensional ANSYS CFX model in the SWMM one-dimensional model. The procedure consists of constructing calibration curves in ANSYS CFX that relate the input flow to the CSO with the overflow, to then incorporate them into the SWMM model. The results obtained show that the behavior of the flow over the crest of the overflow weir varies in space and time. Therefore, the flow of entry to the CSO and the flow of excesses maintain a non-linear relationship, contrary to the results obtained in the one-dimensional model. However, the uncertainty associated with the idealization of flow methodologies in one dimension is reduced under the SWMM model with kinematic wave conditions and simulating CSO from curves obtained in ANSYS CFX. The result obtained facilitates the calibration of combined sewer networks for permanent or non-permanent flow conditions, by means of the construction of curves in a three-dimensional model, especially when the information collected in situ is limited.
Keywords: Numerical modelling, constitutive models, hydraulic simulation
1. Introduction
Modeling of a sewer system is recognized as a valuable tool for predicting sewer system response to various wet weather events and assessing water quality impacts when evaluating different control strategies and alternatives. It is also recognized that there are many models which may be used to do this. These models range from simple to complex. The Combined Sewer System modeling (CSS) involves hydrology, hydraulics, and water quality. A model general enough to evaluate a variety of situations typically, needs to be adjusted to the characteristics of a particular site and situation. Model calibration and validation are used to “finetune” a model to better match the observed conditions and demonstrate the credibility of the simulation results [1].
The models will be calibrated for dry weather flow, wet weather flow and a multi-month continuous simulation. The model will be validated using a long-term simulation of up to a year and stress tested for extreme event(s). Monitoring 10 to 20 percent of the CSO regulators in a system generally provides a robust dataset for calibrating collection system models to represent CSOs across the entire system. Between 70 and 90 percent of total CSO is attributable to these principal regulators in many CSO systems [2]. The above is directly reflected by the high costs of monitoring campaigns associated with modeling.
Generally, the modeling of combined sewers is carried out through specialized computational applications, which incorporate hydraulic analysis equations for CSO structures into their calculation engine. For example, the Storm Water Management Model (SWMM) flow dividers are drainage system nodes that divert inflows to a specific conduit in a prescribed manner. There are four types of flow dividers: cutoff divider, overflow divider, tabular divider and weir divider [3].
There are numerous studies where computational fluid dynamics (CFD) are used to analyze the hydraulic and water quality behavior of CSO. For example R Harwood &Saul reviewed some of the physical model studies which have been carried out in the United Kingdom to determine the performance of CSO chambers and introduced the CFD as a viable alternative to physical modeling [4].
Likewise, Vazquez et al. [5] defined the location of sensors and determined the overflow law used a 1D and 3D modeling.
The commercial software (CFD), supported in a numerical model called PHOENICS, has been used to assess filling rate, water levels at various locations, flow velocities in feed pipes, and overflows from the inflow channel, facilitating future work [6].
In the same way, He & Marsalek investigate capacity upgrading options for a CSO facility of inadequate capacity. In this case, they used a commercially available 3-D CFD model, called STAR-CD and verified against the collected data in two physical models [7].
The same shall determine the relation between water level and rate of spill flow by running a detailed 3D CFD model [8].
When analyzing the quality and hydraulic behavior in a CSO, research indicates that the capability of a particle tracking approach to determine the solid separation in CSO chambers [9].
To conclude, Isel et al. [10] describe a general method to assess discharge-water depth relationships for CSO chambers. This method is particularly suitable for: complex geometries and unavailable univoc relationship between upstream and downstream flow and complex downstream hydraulic conditions.
With regards to the research already presented, it is evident that the results of a one-dimensional model with respect to the results of a three-dimensional model have not been integrated to evaluate the hydraulic behavior of the CSO.
However, by using a computational tool that simulates the hydraulic behavior of a CSO in three dimensions, it is possible to use these results in the implementation of a one-dimensional model, which reduces the uncertainty associated with the idealization of flow methodologies in one dimension.
Consequently, this research proposes a methodology for the calibration of CSO, incorporating the results of the three-dimensional ANSYS CFX model in the SWMM one-dimensional model.
2. Methodology
Combined Sewer Systems (CSS) are made up of different types of hydraulic structures. Some of the hydraulic structures that are generally used in the construction and commissioning of CSSs are: pipe networks (collectors and interceptors), flow bypass structures and flow control and regulation structures [11].
In physical terms, the structures mentioned are governed by the following physical principles: (1) the principle of conservation of mass (continuity) and (2) the principle of conservation of momentum. These physical principles are expressed mathematically through partial differential equations. In the case of SWMM, the complete equations of Saint Venant are solved, while in ANSYS CFX the equations of Navier & Stokes are solved.
The hydraulic models used in the development of the research are presented below.
2.1 Theoretical basis of the models
2.1.1 Storm Water Management Model (SWMM)
It is a free-use software for the dynamic simulation of urban drainage systems, which is used to model the hydraulics of a sewer network in permanent or non-permanent flow.
The calculation engines incorporated in SWWM perform the hydraulic calculations of the model by solving the Saint-Venant equations under three levels of detail: uniform flow, kinematic and dynamic wave.
2.1.2 ANSYS CFX
The set of equations that describe the processes of momentum, mass and heat transfer are known as the Navier & Stokes equations. These partial differential equations developed at the beginning of the 19th century do not have a general analytical solution, but can be discretized and solved numerically.
CFD is essentially a computer-based method for the solution of the fundamental governing equations of fluid dynamics, the continuity (conservation of mass), momentum and energy equations [12].
ANSYS CFX includes a set of turbulence models for free surface flow simulation. The studies analyzed coincide with the use of the K-Épsilon model (k - ε) for the modeling of turbulence in CSO, this is because this model shows a good performance in predicting the secondary flow motion and the flow separation, without significant increase in computational costs when compared with other more robust turbulence models [11].
Since there is no field information for the calibration of the CSO, the following aspects were chosen, taking into account the values reported in the literature: the choice of the turbulence model, the definition of the boundary conditions, the choice of the mesh sizes, the step time and the free-surface flow model.
The boundary conditions upstream of the CSO correspond to the hydrogram generated in the inlet pipe related to the simulation of precipitation in the basin. The boundary conditions at the outlet pipe and in the overflow pipe are configured as free flow conditions, where the flow pressure corresponds to the atmospheric pressure. The limits of the structure (solid limits) are configured in the model as a "Wall" type boundary.
The choice of mesh size and the step time to be used in CSO modeling is defined by a sensitivity analysis. In this case, these parameters were modified until obtaining a combination that yields a value of the Courant number in an acceptable range, which allows to identify the threshold flow from which the CSO begins to work.
By taking into account Chen’s study [11], the free surface flow model can be defined “ The Volume of Fluid (VOF) model solves a single set of momentum equations for two or more fluids and tracks the volume fraction of each fluid throughout the domain to trace the free water surface. The VOF model is a successfully-tested alternative to trace large free surface variations in numerical simulations overcoming the limitations of the rigid-lid assumption. A transport relation for the volume fraction of each cell is solved to find the shape of the free surface as”
where and denote the volume fraction, the average flow velocity and the global Cartesian coordinates (), respectively. The volume fraction ranges from 0.0 for a cell with no water to 1.0 for a cell full of water.
2.2 Methodological development
There are different methodologies for the calibration of CSSs, one of which, considers the use of CSO as control structures for the measurement and calibration of these types of systems. [2].
The main steps for the development of the study are described below:
- 1. A CSS that has structures for the CSO of flows is chosen, which also has detailed information on the topology and topography of the network. The case study is carried out on two existing CSOs in the CSS, located on Carrera 8th and 9th in the Virrey basin sector, in Bogotá, Colombia.
- 2. Using historical information of rainfall records in the study area, the longest rains in the basin are chosen, so that, when carrying out the simulations in the sewer system, it is guaranteed that the CSO will begin their operation.
- 3. With the maximum downpouring simulations are carried out in SWMM in order to obtain the hydrogram of entry to the CSO.
- 4. Taking the hydrograms generated in SWMM as input information and carrying out a sensitivity analysis on the mesh size and step time, the stability of the model is established to obtain the results of the hydraulic simulation of each CSO in ANSYS CFX.
- 5. The curves that link the input flow to the CSO are constructed from the data obtained in ANSYS CFX,
- 6. The data generated in the previous literal is inserted in the SWMM under the kinematic wave model in order to perform the hydraulic simulation.
- 7. In the case of performing the simulation in SWMM under the dynamic wave model, the type of CSO (orifice or outlet pipe) is chosen for later configuration. In this case, the parameters of the type of CSO (height of the crest, opening, length and discharge coefficient of overflow weir) are modified until the curve that relates the overflow, with respect to the input flow adjusts to the curves obtained in literal e.
2.3 Model construction
The proposed study involves the use of two types of software. the steps to follow in the configuration of these models are summarized as follow:
2.3.1 Combined sewer modeling
The analysis of the hydraulic behavior of the combined sewage system is carried out in SWMM. The type of modeling that is carried out corresponds to an event simulation, where the response of the drainage system regarding a particular rain event is analyzed.
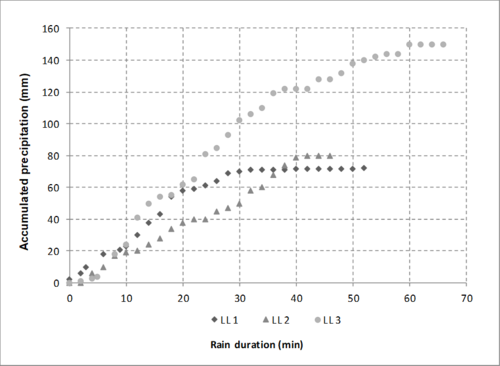
Figure 1 shows the cumulative distribution of simulated rainfall in the basin. Precipitation data associated with rain 1 corresponds to data taken in a field visit in the basin. In the case of rains 2 and 3, the data is obtained by scaling the values of rain 1, so that the operation of the CSOs is guaranteed.
|
| Figure 1. Cumulative distribution of simulated rainfall in SWMM |
Precipitation events that are associated with rainfall become the input hydrograms for subsequent CSS modeling.
The simulation of the CSS in SWMM is carried out through the dynamic wave and kinematic wave model. The above, given the restrictions presented by the software to model each type of CSO; the outlet orifice and outlet pipe type CSOs are simulated under the dynamic wave model, while the tabular type CSO only functions as a CSO in the kinematic wave model. The latter type of CSO allows to enter information relating the overflow based on the total inflow.
The reliability of the results is validated in relation to the percentage of error that the model throws in the hydraulic calculation (system continuity). The parameter to be evaluated is the calculation time (step time), which is modified in such a way that the percentage of calculation error is reduced to values below + 10% for kinematic wave conditions; and + 1% for dynamic wave conditions.
For simulations under dynamic wave conditions, the time interval to be selected is 1 second, with errors in the hydraulic calculation within the established range of + 1%. Simulations under kinematic wave are performed with a time interval of 0.5 seconds, obtaining an error in the hydraulic calculation of + 0.03% [3].
2.3.2 CSO modeling
The hydraulic behavior of the CSO in ANSYS CFX is performed for non-permanent flow conditions [12], following the steps presented by:
- 1. Preprocessing: in this step, the model geometry and the size of the mesh are configured, and the boundary conditions of the system (flow inlets and outlets, open border and the walls of the structure) are defined. In ANSYS CFX, the preprocessing is carried out in the “Geometry” and “Mesh” modules.
- 2. Solver: the information corresponding to the boundary conditions, the physical properties of the fluid and the operating conditions is entered. At the entrance to the CSO, the boundary condition is defined by the inflow. In the outlet areas (excess and waste water pipes); an outlet pressure equal to the atmospheric pressure is configured; an open type output is configured in the flow - atmosphere interaction zone; and the non-flow zones (CSO walls) are configured as a “Wall” type border, to which the value of the absolute roughness of the material is assigned. Finally, the properties of the fluid, the operating conditions and the turbulence model are configured. The selected turbulence model is K-Epsilon and the flow - atmosphere interaction is evaluated using the VOF model. The above information is entered in the “Setup” and “Solution” modules.
- 3. Post-processing: modeling results are observed in the “Results” module.
2.4 Case study
The Virrey Basin is located in Bogotá's North-East and it extends in a south-north direction, from the 72nd Street to the 92nd Street; and in the east-west direction, from the eastern hills to the North Highway. This basin has an approximate area of 1369 ha, of which 354 correspond to the hills and 1015 to the urban area. The sewage system is combined with 1096 sections of different types and materials, so the Manning coefficient associated with each of them is variable. In total, the system has 1084 manholes, with depths varying between 0.89 and 7 meters [13].
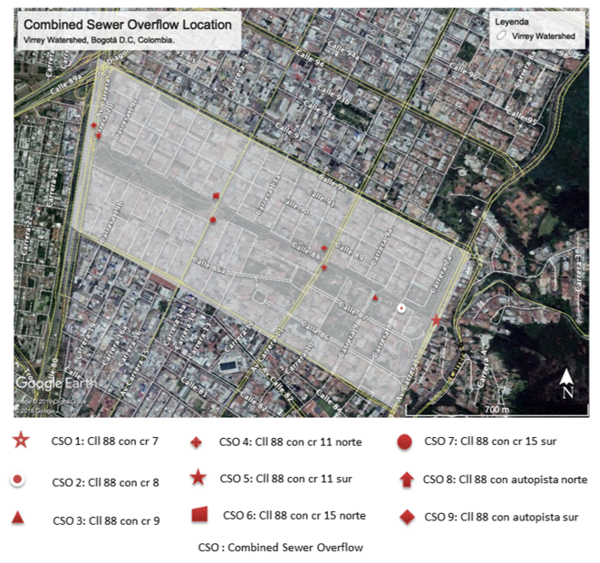
The sewer system has two interceptors in which 9 CSOs are located. On the right interceptor there are 5 CSOs on Carreras 7, 8, 11, 15 and the North Highway, while the left interceptor has 4 CSOs on Carreras 9, 11, 15 and the North Highway. The hydraulic simulation of the CSS is carried out for the subsector of El Virrey basin; also, the comparative analysis between the SWMM and ANSYS CFX models focuses on the CSO of Carrera 8 (right interceptor) and Carrera 9 (left interceptor), which are identified in Figure 2 .
The choice of the mentioned CSO is due to the fact that these are interconnected by a set of pipes that allow this subsector to be modeled as an independent system of the global basin.
|
| Figure 2. Location of CSO in the Virrey basin |
3. Results and discussion
The orifice type and outlet pipe type CSO in SWMM are simulated under the condition of permanent flow over the crest of the overflow weir, where a linear relationship is generated between the flow of the inlet pipe and the overflow in the CSO.
The analysis of the hydraulic behavior of the CSO in ANSYS CFX, shows that the hydraulic load on the crest of the overflow weir is variable in time and space, therefore, the relationship between the input flow and the overflow is not linear, mainly when the CSO begins its operation.
3.1 Hydraulic CSO behavior in SWMM
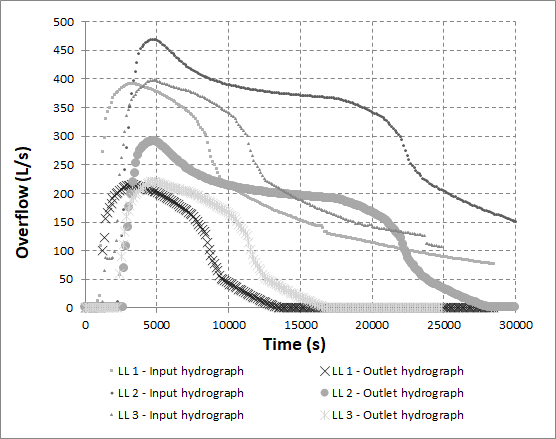
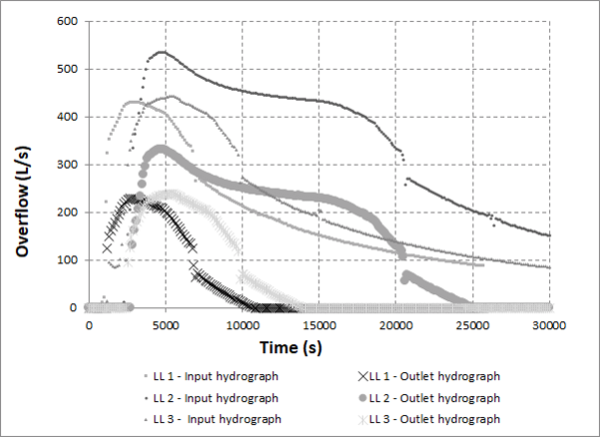
The excess hydrograms in the CSO pipe depend directly on the specific rain event to be modeled, on the geometry of the structure, on the type of CSO, and on the shape and distribution of the inlet hydrograms. From Figure 3 to Figure 6 it can be seen how the rainfall hydrogram conserves the trend and distribution of the input hydrogram in each particular structure.
|
| Figure 3. Behavior of the flow in the inlet and overflow pipe for the CSO of the exit orifice type - CSO Carrera 8th |
|
| Figure 4. Behavior of the flow in the inlet and overflow pipe for the CSO of the outlet pipe type – CSO Carrera 8th |
Although the simulation for the CSO of Carrera 8 includes the same trend for hydrograms input and output, the magnitude of these varies with the type of CSO (Figures 3 and 4), since the use of an orifice or an outlet pipe is equivalent to increasing or decreasing the level of crest of the CSO.
In the case of the CSO on Carrera 9, there is no significant variation in the inlet and outlet hydrograms for the orifice type and outlet pipe type CSO, as shown in Figures 5 and 6. In this case, the CSO geometry has a greater influence on the flow curve than the type of CSO that is configured.
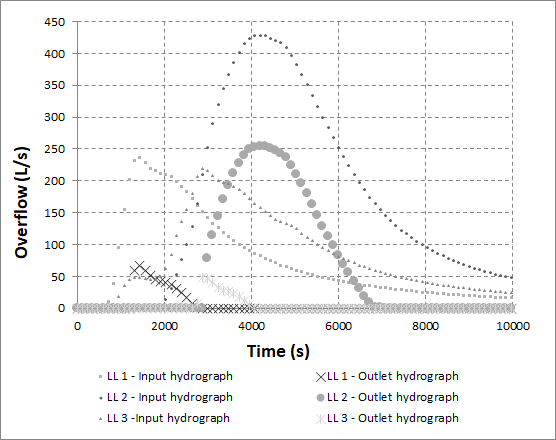
|
| Figure 5. Behavior of the flow in the inlet and overflow pipe for the exit orifice type CSO – Carrera 9th CSO |
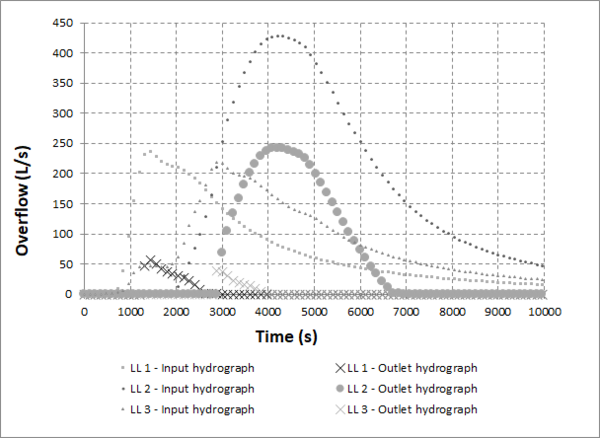
|
| Figure 6. Behavior of the flow in the inlet and overflow pipe for the outlet pipe type CSO – Carrera 9th CSO |
After the CSO starts operating, regardless of the type of CSO that is used, orifice or outlet pipe, the hydraulic head on the crest of the CSO is variable in time, but constant in space. In addition, the curve that relates the input flow to the CSO with the overflow remains constant regardless of the rain that enters the system, as shown in Figures 7 and 8.
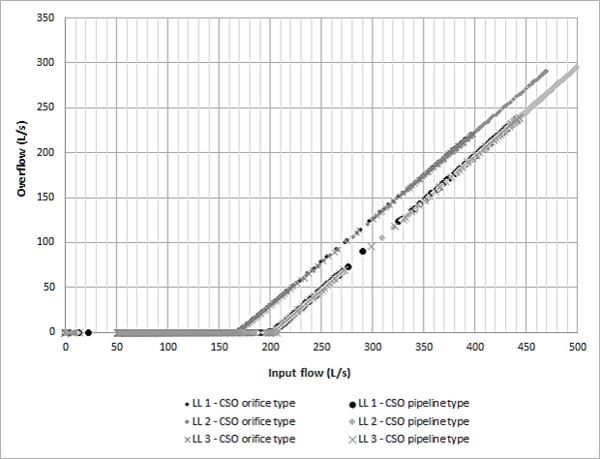
|
| Figure 7. Comparison of inlet flow vs overflow outlet orifice-type and outlet pipe-type CSOs - Carrera 8th |
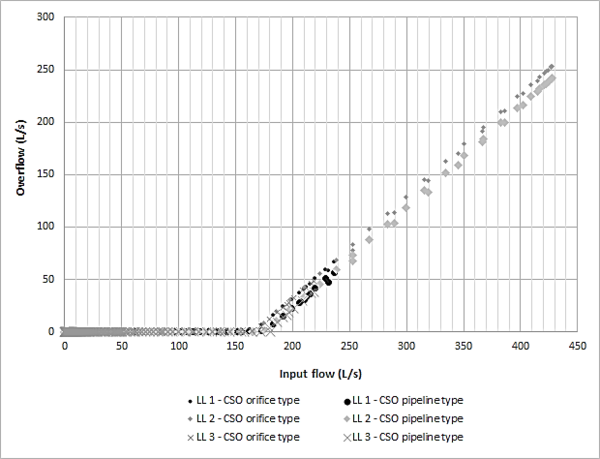
|
| Figure 8. Comparison of inlet flow vs overflow outlet orifice-type and outlet pipe-type CSOs - Carrera 9th |
In Figures 3 to Figure 5, the threshold flow in the inlet pipe is identified for the orifice-type and the outlet pipe-type CSO on Carrera 8. For the case of the orifice-type CSO, the threshold flow is set at 170 l/s, while the outlet pipe-type CSO is kept in the range of 205 l/s, with a difference of about 35 l/s.
In the case of the CSO on Carrera 9, the difference between the threshold flows is about 10 l/s, this being a lower value than the one presented on Carrera 8, but maintaining the outlet pipe-type CSO with the highest threshold flow before it starts to operate.
Therefore, following the order proposed in the methodology (from literal “e” to “g”), the results of the modeling in ANSYS CFX are presented below.
3.2 Hydraulic modeling of CSOs in ANSYS CFX
Based on the results obtained, the CSO located on Carrera 9 was selected for the construction of the 3D model, since the difference in the threshold flow of the two types of CSO is kept below 10 l/s, compared to 35 l/s for Carrera 8, which proves that the result of the ANSYS CFX model is not depending of the type of simulated CSO in the SWMM model.
In regard to the above information, the mesh size is analyzed in ANSYS CFX, based on the typical values reported in the academic literature for these types of structures (CSO), as highlighted in Table 1.
| Mesh size | Source |
|---|---|
| 31488 | [14] |
| 60000 | [5] |
| 61875 | [6] |
| 60000 - 100000 | [15] |
| 346000 | [16] |
| 320000 | [11] |
| 425000 | [10] |
| 390000 | [17] |
Table 2 shows the results of the modeling with the best reported performance (in terms of the Courant number and in the adjustment of the threshold flow) with respect to that reported in the SWMM model.
| Mesh size | Step time (s) | Number of Courant | The threshold flow is identify? | Total time sim. (h) | ||
|---|---|---|---|---|---|---|
| Mín | Máx | yes | No | |||
| 31249 | 1 | 0.74 | 626 | X | 4 | |
| 193744 | 2 | 0.55 | 36149 | X | 72 | |
| 193744 | 30 | 0.20 | 54482 | X | 3 | |
| 193744 | 120 | 7.55 | 1.7 E7 | X | 2 | |
| 193744 | 360 | 14.75 | 2.1 E11 | X | 1 | |
Although a significant variation in the number of Courant is obtained (between 0.20 and 2.1E11), a mesh size of 193744 and a step time of 30 seconds are chosen, the flow rate is identified with magnitude close to the threshold that is obtained for the simulation results in the SWMM model.
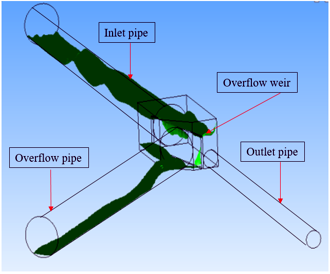
Once the simulation parameters have been obtained, the analysis of the hydraulic behavior in the structure is carried out; the water that passes over the crest of the CSO does not reach to wet all its length, therefore, the CSO works partially, as shown in Figure 9.
Figure 9 CSO crest partially in functioning.
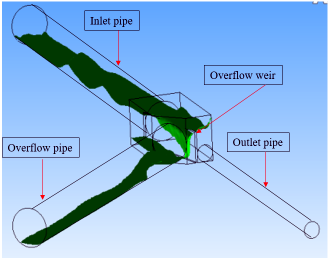
Similarly, Figure 10 shows the structure functioning when the flow is poured along the entire crest of the CSO. In this case, the hydraulic head on the CSO crest increases gradually and not suddenly, as in the SWMM model.
Figure 10 CSO crest in functioning.
3.3 Comparison of the hydraulic behavior of the CSO in SWMM and ANSYS CFX.
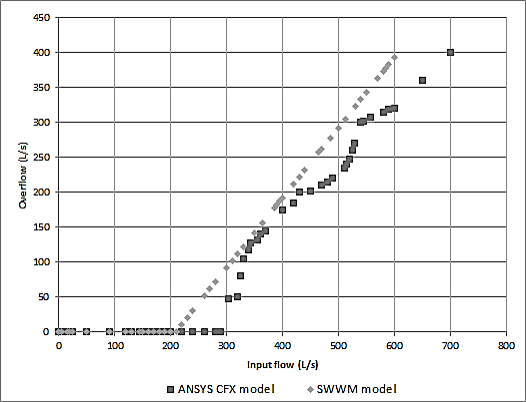
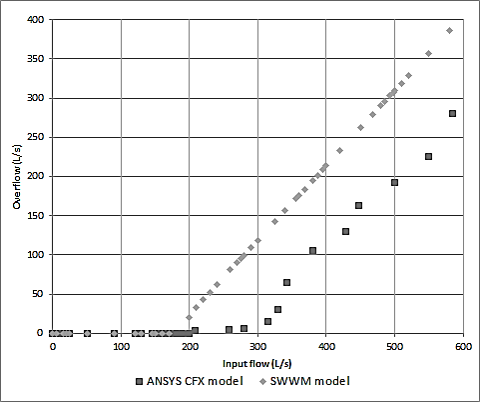
From the results obtained in the aforementioned models, the curves that relate the inlet flow to the overflow for the outlet pipe-type CSO in the CSO studied are constructed.
Figure 11 Comparison of flow input vs overflow outlet curves of ANSYS-SWMM models for the Carrera 8th CSO.
In Figure 11, the comparison of the results between the models used is shown. In SWMM the relationship between the input flow and the overflow is linear from the threshold flow, while in ANSYS CFX there are two changes in the slope of the function. The first is reflected at the beginning of the CSO operation, where due to a minimal variation in the inflow, there is a significant variation in the overflow (greater slope). The second change occurs when the flow begins to pour completely along the crest of the CSO (lower slope), showing a behavior similar to the results of the SWMM model.
Figure 12 Comparison of flow input vs overflow outlet curves of ANSYS-SWMM models for the Carrera 9th CSO.
Although the trends between the models have similarities in both CSOs, the SWMM model underestimates the threshold flow, estimating a difference of about 100 l/s, with respect to the ANSYS CFX results.
In the case of the CSO on Carrera 9, the relation between the flow inlet and the overflow pipe is defined by a nonlinear function at the beginning of its operation, as shown in Figure 3-10. Unlike the sudden growth of the function when the CSO on the Carrera 8 comes into operation. The CSO on Carrera 9 presents a gradual growth, which supports the hydraulic interdependence to the following considerations:
- 1. The SWMM model does not contemplate the temporary volume stored in the chamber upstream of the CSO, before it becomes operational.
- 2. The initial non-permanent flow condition on the crest of the overflow weir, once the CSO begins to function, is not represented in the calibration curves in SWMM.
- 3. The local hydraulic phenomena that occurs in the CSO (backwaters, hydraulic jumps, backflows, among others) are not simulated for the CSO in SWMM.
3.4 Methodological proposal for the calibration of combined sewers.
Taking into consideration the results obtained, a methodology for the calibration of combined sewer networks has been proposed below. This uses the results of a computational-fluid dynamics model and a one-dimensional model to simulate the behavior in the CSS. The steps which should be followed in the calibration process are:
- 1. To make measurements in the field of flow and water level in the CSO that are part of the CSS, both in the inlet pipe and in the outlet pipes, at least for a specific flow.
- 2. To use a computational dynamics model of fluids so that, with the data measured in the field, the calibration of the CSO is performed (define mesh sizes, time of step and the constants of the turbulence models).
- 3. To choose an input hydrogram for each CSO and build the calibration curves that relate the input flow to the outlet overflow.
- 4. To configure the calibration curves of each CSO in the one-dimensional model that evaluates the behavior of the CSS.
- 5. To perform new simulations in the one-dimensional model until obtaining calibration curves of flow input vs outlet overflow, which approximate the curves obtained in the 3D numerical model, for each of the CSO.
4. Conclusions
The SWMM modeling of lateral-type overflow weirs, under the kinematic wave model, using tabular type CSO, faithfully reflects the curves that relate the input flow to the overflow, which are obtained with the CFD software.
When simulating the CSO in SWMM under the dynamic wave model, the limitations of the software are related to the impossibility of this to simulate the space and time variation on the crest of the overflow weir, mainly in the first moments when the CSO starts to operate. However, when the crest of the overflow weir is relieving flow along its length, the curve that relates the input flow to the structure with the overflow tends to be linear.
As a result of the study carried out, a methodological proposal has been presented for the calibration of combined sewers, which must be validated, but which emerges as an alternative for the calibration of these systems in cases where field information is limited.
References
[1] U.S. Environmental Protection Agency. Combined Sewer Overflows Guidance For Monitoring And Modeling. Washington, 1999.
[2] CDRPC, C. D. R. P. C. Combined Sewer System Modeling Work Plan. New York, 2007.
[3] Rossman, L. A. Storm water management model user’s manual, version 5.0. National Risk Management Research Laboratory, 2010.
[4] Harwood, R., & Saul, A. J. Modelling the Performance of Combined‐Sewer Overflow Chambers. Water and Environment Journal, 15(4), 300–304, 2001.
[5] Vazquez, J., Kouyi, G. L., & Zug, M. Modelling and instrumentation of the storm overflows of the combined sewer system of Sélestat. Urban Water Journal, 3(2), 91–110, 2006.
[6] He, C., Marsalek, J., Rochfort, Q., & Krishnappan, B. G. Case study: refinement of hydraulic operation of a complex CSO storage/treatment facility by numerical and physical modeling. Journal of Hydraulic Engineering, 132(2), 131–139, 2006.
[7] He, C., & Marsalek, J. Hydraulic optimization of a combined sewer overflow (CSO) storage facility using numerical and physical modeling. Canadian Journal of Civil Engineering, 36(2), 363–373, 2009.
[8] Fach, S., Sitzenfrei, R., & Rauch, W. Determining the spill flow discharge of combined sewer overflows using rating curves based on computational fluid dynamics instead of the standard weir equation. Water Science and Technology, 60(12), 3035–3043, 2009.
[9] Dufresne, M., Vazquez, J., Terfous, A., Ghenaim, A., & Poulet, J.-B. CFD modeling of solid separation in three combined sewer overflow chambers. Journal of Environmental Engineering, 135(9), 776–787, 2009.
[10] Isel, S., Dufresne, M., Bardiaux, J. B., Fischer, M., & Vazquez, J. Computational fluid dynamics based assessment of discharge-water depth relationships for combined sewer overflows. Urban Water Journal, 11(8), 631–640, 2014.
[11] Chen, Z., Han, S., Zhou, F.-Y., & Wang, K. A CFD modeling approach for municipal sewer system design optimization to minimize emissions into receiving water body. Water Resources Management, 27(7), 2053–2069, 2013.
[12] Harwood, R. CSO modeling strategies using computational fluid dynamics. In Global Solutions for Urban Drainage (pp. 1–9), 2002.
[13] GRUCON. Estudio de la Rehabilitación del Alcantarillado de la Ciudad de Bogotá, 1999.
[14] Stovin, V. R., & Saul, A. J. Computational fluid dynamics and the design of sewage storage chambers. Water and Environment Journal, 14(2), 103–110, 2000.
[15] Dufresne, M., Vazquez, J., Terfous, A., Ghenaim, A., & Poulet, J.-B. Experimental investigation and CFD modelling of flow, sedimentation, and solids separation in a combined sewer detention tank. Computers & Fluids, 38(5), 1042–1049, 2009.
[16] Cataño-Lopera, Y. A., Bedoya, D., & Anderson, N. Using Computational Fluid Dynamics Modeling to Improve Flow Partition in a Combined Sewer Diversion Structure under Supercritical Flow. Proceedings of the Water Environment Federation, 2017(2), 642–654, 2017.
[17] Kouyi, G. L., Bret, P., Didier, J.-M., Chocat, B., & Billat, C. The use of CFD modelling to optimise measurement of overflow rates in a downstream-controlled dual-overflow structure. Water Science and Technology, 64(2), 521–527, 2011.
Document information
Published on 19/01/21
Accepted on 27/01/21
Submitted on 15/11/19
Volume 37, Issue 1, 2021
DOI: 10.23967/j.rimni.2021.01.006
Licence: CC BY-NC-SA license
Share this document
Keywords
claim authorship
Are you one of the authors of this document?
