Abstract
The seismic response of tensile membrane structures (TMS) is investigated. To the authors knowledge, this is the first study on TMSs subjected to a seismic record reported in the literature. A type of membrane structures usually considered as a reference in other works are employed in the present study. The selected hyperbolic-paraboloid fabric structures, also referred as hypar TMSs, are subjected to an earthquake accelerogram from a relatively large earthquake recorded at Norcia, Italy. To obtain the TMSs seismic response, a finite element formulation reported in a previous study, and which accounts for wrinkling phenomena, orthotropic material modeling, and geometrical nonlinearity, is employed. The analyses are performed in two stages; first for the prestressed case and then the seismic loading is added. It is found that the seismic response of TMSs should not be disregarded by designers beforehand, since important increments in the dynamic response of the displacements produce an incremet of around 9% for stresses. However, a very important increment of around 80% for support reaction forces is computed, when compared with the static case. It is also found that the orientation of the frame-supporting structure has a significant impact on the computed seismic reactions.
Keywords: Tensile membrane structures, seismic excitations, dynamic analysis, finite element method
1. Introduction
The structural analysis and design of tensile membrane structures (TMS) is a subject that has become important in recent years and some methodologies and recommendations have arisen to cope with the complex behavior of these light weight structures with impressive designs. Noticeably, the TMS analysis and design concerns are focused on certain types of loads which are considered critical for fabric structures. Recent studies focus primarily in demands on TMS due to wind and snow loads to analyze the structures, to compute their reliability and to review other aspects [1-8].
The seismic response of TMSs is virtually absent in the literature, and recommended guidelines [9] and formal code regulations are still under development in many countries [10]. Even though the wind and snow loads seem to capture the attention of more designers and studies on TMSs, it will be seen in the present work that consideration of the earthquake forces may be relevant for some specific issues regarding the seismic response of TMSs and their supporting structures.
Recent literature dealing with the analysis of TMSs is based on the finite element method (FEM), however detailed information on the employed programs is not always reported or commercial software is used [1,5,11]. This is important, since there is a wide variability of results when using FEM to analyze TMSs [5]. In the present study an on-purpose own developed code which accounts for wrinkling phenomena, orthotropic material modeling, and geometrical non-linearity is used, which formulation and discretization is established in detail in [12] and references within. [13,14] used a similar formulation.
Although there are TMSs with different shapes reported in the literature, the hyperbolic paraboloid, nicknamed as hypar, has become some sort of benchmark for TMS studies and is used by several authors in recent works [1,4,6,7,8]. Hypar TMSs with different supporting sub structures are considered in the present study. Considering the preceding paragraphs, the main objective of this study is to assess the seismic response of hypar TMSs and their frame-supporting structure subjected to earthquake loads using our referred FEM code.
2. Finite element formulation
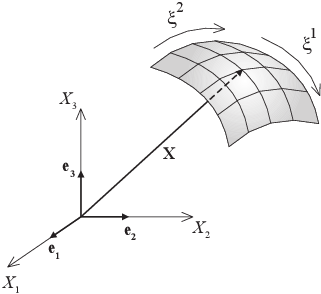
The finite element analysis formulation to be used for the dynamic analyses of membrane structures is based on a previous study [12], which is used for the structures under analysis in this study. The curvilinear coordinate system used to formulate the membrane finite element is shown in Figure 1.
|
| Figure 1. Membrane coordinate system |
From [12], the internal forces given in curvilinear coordinates for membrane structures are
|
|
(1) |
where is the global degree of freedom (dof), is the local element node, is the reference configuration domain, and the Greek indices , on the membrane mid-surface take on values of 1 and 2 in a plane stress state in the Euclidean space. Besides, is the Piola-Kirchhoff stress tensor, and the fourth-order strain-displacement tensor in curvilinear coordinates is given by
|
|
(2) |
with
|
|
(3) |
where denotes the shape function of node of the finite element. Using voigt notation to transform internal forces from tensorial to matrix notation, equation (1) yields,
|
|
(4) |
where the strain matrix is given by
|
|
(5) |
Following the details given in [12], the internal forces can be computed as indicated ahead to take into account the orthotropic material behavior.
It is important to mention that fabric manufacturers usually do not provide in their catalogs the thickness of their membrane products, and they report only the tensile stiffness. This last parameter is enough to perform a static or quasi-static analysis. If the tensile stiffness is given and the formulation given in [12] is going to be used, some changes must be carried out. Because both alternatives could be of interest for researchers, and because the formulation given by [12] is versatile enough to implement any of the alternatives, a brief description is given in the following when no thickness is directly available.
First, it is noted that in [12] the internal forces are obtained by means of
|
|
(6) |
where is the element surface in reference configuration, is the membrane thickness, is the nonlinear strain-displacement matrix, is the transformation matrix from a curvilinear system to a rectangular one, is the rotation matrix from fiber axes to local axes, and is the Piola-Kirchhoff stress vector (force per unit area). In equation (6), the stresses are computed as
|
|
(7) |
where is the Green-Lagrange strain vector, and the constitutive equation is expressed as
|
|
(8) |
In equation (8), is the Young modulus and is the Poisson coefficient. Since material properties given in most manufacturers' catalogs neither give a value for the thickness nor for the Young modulus , then the internal forces for membrane analysis must be evaluated using
|
|
(9) |
where is the Piola-Kirchhoff stress vector (force per unit length), and
|
|
(10) |
with
|
|
(11) |
where is the tensile stiffness of the material, given in units of force per unit length (as usual in manufacturers of membrane materials). It is remarked that the tensile stiffness of the material is numerically equivalent to the Young modulus times the thickness, , therefore the thickness is no longer required as stated in the original formulation as given in [12].
For the case when an orthotropic material is modelled, two directions of the tensile stiffness must be given, which are for the warp direction and for the fill direction. Consequently, in the orthotropic plane stress constitutive equation, must be replaced by , and must be replaced by . If desired, these changes would allow us to solve other problems, for instance the numeric examples given in [5].
Unfortunately, the previous simplification is only valid for static or quasi-static analyses. For a dynamic seismic analysis to explicitly determine the thickness, , is necessary. Consequently, the original formulation in [12] is used, so that the right structure mass is accounted for and a consistent analysis assessing the internal forces given by equation (6) can be performed, which allows to complete the formulation with
|
|
(12) |
here, the external forces are given by the Newton's law, by considering the seismic record as the acceleration for the studied site which is defined later. It is noteworthy that the formulation in [12] is of a wide applicability, and since it was originally developed to cope with dynamic analyses, it can be used to analyze the TMS under seismic excitations given below.
The algorithm used to solve equation (12) from a known solution time at step (e.g., displacement , velocity and acceleration ), take into account the generalised time integration scheme leading to
|
|
(13) |
where
|
|
(14) |
Low-frequency dissipation is optimal with
|
|
(15) |
and when
|
|
(16) |
the method is second-order accurate and posses high frequency dissipation.
3. Examples
3.1 Structure 1
In this study a tensile-structure supported on a sub-structure is investigated. The geometry of the tensile-structure, as well as the surrounding cable along the perimeter, are shown in figure 2.

|
| Figure 2. Membrane geometry and surrounding cable |
In table 1 the values of the geometry of the tensile-structure and the surrounding cable are listed.
| Node | x-Coord | y-Coord | z-Coord |
From the coordinates listed in Table 1, it can be observed that the highest points for the membrane correspond to nodes 3 and 7, while the highest points for the cables correspond to nodes 10 and 12. The direction along the highest points is coincident with the principal direction of the fiber reinforcement of the membrane, i.e. the warp direction, also indicated in Figure 2.
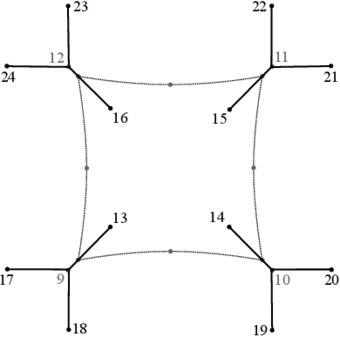
In Figure 3 the nodes of the supporting sub-structure are shown.
|
| Figure 3. Nodes and plan view of the supporting sub-structure |
Coordinates for the geometry of the supporting sub-structure shown in Figure 3 are listed in Table 2.
| Node | x-Coord | y-Coord | z-Coord |
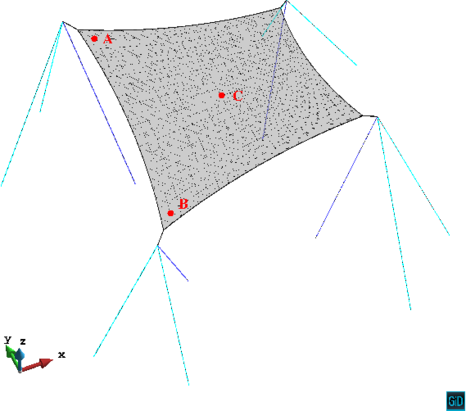
The resulting mesh by using the previous listed membrane and support coordinates are depicted in Figure 4 and, as it can be observed in the figure, consists of linear triangles with a mesh for the membrane. The cables and posts are defined by a two-noded unidimensional element. Both mentioned types of elements are Total Lagrangian non-linear geometric elements. Also, in Figure 4 the control points and used for obtaining the displacements and stresses to be discussed later are shown.
|
| Figure 4. Mesh and reference points for the studied structure |
The material properties of the membrane, after [5], are listed in Table 3, where a thickness for the membrane has been added.
| Tensile stiffness warp direction, | 600.0 |
| Tensile stiffness fill direction, | 600.0 |
| Shear stiffness, | 30.0 |
| Poisson, | 0.1 |
| Thickness, | 1.0 |
| Density, | 1800.0 |
The cable, tensors and posts material properties can be found in Table 4. Note that we denote post as a compression member in the supporting sub-structure (purple elements in Figure 4), and tensor as a tension member of the supporting sub-structure (cyan elements in Figure 4).
| Young modulus | Cross section | Density | |
| Cable | 210 | 7800 | |
| Tensor | 210 | 7800 | |
| Post | 210 | 8500 |
The structure is subjected to two load stages, and the wrinkling model described in [12] is used in both phases. The first stage corresponds to prestress, which is applied as per the values indicated in table 5.
| Membrane prestress: warp=fill | 3.0 |
| Cable prestress | 2.36 |
| Tensor prestress | 1.18 |
The prestress stage is explained in what follows:
- Prestress.- A quasi-static analysis is carried out by applying the prestress linearly with a step time increment .
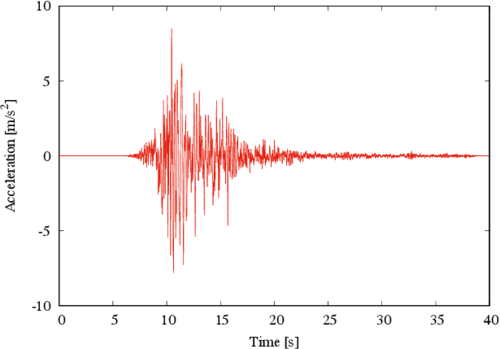
The second load stage corresponds to the seismic loads, which are applied by using as input the accelerations of the 6.6 magnitude (Richter scale) earthquake recorded at Northern Norcia, Italy, on October 30, 2016 and shown in Figure 5,[15].
|
| Figure 5. Accelerogram form the Norcia, Italy earthquake |
The seismic loading is added to the resulting prestressing state in the second stage as follows:
- Seismic load.- A seismic undamped dynamic analysis with a time step increment is performed up to a total of 8000 time steps equivalent to a duration of of the earthquake record. In particular, the global X direction was analyzed by considering that the 100% of the earthquake acted along this direction
It is pointed out that for the case of a geometric non-linear dynamic analysis, Newmark's dynamic method does not provide a right solution; therefore, methods like the HHT [16], WBZ [17] or Generalized- [18] are required.
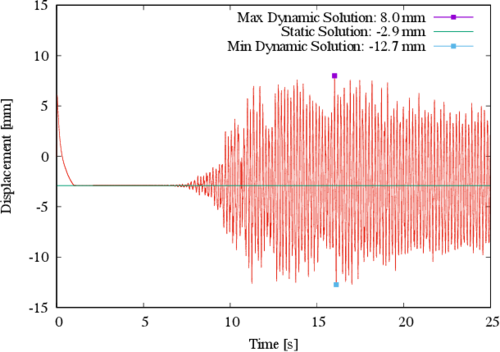
The results from the dynamic analysis highlight important issues to be considered for these kinds of structures. To elaborate on this, first consider the largest displacement component at control point A depicted in Figure 6. At this point the displacement due to prestress leads to a descend of the structure to a maximum of 2.9 mm, and from there the maximum absolute displacement during the earthquake further increases to a maximum of 10.9 mm. This is equivalent to a 375% increase, if the prestress displacement is used as reference. Even though such increase is significant in percentage, is not critical from a serviceability point of view for the structure, since the lowest point in the membrane is located at a 4 m height.
|
| Figure 6. Displacement in the Z direction for control point A |
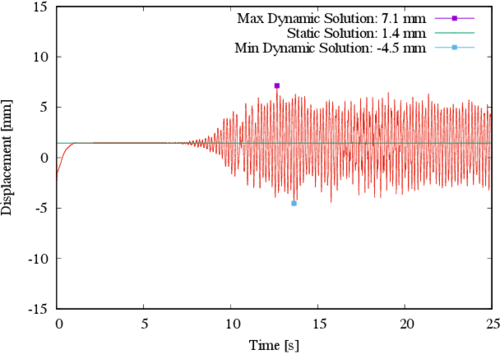
To further elaborate on the discussion, the largest displacement component for control point B is shown in Figure 7, where it can be observed that the structure raises to a maximum of 1.4 mm due to the prestress, and from there it further reaches a maximum absolute displacement of 5.9 mm during the earthquake. This is equivalent to a 421% increase, is the prestress displacement is used as reference.
|
| Figure 7. Displacement in the Z direction for control point B |
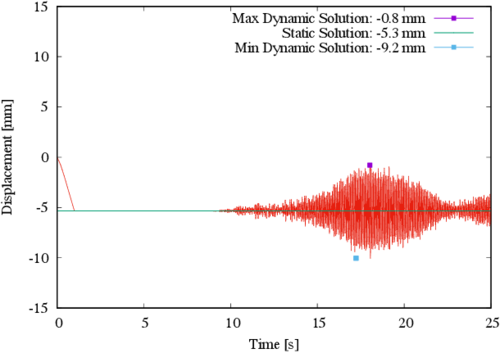
It is noted that by employing the same scale as in the previous two figures, the largest displacement component for control point C is in the X direction; however, for a consistent comparison (i.e. in the same direction as in the previous two figures) the displacement in the Z direction for control point C is shown in Figure 8. At this point the displacement due to prestress leads to a descend of the structure to a maximum of 5.3 mm; during the earthquake the absolute maximum displacement is 4.5 mm.
|
| Figure 8. Displacement in the Z direction for control point C |
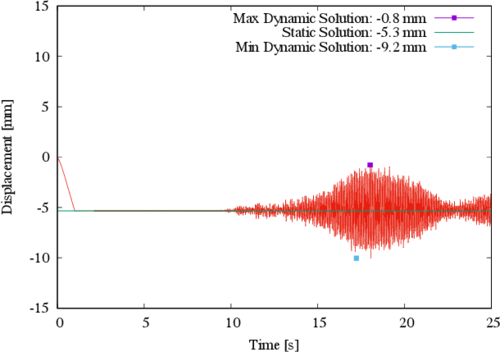
The displacement in the X direction for control point C is observed in Figure 9; it is shown that the displacement due to prestress is practically zero (exactly 7.3x10⁻⁵ mm), and it reaches an absolute maximum of 5.5 mm during the earthquake.
|
| Figure 9. Displacement in the X direction for control point C |
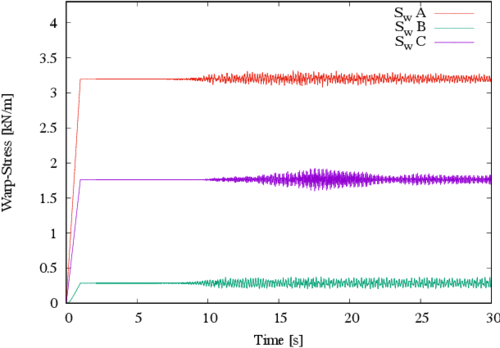
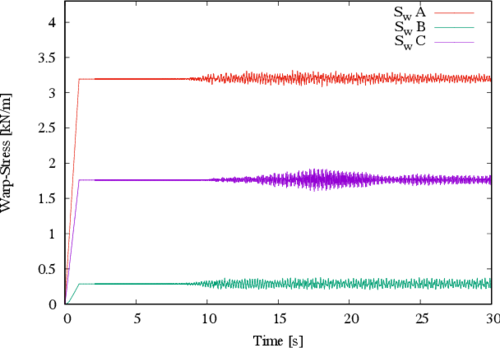
From the previously described results it could be natural to expect similar increments in the membrane stresses. However, the stress increments in the membrane are not as significant; this is evidenced in Figures 10 and 11. For the warp stress, the maximum increment due to the dynamic loads is located at point C and is equal to a static value of 1.76 kN/m, while the maximum dynamic value is equal to 1.92 kN/m. This means that the stress increase is in the order of 9.0%, considering the static value as reference. For the fill stress similar trends are found, being the maximum increase of the order of 8.5% located at point C (with static and dynamic values of 1.64 kN/m and 1.78 kN/m, respectively). In Figures 10 and 11 the stresses at the other control points (A and B) are also indicated; similar trends can be observed but they are not included since their increments are lower than those of point C.
|
| Figure 10. Stresses in the warp direction |
|
| Figure 11. Stresses in the fill direction |
With the results discussed so far, one may think that the quantitative values of stresses and displacements due to earthquake loads are not that relevant for design purposes when membrane structures are considered (as opposed to the usually more critical values resulting from wind loading). However, a different story could be found if the design is focused on the foundation supports (anchorage) as will be discussed shortly after, and consequently care should be exercised by the designer in such a case.
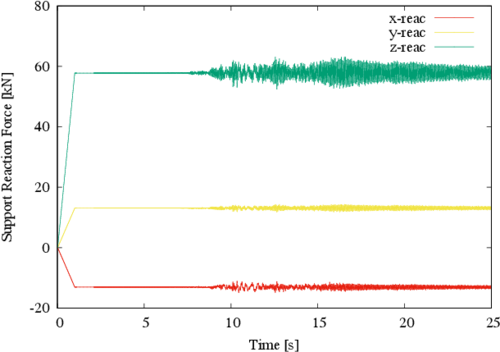
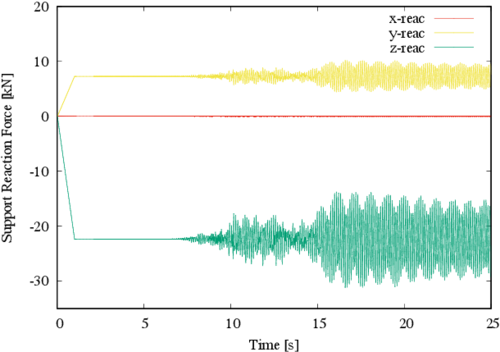
In Figures 12, 13 and 14 the most critical behavior at the structure foundation supports, corresponding respectively to nodes 16, 23 and 24 in Figure 3, is shown. In Figure 12, the static reaction in the Z direction is 57.8 kN, and the corresponding dynamic value is 63.1 kN; it means an increment of 9.1% in the compression force on the support.
|
| Figure 12. Reactions at major post |
|
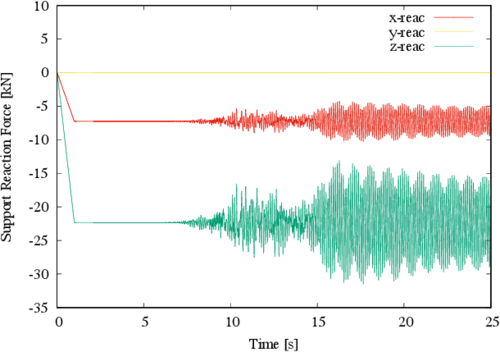
| Figure 13. Reactions at major tensor 1 |
|
| Figure 14. Reactions at major tensor 2 |
In Figure 13 the maximum response in the Z direction is exhibit, which is a tension force and is given by a negative value in the reaction; the static value of such response is -22.3 kN, while maximum absolute dynamic response is -31.5 kN, meaning that an increase of tension of 41% is found. Likewise, Figure 14 shows that the maximum response is, one more time, a tensile force in the Z direction; this time the static value of such response is -22.3 kN, while maximum absolute dynamic response is -31.2 kN (i.e., a 40% increment).
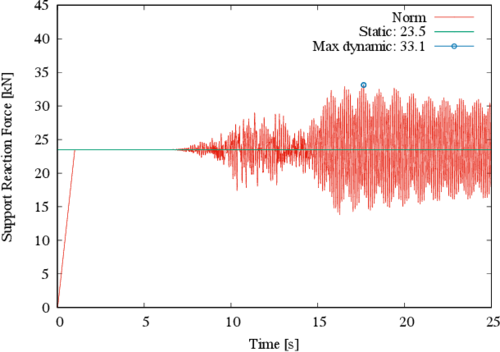
Figure 15 shows the norm of the major reactions on the structure, which corresponds to node 23 in Figure 3. It can be observed that the static response value is 23.5 kN, while the maximum dynamic response is 33.1 kN; a 40.9% increment. This increase is significant, since the usual design load factors do not cover such a large increment in terms of force.
|
| Figure 15. Norm of reactions at major tensor 1 |
3.2 Structure 2
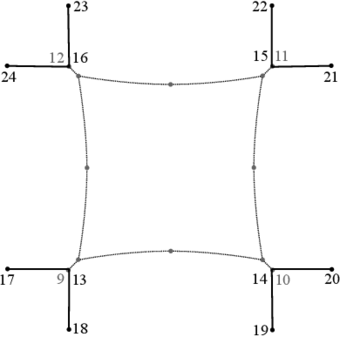
The increment in the reaction at the foundation supports during an earthquake may be generated by the horizontal component of the compression post due to the transmission of seismic horizontal forces to the structure. To investigate further this issue, the structure response is obtained by considering that the posts are not inclined, but oriented in the vertical direction. The new geometry with the changed nodes is shown in Figure 16, and they are the nodes 13, 14, 15 and 16.
|
| Figure 16. Updated geometry of the membrane and surrounding cable |
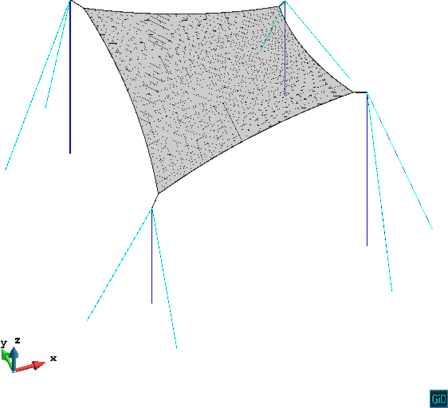
For a better visual appreciation, the new structure can be observed in 3D in Figure 17, where it can be readily observed that the posts are now vertical.
|
| Figure 17. Updated geometry of the membrane and surrounding cable |
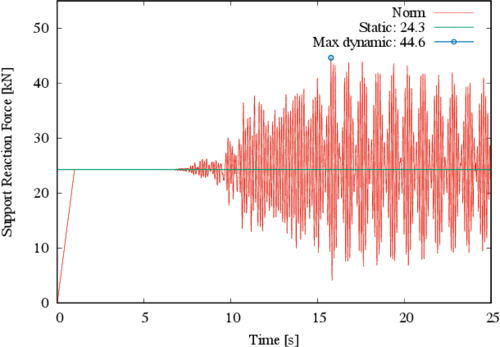
In Figure 18 the norm of the major reactions is shown for the new structure. It corresponds to node 23 in Figure 16 and it can be observed that the static response has a value of 24.3 kN, while maximum absolute dynamic response is 44.6 kN, which represents a surprising 83.5% increment with respect to the static response. This value is enormous, and it is considered that no common factor in codified design accounts for such a large increment.
|
| Figure 18. Norm of reactions at major tensor 1 for new geometry |
It can be concluded that the increase in the reactions of the membrane foundation supports is very significant, this should be considered when designing the supports and posts orientations in seismic prone regions.
From the previous description of displacements and stresses and the discussion along, it can be concluded that although the seismic response of TMSs seems not to be considered important in the literature, care should be exercised in seismic regions when designing these kind of structures, because the displacements and support reactions increments can be relevant, and this highlights the necessity to verify that critical cases due to earthquake load are not reached. It is also concluded that the orientation of the elements on the supporting structure (e.g., the posts) can have an impact on the obtained forces at the foundation. Further research to investigate other geometries (in the TMS as well as in the supporting structure) and other seismic loads, as well as a comparison with other types of loading (e.g., wind loading) is strongly recommended.
4. Conclusions
Although the structural analysis and design of tensile membrane structures (TMS) is a subject that has become relevant lately, it was found that recent studies are mainly focus on demands imposed to TMSs by wind and snow loads, and that the seismic response of TMSs is virtually absent in the literature. To the authors best knowledge, this is the first study dealing with seismic demands on TMSs using the described finite element formulation. The findings can be important, especially if it is considered that formal code regulations are still under development, and that the conclusions given in this section could be useful to code developers and practitioners, among others.
More specifically, the seismic response of hypar TMSs under seismic excitations is computed. A FEM which accounts for wrinkling phenomena, orthotropic material modeling, and geometrical non-linearity is employed for the dynamic analysis. Displacements, stresses and reactions are described for selected nodes. A record of a relatively large earthquake recorded at Northern Norcia, Italy, was used for the analyses. It is pointed out once more that the seismic response of TMSs is virtually absent in the specialized literature and that codes and standards are still under developments for these structures; therefore, it was decided to use methods and formulations known in the structural engineering field to perform the dynamic analysis with the described FEM and accelerogram.
It was found that important increments are obtained in terms of displacements when the dynamic loads are considered, compared to the prestressed static loads. Although stress increments are not as large, the supports reactions exhibit a significant increment of the order of 40% (always compared versus the static case). Moreover, if the geometry of the supporting structure orientations is varied (e.g., inclined posts versus vertical posts) the increase at the reactions can be even higher ( over 80% ). This means that special attention should be exercised when the supports are to be designed, since they are critical parts of the structures and if they do not withstand the seismic demands or do not perform adequately under seismic excitations, the whole structure could fail or not being serviceable anymore.
It is highlighted that the seismic response of TMSs should be checked in seismic regions, because the displacements and support reactions increments can be significant, and possible critical cases due to earthquake load should be inspected. The readers could think of a case when the wind and snow loadings are not that critical for a TMSs and the seismic loading could be significant. For instance, consider a hypothetical or real case of a TMS in a seismic-prone region, while at the same time located inside another larger structure preventing wind or snow loading (or simply an open location where snow in not present and wind velocities are not significant); previsions for such possibilities should be incorporated in codes and guidelines for TMSs, and the conclusions referred here can be an aid for such a purpose.
Finally, it is also pointed out that the orientation of the elements on the supporting structure (e.g., the posts) can have an important impact on the obtained forces at the foundation, as discussed in this study. Therefore, further studies considering other geometries in the TMS and in the supporting structure, other seismic loads and comparisons with other types of loading are strongly recommended to advance the knowledge of the response of TMSs under seismic excitations.
Acknowledgements
We are grateful to Universidad de Guanajuato for its support and to the International Centre for Numerical Methods in Engineering (CIMNE) for providing us with the pre and post processor GiD [19] in our CIMNE-Classroom at the Civil Engineering Department.
References
[1] Zhang Y., Lu Y., Zhou Y., Zhang Q. Resistance uncertainty and structural reliability of hypar tensioned membrane structures with PVC coated polyesters. Thin-Walled Structures, 124:392-401, 2018.
[2] Dutta S., Ghosh S. Inamdar M.M. Reliability-based design optimization of free-supported tensile membrane structures. ASCE-ASME J. Risk Uncertainty Eng. Syst., 3(2):G401600-1-G401600-11, 2017.
[3] Dutta S., Ghosh S. Inamdar M.M. Optimisation of tensile membrane structures under uncertain wind loads using pce and kriging based metamodels. Struct. Multidisc. Optim., 57:1149-1161, 2018.
[4] Colliers J., Mollaert M., Vierendeels J., De Laet L. Collating wind data for doubly-curved shapes of tensioned surface structures (Round Robin Exercise 3). International symposium on novel structural skins - improving sustainability and efficiency through new structural textile materials and designs, 155:152-162, 2016.
[5] Gosling P.D., Bridgens B.N., Albrecht A., Alpermann H., Angeleri A., Barnes M., Bartle N., Canobbio R., Dieringer F., Gellin S., Lewis W.J., Mageau N., Mahadevan R., Marion J.-M., Marsden P., Milligan E., Phang Y.P., Sahlin K., Stimpfle B., Suire O., Uhlemann J. Analysis and design of membrane structures: Results of a round robin exercise. Engineering Structures, 48:313-328, 2013.
[6] Gosling P.D., Bridgens B.N., Zhang L. Adoption of a reliability approach for membrane structure analysis. Structural Safety, 40:39-50, 2013.
[7] Bridgens B.N., Birchall M. Form and function: The significance of material properties in the design of tensile fabric structures. Engineering Structures, 44:1-12, 2012.
[8] Takeda F., Yoshino T., Uematsu Y. Discussion of design wind force coefficients for hyperbolic paraboloid free roofs. The Seventh International Colloquium on Bluff Body Aerodynamics and Applications, BBAA7:2-6, 2012.
[9] Foster B., Mollaert M. European design guide for tensile surface structures. TensiNet, 2004.
[10] Stranghöner N., Uhlemann J., Mollaert M. Background to the science and policy report for tensile membrane structures. International Symposium on Novel Structural Skins - Improving Sustainability and Efficiency through New Structural Textile Materials and Designs, 155:256-264, 2016.
[11] Dinh T.D., Rezaei A., Puystiens S., Van Craenenbroeck M., Carbonez K., De Laet L., Mollaert M., Van Hemelrijck D., Van Paepegem W. A study of tension fabric structures under in-plane loading: Nonlinear finite element analysis and validation. Composite Structures 128:10-20, 2015.
[12] Valdés-Vázquez J.G, Miquel J., Oñate E. Nonlinear finite element analysis of orthotropic and prestressed membrane structures. Finite Elements in Analysis and Design, 45:395-405, 2009.
[13] Rossi R., Lazzari M., Vitaliani R., Oñate E. Simulation of light-weight membrane structures by wrinkling model. International Journal for Numerical Methods in Engineering, 62:2127-2153, 2005.
[14] Wüchner R. Mechanik und Numerik der Formfindung und Fluid-Struktur-Interaktion von Membrantragwerken. Technischen Universität München, 2006.
[15] Center for Engineering Strong Motion Data https://strongmotioncenter.org/, 2018.
[16] Hilber H.M., Hughes T.J.R., Taylor R.L. Improved numerical dissipation for time integration algoriths in structural dynamics. Earthquake Engineering and Structural Dynamics, 5:283-292, 1977.
[17] Wood W.L., Bossak M., Zienkiewics O.C. (1980) An alpha modification of Newmark's method. International Journal for Numerical Methods in Engineering, 15:1562-1566, 1980.
[18] Chung J., Hulbert G.M. A time integration algorithm for structural dynamics with improved numerical dissipation: the generalized- method. Journal of Applied Mechanics, 60:371-375, 1993.
[19] GiD – The personal pre and post processor. CIMNE, 13 Edition, 2017.
Document information
Published on 08/02/19
Accepted on 23/09/18
Submitted on 23/05/18
Volume 35, Issue 1, 2019
DOI: 10.23967/j.rimni.2018.11.005
Licence: CC BY-NC-SA license
Share this document
Keywords
claim authorship
Are you one of the authors of this document?