Abstract
Post-seismic reinforcement is extensively used to repair structural elements of buildings hit by strong earthquakes, while pre-seismic reinforcement can be very convenient to improve the seismic performance of buildings designed according to less stringent standards than current. One of the most commonly used techniques for both pre and post-seismic retrofit of structures is that of wrapping elements previously identified as weak or damaged with sheets of fiber-reinforced polymers (FRP). This technique may be in fact more advantageous than other strengthening approaches, due to speed of placement, low environmental impact and small load increase. Non-linear methods of analysis can be very helpful for planning the retrofit strategy and assessing in advance its effectiveness. Based on non-linear static and dynamic numerical analyses, the effectiveness of the FRP pre-seismic reinforcement on the global performance of buildings was investigated in this paper with reference to a residential Italian building designed according to obsolete standards. The seismic capacity of the building, before and after the FRP retrofit, was assessed and the efficacy of the seismic rehabilitation was evaluated. The results show that, by improving the local resistance of the most vulnerable elements and the global ductility of the building, the FRP wrapping of the ground-floor columns of the considered building has an important impact on the overall seismic response of the structure, although it cannot entirely avoid undesirable global collapse mechanisms.
Keywords: Seismic retrofit, non-linear analysis, brittle failure
1. Introduction
Seismic rehabilitation of existing buildings may involve not only structures damaged by past earthquakes (post-seismic retrofit) but also structures that are expected to not withstand adequately future earthquakes (pre-seismic retrofit). Many unfavorable features can, in fact, compromise the seismic performance of a structure, such as, for instance, damages suffered during previous earthquakes or accumulated for inadequate maintenance; changes in use demanding greater structural capacity or simply the lack of modern aseismic design requirements. In general, however, similar approaches can be exploited either in case of pre or post-seismic retrofit.
Ranging from partial or global isolation techniques [1,2,3], to passive dissipative systems [4,5], many techniques are in fact available to improve the seismic behavior of buildings. Among them, the one based on wrapping weaker elements of reinforced concrete structures with FRP sheets is very popular due to some advantages that it brings: (i) it is a minimally invasive technique, which does not require the evacuation of the occupants for long periods of time, (ii) it is less polluting than other repair techniques that can generate more dust; (iii) it is able to increase the strength and confinement of the reinforced elements, improving ductile response and (iv) it does not increase the weight of the structure almost at all. Some limitations of this technique should be also mentioned such as, for instance, the poor improvement of structural stiffness it brings or the high costs it typically entails.
With reference to a case-study r/c building, this paper investigates on the effectiveness of the FRP reinforcement on the post-elastic behavior of buildings. Based on non-linear static and dynamic analyses, the improvements in ductility, strength and stiffness are evaluated, while the effects on the global pre-collapse behavior are put in evidence. Apart from the interesting results obtained for the case-study considered, the investigation aims also to evidence the ability of the non-linear methods of analysis to check the efficacy of the pre or post-seismic strategy planned by the designer.
2. Description of the retrofitted building
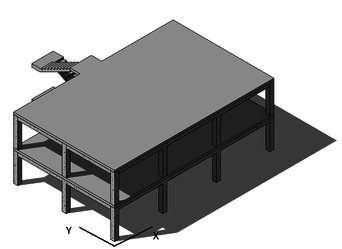
The building object of this study consists of a structure of two levels (commercial and residential use, respectively) with an accessible terrace [6]. This is a typology used in Italy in the last decades. The resulting geometry shows a rectangular plan () with constant elevation floors (3.00m). The access between the different levels is carried out by means of a reinforced concrete staircase exterior to the body of the building, which gives it an irregular configuration (Figure 1). The characteristics of the structural materials are shown in Table 1.
|
| Figure 1. Scheme of the pre-retrofitted building |
| Material | Type | Strength [MPa] | E [MPa] | G [MPa] |
| Concrete | ||||
| Reinforcement |
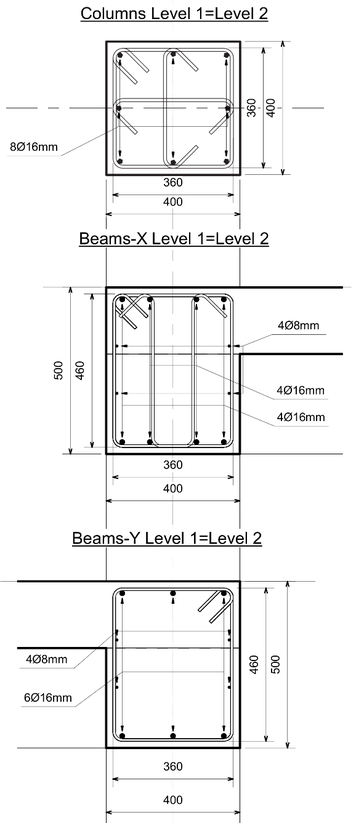
The structural system is made up of orthogonal frames, four in the y direction and three in the direction. The slabs are ribbed in the y direction, which defines two types of frames: frames that support predominantly seismic loads (in -direction) and frames that support both gravitational and seismic loads (in -direction). Figure 2 shows the cross sections of the columns and beams of the building. The building was designed according to an old Italian Regulations [7] deficient in terms of seismic design rules.
|
| Figure 2. Cross sections of columns and beams (measures in mm) |
2.1. Design of the retrofit using FRP
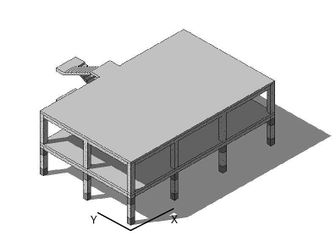
Once the structural analysis was carried out and the demands on the original building caused by both the service loads and the ultimate loads (including seismic actions) were determined, the capacity of each element was corroborated according to the current version of the Italian code [8]. Elements with insufficient capacity were assumed to be subjected to a reinforcement procedure using FRP sheets. At the end of this stage, it was determined that the ground-floor columns required reinforcement at both ends, since they were receiving large loads due to the formation of a soft- story mechanism typical of low-rise buildings. The reinforced elements are schematically represented in Figure 3.
|
| Figure 3. FRP reinforcement at the end sections of the ground-floor columns |
In particular, insufficient design details in longitudinal steel reinforcement and stirrups were detected, while the EC8 [9] (and the Italian current code) hierarchy rule linking the strength moments of columns and beams through an overstrength factor was found to be not met. To overcome this problem, the flexural strength of the final sections of the ground-floor columns should be properly increased to allow plastic hinges to develop at the end of the beams instead that at the end of columns.
The FRP reinforcement strategy was adopted to improve the behaviour of the building columns and try to meet the “strong columns/weak beams” capacity design rule prescribed by the modern seismic codes.
After a preliminary study over different kinds of FRP reinforcements, the Mapewrapt C UNI-AX-HM 600 produced by MAPEI was finally chosen (Table 2).
| Characteristic | Value |
| Thickness | 0.329mm |
| Tensile strength | 4410 MPa |
| Tensile modulus | 390000 MPa |
| Elongation | 1.10% |
| Weight | 600gr/m |
2.2. Modelling the building
Modeling and analyzing the building in the non-linear range, as well as determining its dynamic characteristics in the linear range have been carried out using the SeismoStruct software [10]. The process of modeling buildings includes the reliable representation of the mechanical characteristics of the materials that constitute the structural members. To obtain both the static and the dynamic response of the system in the linear and non-linear range, the constitutive curves of the materials should be defined. The constitutive models of Mander et al. [11] and of Menegotto and Pinto [12] were adopted for concrete and reinforcing steel, respectively.
Suitably modelling the geometric components of the structure is also essential to perform this kind of studies [13,14,15,16]. For this reason, the building has been discretized through finite elements, by subdividing each structural member into four elements. In such a way, different steel confinement zones can be identified, while the areas where FRP sheets are wrapped to improve the member behaviour can be separately considered. In turn, each element has been discretized using fiber models, which entailed splitting each section into at least 200 fibers.
One of the most important features to be considered in the analysis is the stiffening produced by the external stairs on the global response of the building. The presence of the stairs also affects the location of the stiffness center, which gives rise to a lateral response of the building where the distortional component of the movement is present. Unlike other studies in which the contribution of stairs is neglected [17,18,19], the non-linear analyses carried out in this research account for these structural components.
3. Non-linear response of the building
To evaluate the seismic performance of the structures, there are several types of analysis that are accepted worldwide, both within the engineering community and among researchers. The methods of analysis that consider the non-linear response of the structural elements are the preferred ones, since during strong earthquakes it is expected that many elements deform beyond the elastic range. Among the non-linear methods are the non-linear static analysis (Pushover analysis) and the non-linear dynamic analysis (incremental time-history analysis). Although being the most powerful method of seismic analysis, the non-linear dynamic analysis is still poorly used in practice [20,21]. On the contrary the Pushover analysis has become a very popular method.
3.1. Non-linear static procedure
Non-linear static analysis consists of a referential representation of the seismic response of structures with non-linear behavior. This kind of analysis is not able to catch exactly what happens when an earthquake affects a structure, but it does provide some important information on which parts of the structure are more fragile or what is the maximum expected ductility demand [22,16].
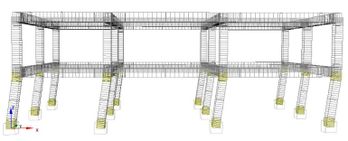
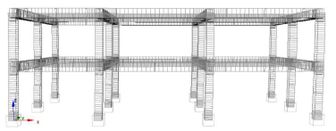
To carry out the static analyses, a distribution of lateral forces, increasing progressively at each load step, has been applied in the and directions, with both positive and negative sign. Two load patterns are considered, as also suggested by current seismic codes: a uniform distribution along the building height (uniform) and a distribution following the first modal shape (modal). Figures 4 and 5 show a qualitative representation of the deformations that are achieved by the original and the retrofitted building, when a modal distribution of the Pushover horizontal loads are applied. The comparison highlights the beneficial effect of the FRP reinforcement on plastic deformations. It can be noted that the soft-story mechanism exhibited by the original building (pre-retrofit) is sensibly reduced after FRP strengthening, although not entirely avoided.
|
| Figure 4. Deformation of the pre-retrofitted building |
|
| Figure 5. Deformation of the retrofitted building |
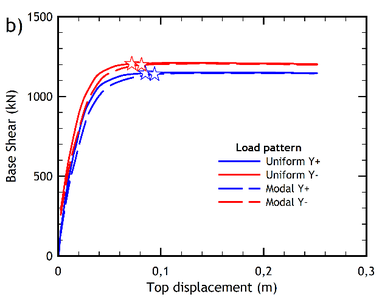
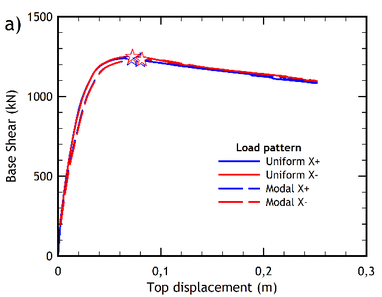
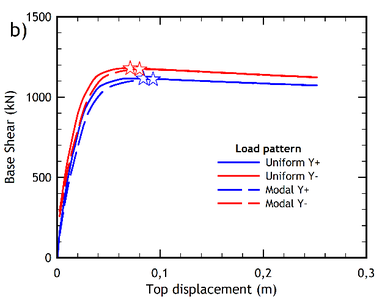
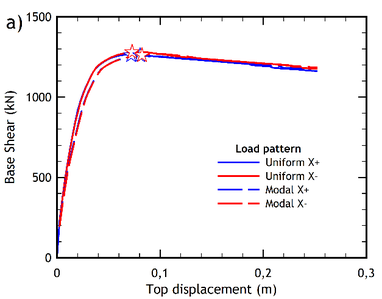
Figures 6a and 6b show the capacity curves of the pre-retrofitted building resulting from the analyses carried out through the two lateral load patterns, in two orthogonal directions. Similarly, the capacity curves obtained for the retrofitted building are shown in Figures 7a and 7b.
|
|
| Figure 6. Capacity curves of the pre-retrofitted building. (a) -direction. (b) -direction | |
|
|
| Figure 7. Capacity curves of the retrofitted building. (a) -direction. (b) -direction | |
From the capacity curves the values of the ultimate base shear and the ultimate displacement are obtained. Through these two characteristics, the idealized capacity curve is determined by applying the procedure of Park [23], which seeks to obtain an equivalence between the energy dissipated by the capacity curve and the idealized curve. The latter curve provides the value of the yield displacement , that allows to calculate the displacement ductility through the following equation:
|
|
(1) |
On the other hand, the value of the design base shear in each direction can be calculated through a modal-response-spectrum analysis. The ratio between the ultimate base shear (computed from the capacity curve) and the design base shear provides the building over-strength factor (Eq. (2)), which is a safety factor that encompasses the conservative considerations of conventional design [24,25].
|
|
(2) |
3.2. Non-linear dynamic procedure
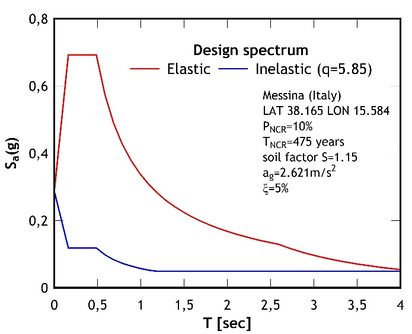
The non-linear dynamic procedure is commonly recognized as the most comprehensive attempt to reproduce the effects of an earthquake on a structure [9,26]. For this purpose, a set of strong ground motions compatible with the seismic conditions of the place of location should be applied. Consistent with the design response spectrum of Messina (Figure 8), seven couples of accelerograms were considered in the present study, some data of which are listed in Table 3 [6]. Note that all the selected accelerograms correspond to near source earthquakes with moderate values of moment magnitude and were obtained by means of the REXEL software [27].
|
| Figure 8. Elastic and inelastic design spectra of Messina |
| Earthquake | Date | Station ID | (km) | |
| Kalamata | 13/09/86 | ST163 | 5.9 | 11 |
| Friuli (aftershock) | 15/09/76 | ST24 | 6.0 | 14 |
| South Iceland | 17/06/00 | ST2562 | 6.5 | 21 |
| Kozani (aftershock) | 19/05/95 | ST1372 | 5.2 | 16 |
| South Iceland | 17/06/00 | ST2482 | 6.5 | 15 |
| Montenegro | 15/04/79 | ST67 | 6.9 | 16 |
| Erzincan | 13/03/92 | ST205 | 6.6 | 13 |
To evaluate the collapse threshold of a structure through a time-history analysis, it is necessary to carry out the so-called incremental dynamic analysis (IDA). This type of analysis is commonly accepted among the community of researchers as the most appropriate to perform the assessment of collapse, having even preferential treatment in some specialized documents, such as FEMA P-695 [28] and FEMA P-58 [29].
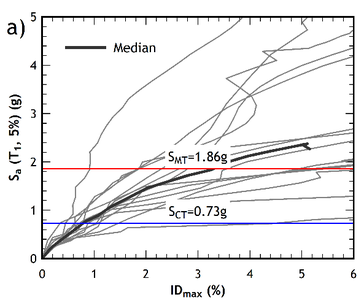
IDA should be carried out by monotonically increasing the ordinates of the selected accelerograms by some scale factors, to force the structure from elastic to inelastic behaviour until the collapse is reached. The value of the spectral acceleration obtained from the elastic response spectrum of the given earthquake for each value of the amplification factor, which represents the intensity measure (), should be plotted against the value of the engineering demand () parameter, which is usually either the drift interstorey or the global drift.
There are several criteria to establish when a structure reaches local or global collapse. In the present research, the point at which the IDA curve reaches a slope less than or equal to 20% of the initial slope (elastic) has been chosen as the collapse criterion [30,31].
Given the variability of the acceleration records [32], it is inconvenient to apply a single dynamic incremental analysis to determine the threshold of collapse of a structure. For this reason, FEMA prescribes to obtain results from a set of different pairs of accelerogram components. The value of the threshold of spectral acceleration computed for a 5% of the critical damping is then obtained from the IDA curves relevant to the set of selected records. The mean value of the spectral accelerations at the collapse point of a half of the curves is recognized as the median collapse capacity .
According to FEMA P695, the ratio between and the intensity of the maximum considered earthquake ( ), determined as the peak acceleration taken from the elastic spectrum in correspondence of the period of the structure in both the analysis directions, gives the collapse margin ratio :
|
|
(3) |
The collapse margin ratio is an effective measure of the seismic safety of a structure against the occurrence of a strong ground motion defined by the design elastic spectrum.
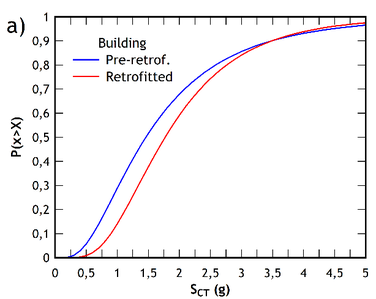
Fragility curves are obtained from the median collapse values determined from the set of IDA curves with a standard deviation equal to the total uncertainty ( ) computed as the contribution of the uncertainty of the involved variables. Thus, the total uncertainty can be calculated as:
|
|
(3) |
where , , and are the record-to-record collapse uncertainty, the design requirements-related collapse uncertainty, the test data-related collapse uncertainty and the modeling-related collapse uncertainty, respectively. In this investigation, the recommendations of FEMA P-695 have been followed for the choice of the uncertainty factors, which in sake of brevity are summarized in Table 4, together with the calculated values of total uncertainty .
| Pre-retrofitted | Retrofitted | |
| 0.40 | 0.40 | |
| 0.50 | 0.20 | |
| 0.10 | 0.20 | |
| 0.20 | 0.20 | |
| 0.68 | 0.53 |
4. Assessment of the seismic capacity of the buildings
This section presents the results of the static and dynamic analyses performed to assess the seismic behaviour of the pre-retrofitted building and then of the retrofitted building.
4.1. Seismic capacity of the pre-retrofitted building
In order to evaluate the seismic capacity of the building before the retrofit procedure, the non-linear analyses described above were carried out. The target parameters that allow a comparison between the pre-retrofit and the post-retrofit seismic response of the building were thus determined.
The capacity curves obtained from the pseudo-static nonlinear analysis of the pre-retrofitted building are plotted in Figures 6a and 6b, while the displacement ductility and the over-strength factor calculated for the two main directions are listed in Table 5.
| Load Pattern | ||||
| Uniform | 2.40 | 3.68 | 2.43 | 3.32 |
| Uniform | 2.47 | 3.71 | 2.68 | 3.52 |
| Modal | 2.36 | 3.64 | 2.66 | 3.30 |
| Modal | 2.53 | 3.66 | 2.53 | 3.49 |
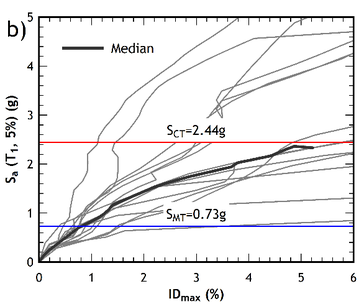
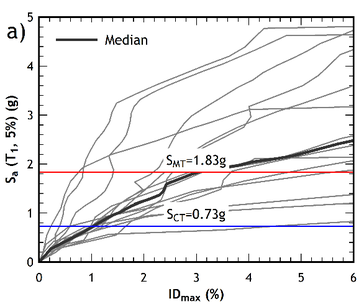
The IDA curves obtained for the seven pairs of accelerograms are shown in Figures 9a and 9b. Spectral accelerations Sa values are plotted vs the maximum interstorey drift computed for each scale factor. In the two figures the value of the spectral acceleration at which a half plus one of the curves reached the point of collapse, is plotted together with , namely the spectral intensity of the maximum considered earthquake.
|
|
| Figure 9. IDA curves of the pre-retrofitted building. (a) direction. (b) direction | |
4.2. Seismic capacity of the retrofitted building
The capacity curves of the retrofitted building are shown in Figures 7a and 7b. Note that the performance point of each curve is also indicated in the figures (by a star-shaped point), as obtained according to the method N2 standard procedure [33] also allowed by Eurocode 8 [9] for a very high seismic hazard level (the case-study building is in fact located in the high-seismicity area of Messina in Italy). Note also that each capacity curve has been plotted for both the uniform and the modal distribution of the lateral forces used to carry out the pushover analysis.
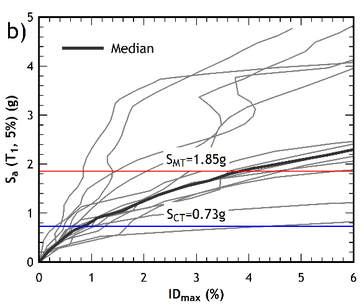
From a qualitative point of view, the capacity curves of the retrofitted building (Figures 7a and 7b) exhibit a more ductile response compared to the capacity curves of the pre-retrofitted structure (Figures 6a and 6b), where a softening behaviour of the post- yielding branch is exhibited. The IDA curves of the retrofitted building are shown in Figures 10a and 10b, for the and directions, respectively.
|
|
| Figure 10. IDA curves of the retrofitted building. (a) direction. (b) direction | |
The results show that the retrofitted building may exhibit higher values of ductility than the pre-retrofitted one. While a modest increase in ductility (up to almost 15%) is found in the direction of analysis, a much more marked increase is reached in the y-direction (even more than 85%), as can be also inferred from Tables 6 and 8.
| Load Pattern | ||||
| Uniform + | 2.38 | 3.76 | 4.51 | 3.42 |
| Uniform - | 2.70 | 3.81 | 4.54 | 3.60 |
| Modal + | 2.48 | 3.74 | 4.43 | 3.41 |
| Modal - | 2.90 | 3.77 | 4.23 | 3.58 |
Table 6 shows that an improvement is obtained in terms of ductility and overstrength, generally regardless of the pattern and the direction of analysis. However, it should be mentioned that the improvements in over-strength barely reach 3% in the two directions of analysis, which is a consequence of having reinforced localized zones of the structure.
As for the displacements reached at the performance point, it should be noted that the Italian standard contemplates several behavioral Limit States that can be evaluated by pushover analysis. In order to compare these values, the collapse prevention limit state has been selected for a location of the building in the city of Messina, as previously indicated. However, the improvement in the displacement response at the performance point is practically negligible, since it reaches values less than 1% in the case of the retrofitted building, practically for all the load patterns applied (Figures 6 and 7).
5. Results comparison
In reviewing the results of the non-linear analysis of the buildings, there are some interesting features about the improvement of the seismic performance of the retrofitted building with respect to the non-retrofitted building.
| Load Pattern | ||||
| Uniform + | 0.41 | 2.02 | 1.54 | 2.66 |
| Uniform - | 0.62 | 2.37 | 0.99 | 2.13 |
| Modal + | 0.95 | 2.52 | 0.85 | 2.51 |
| Modal - | 0.93 | 2.30 | 1.38 | 2.09 |
The results evidence an improvement -although not sensibly marked- of the performance of the retrofitted building for any load pattern and direction of analysis. Table 7 provides the percentage variation of the top displacement ( and ) at the performance point and of the base shear ( and ) of the retrofitted building. The increase of these values in the retrofitted structure represents an improvement in capacity, both in strength and deformation.
It is also interesting to study the variation of ductility and of overstrength of the retrofitted structure with respect to the original building. The percentage increase of global ductility and over-strength of the retrofitted building are shown in Table 8. Results show that the retrofitted building improves overall performance under any load pattern with a very marked increase of ductility in the direction.
| Load Pattern | ||||
| Uniform + | -0.83 | 2.17 | 85.60 | 3.01 |
| Uniform - | 9.31 | 2.70 | 69.40 | 2.27 |
| Modal + | 5.08 | 2.75 | 66.64 | 3.33 |
| Modal - | 14.62 | 3.01 | 67.19 | 2.58 |
The calculated values of the collapse margin ratio () for the pre-retrofitted and retrofitted buildings are shown in Table 9. Although an increase of more than 20% of the was found after retrofitting the building, it is to note, however, that both sets of values are acceptable for the level of seismic demand considered, for both directions of analysis.
| Direction | ||
| Pre-retrofitted | 2.00 | 2.04 |
| Retrofitted | 2.42 | 2.22 |
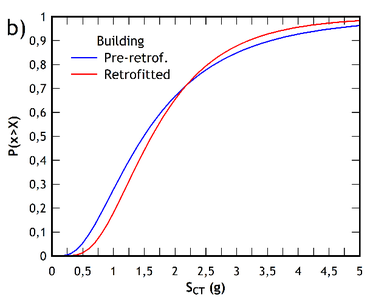
The collapse fragility curves of the pre-retrofitted and post-retrofitted building are shown in Figure 11, relevant to both the and direction. They are plotted against the value of the median collapse capacity obtained for each direction of the buildings analyzed, with a lognormal distribution in which the standard deviation is equal to the value of the total uncertainty shown in Table 4.
|
|
| Figure 11. IDA curves of the retrofitted building. (a) direction. (b) direction | |
Finally, Table 10 compares the exceedance probabilities for the Collapse Limit State in each direction of analysis of the buildings, computed for the expected spectral acceleration value in Messina. Note that the retrofitted building shows a notable reduction in the probability of exceedance, which evidences the improvement in the seismic security achieved by adding the FRP.
| Direction | ||
| Pre-retrofitted | 0.27 | 0.26 |
| Retrofitted | 0.16 | 0.16 |
| % of variation | -40.74 | -38.46 |
6. Concluding remarks
In this study the results of the analysis of a typical low-rise reinforced concrete building, designed with a low level of structural details, according to an obsolete version of the Italian code, have been presented.
The strategy used for the retrofit of the building has been to add FRP sheets in both ends of the ground-floor columns, where deficiencies in shear and flexural strength as well as inadequate concrete confinement due to insufficient stirrups were detected.
The effectiveness of the FRP reinforcement was assessed by comparing the seismic performance of the original building with that of the retrofitted one, as obtained through static and dynamic non-linear analyses. Pushover-based capacity curves were analysed together with IDA and fragility curves to highlight any improvement in the seismic response of the retrofitted building. The results obtained from the static non-linear analysis show a slight improvement of the target point displacement capacity and of the base shear capacity at the elastic limit. An improvement of global ductility and over-strength values was also evidenced, with a strong increase of ductility in the direction.
A comparison between the deformed shapes of the building before and after FRP reinforcement shows that a typical soft-story collapse mechanism affects the seismic performance of the structure, which is not entirely avoided by adding FRP to the columns of the ground floor.
The results of the dynamic incremental analysis have allowed the determination of collapse margin ratio values, which indicate an increase in the seismic safety of the retrofitted building compared to the original one. Similarly, when applying the FEMA P-58 procedure, an appreciable reduction of the probability of collapse of the retrofitted building was found.
The investigation presented in the paper evidences the great predictive capacity of code-based static and dynamic non-linear analyses, which can be very helpful to assess in advance the effectiveness of the strategy adopted in the preliminary process of pre-seismic retrofit of existing buildings.
Acknowledgements
First and third authors would like to acknowledge to Pontificia Universidad Católica de Valparaíso for the support of this research. The MOSGLOB Program and the Visiting Professor Program of the University of Cagliari (Italy) are also acknowledged by the authors. The paper has been developed in the framework of a bilateral agreement between the Universities of Valparaiso and Cagliari.
References
| [1] | Porcu M.C. Partial floor mass isolation to control the seismic stress in framed buildings. Int. J. of Safety and Security, 9(2):157-165, 2019. |
| [2] | Porcu M.C. Reducing seismic stress on buildings through inertia limiters at floor level. In Earthquake Resistant Engineering Structures IX; WIT Press Southampton, 2013. |
| [3] | Mazza F., Mazza M., Vulcano A. Base-isolation systems for the seismic Retrofitting of rc framed buildings with soft-storey subjected to near-fault earthquakes. Soil Dynamics and Earthquake Engineering, 109:209-221, 2018. |
| [4] | Ghiani C., Linul E., Porcu M.C., Marsavina L., Movahedi N., Aymerich F. Metal foam-filled tubes as plastic dissipators in earthquake-resistant steel buildings. In IOP Conf. Series: Materials Science and Engineering, 2018. |
| [5] | Symans M.D., Charney F.A., Whittaker A.S., Constantinou M.C., Kircher C.A., Johnson M.W., McNamara R.J. Energy dissipation systems for seismic applications: current practice and recent developments. Journal of Structural Engineering, 134:3-21, 2008. |
| [6] | Porcu M.C., Vielma J.C., Panu F., Aguilar C., Currelli G. Seismic retrofit of existing buildings led by non-linear dynamic analyses. Int. J. of Safety and Security Engineering, 9(3):201-212, 2019. |
| [7] | NTC. Norme tecniche per l’esecuzione delle opera in cemento armato normale e precompresso e per le strutture metalliche. NTC, Rome, 1976. |
| [8] | NTC. Norme Tecniche per le Costruzioni. NTC, Rome, 2019. |
| [9] | CEN. EN 1998-3: Eurocode 8: Design of structures for earthquake resistance. European Commitee for Standardization, Brussels, 2004. |
| [10] | Seismosoft. SeismoStruct 2018 – A computer program for static and dynamic nonlinear analysis of framed structures, 2018. [Online]. Available: from http://www.seismosoft.com. |
| [11] | Mander J.B., Priestley M.J.N., Park R. Theoretical stress‐strain model for confined concrete. Journal of Structural Engineering, 114:1804–1826, 1988. |
| [12] | Menegotto M., Pinto P.E. Method of analysis for cyclically loaded R.C. plane frames including changes in geometry and non-elastic behaviour of elements under combined normal force and bending. In Symposium on the Resistance and Ultimate Deformability of Structures Acted on by Well Defined Repeated Loads, International Association for Bridge and Structural Engineering, Zurich, 1973. |
| [13] | Porcu M.C., Carta G. A better rigid-plastic estimate for earthquake-induced plastic displacements. Int. J. of Safety and Security Engineering, 2(2):184-196, 2012. |
| [14] | Porcu M.C. Ductile behavior of timber structures under strong dynamic loads. In Wood in Civil Engineering, Intech, Rijeka, 173-196, 2017. |
| [15] | Vielma J.C., Cando M.A. Calibration of the reduction factors used in Ecuador for steel SMRF. Bulletin of the International Institute of Seismology and Earthquake Engineering, 52:22-37, 2018. |
| [16] | Vielma J.C., Barbat A.H., Oller S. Seismic safety of low ductility structures used in Spain. Bulletin of Earthquake Engineering, 8:135-155, 2010. |
| [17] | Herrera I., Ugel R., Vielma J.C., Pujades L. Seismic response and torsional effects of RC structure with irregular plant and variations in diaphragms, designed with Venezuelan codes. WIT Transactions on The Built Environment, 132:85-96, 2013. |
| [18] | Vielma J.C., Mulder M.M. Assessment of the seismic design factors of plan-irregular RC buildings. In Earthquake Resistant Engineering Structures XI, WIT Press Southampton, 47-58, 2017. |
| [19] | Vielma J.C., Mulder M.M. Improved procedure for determining the ductility of buildings under seismic loads. Revista Internacional de Métodos Numéricos para Cálculo y Diseño en Ingeniería, 34:1-27, 2018. |
| [20] | Porcu M.C. Code inadequacies discouraging the earthquake-based seismic analysis of buildings. Int. J. of Safety and Security Engineering, 7(4):545–556, 2017. |
| [21] | Porcu M.C., Bosu C., Gavrić I. Non-linear dynamic analysis to assess the seismic performance of cross-laminated timber structures. Journal of Building Engineering, 19:480-493, 2018. |
| [22] | Vielma J.C., Barbat A.H., Oller S. Seismic performance of buildings with waffled-slab floors. Structures and Buildings, 162:169-182, 2009. |
| [23] | Park R. State-of-the-art report: ductility evaluation from laboratory and analytical testing. In Proceedings 9th WCEE, Tokyo, 1998. |
| [24] | Elnashai A.S., Mwafy A.M. Calibration of force reduction factors of RC buildings. Journal of Earthquake Engineering, 6(2):239-273, 2002. |
| [25] | Mwafy A.M., Elnashai A.S. Overstrength and force reduction factors of multistorey reinforced-concrete buildings. The Structural Design of Tall Buildings, 11:329-351, 2002. |
| [26] | ASCE/SEI. Seismic Evaluation and Retrofit of Existing Buildings. ASCE/SEI 41-17. American Society of Civil Engineers, Reston, 2017. |
| [27] | Iervolino I., Galasso C., Cosenza E. REXEL: computer aided record selection for code-based seismic structural analysis. Bulletin of Earthquake Engineering, 8(2):339–362, 2010. |
| [28] | FEMA. Quantification of Building Seismic Performance Factors. FEMA P-695. Federal Emergency Management Agency, Washington D.C., 2009. |
| [29] | FEMA. Seismic Performance assessment of buildings - Implementation guide. FEMA P-58-2. Federal Emergency Management Agency, Washington D.C., 2012. |
| [30] | Vamvatsikos D., Cornell C.A. Direct estimation of the seismic demand and capacity of oscillators with multi-linear static pushovers through IDA. Earthquake Engineering and Structural Dynamics, 35:1097–1117, 2006. |
| [31] | Vamvatsikos D., Cornell C.A. Incremental dynamic analysis. Earthquake Engineering and Structural Dynamics, 31(3):491–514, 2002. |
| [32] | Angulo C., Díaz K., Gutiérrez J.M., Prado A., Casadey R., Pannillo G., Muñoz-La Rivera F., Herrera R., Vielma J.C. Using BIM for the assessment of the seismic performance of educational buildings. Int. J. of Safety and Security Engineering, 10(1):77-82, 2020. |
| [33] | Fajfar P., Gašperšič P. The N2 method for the seismic damage analysis of RC buildings. Earthquake Engineering and Structural Dynamics, 25:31–46, 1996. |
Document information
Published on 02/04/20
Accepted on 26/03/20
Submitted on 27/10/19
Volume 36, Issue 2, 2020
DOI: 10.23967/j.rimni.2020.03.009
Licence: CC BY-NC-SA license
Share this document
Keywords
claim authorship
Are you one of the authors of this document?
