(→2.1 Brief description of the conceptual model for the anti-dip rock slopes in the TRGA) |
m (Tag: Visual edit) |
||
| Line 16: | Line 16: | ||
--> | --> | ||
| − | '''Abstract''':The fluctuation of water levels in large reservoirs has long been recognized as a critical external factor that affects the stability of bank slopes. However, there have been limited studies investigating the influence of reservoir water level (RWL) fluctuation on anti-dip layered rock slopes. In this study, we constructed a conceptual model by selecting the sandstone in the Three Gorges Reservoir Area (TRGA) as the strata and considering variations in strata thickness, strata dip angle, permeability coefficient, RWL fluctuation rate, and slope height. Through seepage-stress field coupled analysis, we obtained the seepage field and groundwater lines, and determined the factor of safety (FoS) using the improved cantilever beam limit equilibrium method. We then investigated the variations of the groundwater line and FoS throughout the entire process of RWL rising and drawdown. Our results indicate that the changes in groundwater levels in the slope clearly lag behind RWL fluctuations, with stability improving during the rising stage but deteriorating during the drawdown stage. Range analysis, using the maximum curvature of the groundwater level line | + | '''Abstract''':The fluctuation of water levels in large reservoirs has long been recognized as a critical external factor that affects the stability of bank slopes. However, there have been limited studies investigating the influence of reservoir water level (RWL) fluctuation on anti-dip layered rock slopes. In this study, we constructed a conceptual model by selecting the sandstone in the Three Gorges Reservoir Area (TRGA) as the strata and considering variations in strata thickness, strata dip angle, permeability coefficient, RWL fluctuation rate, and slope height. Through seepage-stress field coupled analysis, we obtained the seepage field and groundwater lines, and determined the factor of safety (FoS) using the improved cantilever beam limit equilibrium method. We then investigated the variations of the groundwater line and FoS throughout the entire process of RWL rising and drawdown. Our results indicate that the changes in groundwater levels in the slope clearly lag behind RWL fluctuations, with stability improving during the rising stage but deteriorating during the drawdown stage. Range analysis, using the maximum curvature (MaxCurve) of the groundwater level line as the reference, reveals that the permeability coefficient has the most significant impact on the lagging effect, followed by the fluctuation rate, thickness, and dip angle. Similarly, when considering the amplitude of variation in FoS during the entire process of RWL rising and drawdown as the reference, range analysis shows that the permeability coefficient has the greatest impact on stability variation, followed by the fluctuation rate, thickness, dip angle, and slope height. |
'''Keywords: '''sensitivity analysis; water level fluctuation; anti-dip rock slope; factor of stability; seepage field; cantilever limit equilibrium model | '''Keywords: '''sensitivity analysis; water level fluctuation; anti-dip rock slope; factor of stability; seepage field; cantilever limit equilibrium model | ||
| Line 36: | Line 36: | ||
===2.1 Brief description of the conceptual model for the anti-dip rock slopes in the TRGA=== | ===2.1 Brief description of the conceptual model for the anti-dip rock slopes in the TRGA=== | ||
| − | Anti-dip rock slopes are commonly found in the TRGA. One of the typical failure modes of high steep bank slopes in this area, as identified by Yin et al. [45], is the toppling failure of anti-dip rock slopes. An example of such a failure is the Gongjiafang landslide with the volume of about 500,000 | + | Anti-dip rock slopes are commonly found in the TRGA. One of the typical failure modes of high steep bank slopes in this area, as identified by Yin et al. [45], is the toppling failure of anti-dip rock slopes. An example of such a failure is the Gongjiafang landslide with the volume of about 500,000 m<sup>3</sup>, which occurred on 23 November 2008 and resulted in a surge wave of 31.8 m in the Wu Gorge. The mechanism behind the Gongjiafang landslide failure has been studied by Gu and Huang [4], and the issue of landslide-generated waves has been a significant topic of discussion since then. |
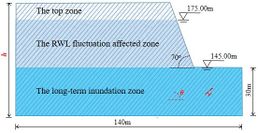
The lithologies and slope structures of anti-dip rock slopes vary in TRGA. To comprehend the key factors influencing their stability, this study proposes a conceptual model based on the representative characteristics of these slopes. Rather than analyzing a specific example, the model offers a comprehensive understanding of anti-dip rock slopes, as depicted in Figure 1. | The lithologies and slope structures of anti-dip rock slopes vary in TRGA. To comprehend the key factors influencing their stability, this study proposes a conceptual model based on the representative characteristics of these slopes. Rather than analyzing a specific example, the model offers a comprehensive understanding of anti-dip rock slopes, as depicted in Figure 1. | ||
| Line 47: | Line 47: | ||
| − | The conceptual model has a length of | + | The conceptual model has a length of 140 m, with the reservoir water located on the right side of the model. The impoundment of the Three Gorges reservoir began in June 2003 and was completed in October 2010. Currently, on a hydrological year basis (October-September), the RWL fluctuates between 145 m during the wet season (May-September) for flood control and 175 m during the dry season (October-May) for hydropower generation. This creates a 30m height fluctuation zone for the RWL, as shown in Figure 1. The model includes a 30m height region below 145 m to account for the differences in physical and mechanical properties between rocks in the RWL fluctuation affected zone and the long term inundation zone. |
In the conceptual model, the rock mass is defined as sandstone. Sandstone makes up a significant portion of the Jurassic and Triassic sedimentary clastic rocks, which are commonly found in the anti-dip rock slopes in the TRGA. Previous studies have extensively examined the variations in the physical and mechanical properties of sandstone under cyclic wet-dry conditions, yielding abundant data for selecting different parameters to accurately depict the impact of the environment on the properties of the sandstone [37-38]. | In the conceptual model, the rock mass is defined as sandstone. Sandstone makes up a significant portion of the Jurassic and Triassic sedimentary clastic rocks, which are commonly found in the anti-dip rock slopes in the TRGA. Previous studies have extensively examined the variations in the physical and mechanical properties of sandstone under cyclic wet-dry conditions, yielding abundant data for selecting different parameters to accurately depict the impact of the environment on the properties of the sandstone [37-38]. | ||
| Line 57: | Line 57: | ||
According to the different environments in which the rock mass is located, the conceptual model divides it into three zones from the base to the top: the long-term inundation zone, the RWL fluctuation affected zone, and the top zone. In the top zone, the water-rock interaction has little effect on the rock mass, so the parameters of sandstone and its joints can be considered normal. However, in the long-term inundation zone, where there is continuous immersion, and in the RWL fluctuation affected zone, where there are periodic wet-dry cycles, the irreversible progressive deteriorations in the physical and mechanical parameters of the rock mass are likely to occur. This indicates that the rock mass in these two zones should have degenerate parameters. | According to the different environments in which the rock mass is located, the conceptual model divides it into three zones from the base to the top: the long-term inundation zone, the RWL fluctuation affected zone, and the top zone. In the top zone, the water-rock interaction has little effect on the rock mass, so the parameters of sandstone and its joints can be considered normal. However, in the long-term inundation zone, where there is continuous immersion, and in the RWL fluctuation affected zone, where there are periodic wet-dry cycles, the irreversible progressive deteriorations in the physical and mechanical parameters of the rock mass are likely to occur. This indicates that the rock mass in these two zones should have degenerate parameters. | ||
| − | Previous researchers have extensively studied the deterioration laws of sandstone under these two water-rock interaction conditions [37-38]. The deterioration is usually steep in the beginning and then slows down, eventually reaching a point where the water immersion time or the number of wet-dry cycles no longer cause further deterioration. Recently, the wet-dry cycle experiments have been performed to obtain the shear mechanical properties of jointed rock masses under water-rock interaction [ | + | Previous researchers have extensively studied the deterioration laws of sandstone under these two water-rock interaction conditions [37-38]. The deterioration is usually steep in the beginning and then slows down, eventually reaching a point where the water immersion time or the number of wet-dry cycles no longer cause further deterioration. Recently, the wet-dry cycle experiments have been performed to obtain the shear mechanical properties of jointed rock masses under water-rock interaction [47]. It is verified that the degradation range of shear strength parameters caused by the first six water-rock interaction cycles accounted for approximately 90% of the total range. Given that more than 13 years have passed since the Three Gorges reservoir entered its normal operation stage, it is assumed that the deterioration of the physical and mechanical parameters of the rock mass has already been completed in this study. Consequently, the parameters of sandstone and its joints are assigned values based on previous studies [37-38, 47], which are provided in Table 1 and Table 2. The sandstone and joints in the RWL fluctuation affected zone exhibit higher parameters compared to those in the long-term inundation zone, which aligns with the findings of Zhu et al. [48]. Zhu et al. [48] conducted Brazil splitting tests on sandstone under wet-dry cycling and long-term saturation conditions. The results showed that the reduction in sandstone tensile strength was more significant in the wet-dry cycling condition than in the long-term saturation condition. This can be attributed to the expansion and contraction of mineral grains and cements during wet-dry cycles, which leads to a greater deterioration of cementation and friction between grains. |
<span id='_Ref146265301'></span><div id="_Ref145743666" class="center" style="width: auto; margin-left: auto; margin-right: auto;"> | <span id='_Ref146265301'></span><div id="_Ref145743666" class="center" style="width: auto; margin-left: auto; margin-right: auto;"> | ||
| Line 189: | Line 189: | ||
Above all, the thickness of the strata has a significant influence on the seepage field in anti-dip layered rock slopes, assuming a constant permeability and fluctuation rate. However, this influence is minimal when the thickness is small. It is worth noting that excessively small thickness will result in increased complexity in the subsequent numerical model and higher computational costs. Therefore, for the purpose of this study, only anti-dip rock slopes with thick layers are considered. The minimum thickness is assumed to be 1m, and the thickness increases by 1m in each level. | Above all, the thickness of the strata has a significant influence on the seepage field in anti-dip layered rock slopes, assuming a constant permeability and fluctuation rate. However, this influence is minimal when the thickness is small. It is worth noting that excessively small thickness will result in increased complexity in the subsequent numerical model and higher computational costs. Therefore, for the purpose of this study, only anti-dip rock slopes with thick layers are considered. The minimum thickness is assumed to be 1m, and the thickness increases by 1m in each level. | ||
| − | Secondly, the minimum assumed strata dip angle is 50° according to previous research. In practice, a rock slope is considered a gentle dipping slope if the dip angle is less than 20° and a steep dipping slope if the dip angle is greater than 45°. It has been verified in previous studies that toppling failure is more likely to occur in steep dipping slopes [ | + | Secondly, the minimum assumed strata dip angle is 50° according to previous research. In practice, a rock slope is considered a gentle dipping slope if the dip angle is less than 20° and a steep dipping slope if the dip angle is greater than 45°. It has been verified in previous studies that toppling failure is more likely to occur in steep dipping slopes [46]. Therefore, the three levels for the strata dip angle are set as 50°, 60°, and 70°. |
Next, the fluctuation rate of RWL is determined by analyzing the data of RWL change in the TGRA from September 1, 2011 to September 1, 2014. The maximum rate of increase during this period was 3.21 m/d, while the maximum rate of decrease was 2.79 m/d. To simplify the analysis, the maximum value of RWL fluctuation rate is set at 3 m/d in this study, with the rate decreasing by 1 m/d in each subsequent level. | Next, the fluctuation rate of RWL is determined by analyzing the data of RWL change in the TGRA from September 1, 2011 to September 1, 2014. The maximum rate of increase during this period was 3.21 m/d, while the maximum rate of decrease was 2.79 m/d. To simplify the analysis, the maximum value of RWL fluctuation rate is set at 3 m/d in this study, with the rate decreasing by 1 m/d in each subsequent level. | ||
| − | Then, slopes are | + | Then, following the study by Zhu and He [49], slopes are categorized into three types based on their permeability coefficients: strong permeability (''k'' ⩾ 1×10<sup>-4</sup> m/s), moderate permeability (1×10<sup>-5</sup> m/s < ''k'' < 1×10<sup>-4</sup> m/s), and weak permeability (''k'' ⩽ 1×10<sup>-5</sup> m/s). In this study, two threshold values were chosen to represent the two levels in Table 3, allowing for a better understanding of how permeability affects the seepage field in anti-dip layered rock slopes. |
| − | Finally, the three levels for the slope height are set at | + | Finally, the three levels for the slope height are set at 70 m, 80 m, and 90 m, resulting in the slope crest being located at 10 m, 20 m, and 30 m above 175 m, which is the highest RWL. In comparison to the practical bank slopes in TRGA, the slope height is set at a lower level. This decision was made because in this study, the seepage field and groundwater level are obtained through the coupled analysis of the seepage-stress field. Setting a larger value for the slope height would result in excessive calculation workload. |
==3. The seepage field during a complete rising and drawdown process of RWL== | ==3. The seepage field during a complete rising and drawdown process of RWL== | ||
| Line 203: | Line 203: | ||
GDEM software, developed by Beijing Ji-Dao-Cheng-ran Technology Co., ltd. and the Institute of Mechanics, Chinese Academy of Sciences, utilizes the continuum-based discrete element method (CDEM) as its core algorithm. By combining the advantages of discrete elements and finite elements, CDEM can analyze the progressive failure of materials by considering the fracture of block boundaries and block interiors. This allows it to simulate the entire process from continuous deformation to crack generation and propagation. GDEM utilizes graphics processing unit (GPU) technology to enhance its calculation capabilities. | GDEM software, developed by Beijing Ji-Dao-Cheng-ran Technology Co., ltd. and the Institute of Mechanics, Chinese Academy of Sciences, utilizes the continuum-based discrete element method (CDEM) as its core algorithm. By combining the advantages of discrete elements and finite elements, CDEM can analyze the progressive failure of materials by considering the fracture of block boundaries and block interiors. This allows it to simulate the entire process from continuous deformation to crack generation and propagation. GDEM utilizes graphics processing unit (GPU) technology to enhance its calculation capabilities. | ||
| − | GDEM incorporates a dual-medium seepage model for both pores and fractures, making it suitable for conducting seepage-stress field coupled analysis in fractured rock slopes. This model divides the fractured rock mass into two systems: the rock block pore system and the fracture system. It establishes separate water kinematical equations for the pore and fracture systems based on the Darcy law and the cubic law, respectively, and combines them using a water exchange equation. The fluid flow in the fracture exerts fluid pressure on the rock blocks on either side, causing the adjacent rock blocks to open and close under the influence of fluid pressure and external load. The change in relative displacement between two rock blocks affects the opening of the fracture, which in turn leads to a change in fluid pressure. For more detailed information, please refer to the work of Ren et al [ | + | GDEM incorporates a dual-medium seepage model for both pores and fractures, making it suitable for conducting seepage-stress field coupled analysis in fractured rock slopes. This model divides the fractured rock mass into two systems: the rock block pore system and the fracture system. It establishes separate water kinematical equations for the pore and fracture systems based on the Darcy law and the cubic law, respectively, and combines them using a water exchange equation. The fluid flow in the fracture exerts fluid pressure on the rock blocks on either side, causing the adjacent rock blocks to open and close under the influence of fluid pressure and external load. The change in relative displacement between two rock blocks affects the opening of the fracture, which in turn leads to a change in fluid pressure. For more detailed information, please refer to the work of Ren et al [50]. While the primary focus of this study is on the seepage field, it is important to conduct a coupled analysis of the seepage-stress field. This is because the opening of fractures in the anti-dip rock slopes is bound to have an impact on seepage. |
===3.2 Seepage analysis of the conceptual model during a complete rising-drawdown process=== | ===3.2 Seepage analysis of the conceptual model during a complete rising-drawdown process=== | ||
| − | In the numerical model for the coupled analysis of the seepage-stress field, the left and bottom boundaries are | + | In the numerical model used for the coupled analysis of the seepage-stress field, the fundamental unit is a triangular element with a side length of 1 m. Since the numerical models have three distinct heights, as indicated in Table 3, the number of elements varies from 19,180 to 23,450. The left and bottom boundaries are treated as fixed boundaries. Throughout the entire model, the initial groundwater level is assumed to be 145m, and it will change according to RWL fluctuations. On the right boundary, a variable water level is applied to simulate the rise and drawdown of the RWL. The entire process of rising and drawdown is divided into five stages. These stages include: a stable RWL at 145 m, RWL rising from 145 m to 175 m, a stable RWL at 175 m, RWL falling from 175 m to 145 m, and finally, a stable RWL at 145 m. To reduce computation costs, the first and final stages each last for 10 days, while the third stage lasts for 30 days. The durations of the second and fourth stages are determined by the RWL fluctuation rate ''v'', as shown in Table 3. For instance, if ''v'' = 2 m/d, the second and fourth stages will each last for 15 days. |
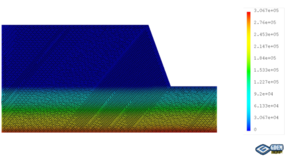
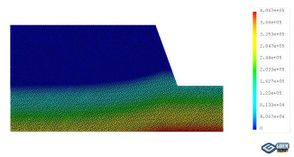
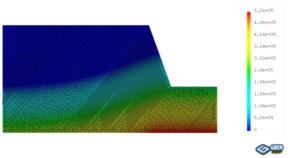
| − | The coupled analysis of the seepage-stress field is conducted using GDEM software. To facilitate the analysis, eight critical moments are selected: the moment when RWL is stable at 145 m, the moments when RWL rises to 155 m, 165 m, and 175 m, the moment when RWL is stable at 175 m, and the moments when RWL falls to 165 m, 155 m, and 145 m. The groundwater levels and the fracture water pressures at these critical moments are recorded for a detailed analysis and subsequent comparison. For example, in the case of ''t'' = 2 m, ''θ'' = 50<sup>o</sup>, ''v'' = 2 m/d, ''h'' = 70 m, and ''k'' = 1×10<sup>-4</sup> m/s, the groundwater levels and the fracture water pressures are shown in Figure 2, in which the unit of water pressures is kPa. | + | The coupled analysis of the seepage-stress field is conducted using GDEM software, and the calculation is terminated once that a default setting criteria that the non-balance ratio is less than 1×10<sup>-5</sup> is satisfied. To facilitate the analysis, eight critical moments are selected: the moment when RWL is stable at 145 m, the moments when RWL rises to 155 m, 165 m, and 175 m, the moment when RWL is stable at 175 m, and the moments when RWL falls to 165 m, 155 m, and 145 m. The groundwater levels and the fracture water pressures at these critical moments are recorded for a detailed analysis and subsequent comparison. For example, in the case of ''t'' = 2 m, ''θ'' = 50<sup>o</sup>, ''v'' = 2 m/d, ''h'' = 70 m, and ''k'' = 1×10<sup>-4</sup> m/s, the groundwater levels and the fracture water pressures are shown in Figure 2, in which the unit of water pressures is kPa. |
<div class="center" style="width: auto; margin-left: auto; margin-right: auto;"> | <div class="center" style="width: auto; margin-left: auto; margin-right: auto;"> | ||
| Line 561: | Line 561: | ||
===5.1 An improved cantilever beam limit equilibrium method for evaluating the stability of anti-dip rock slopes suffering reservoir water action=== | ===5.1 An improved cantilever beam limit equilibrium method for evaluating the stability of anti-dip rock slopes suffering reservoir water action=== | ||
| − | The study | + | Numerous studies have been conducted on the assessment method of anti-dip rock slope stability. In this study, the numerical analysis based on the strength reduction method is considered a feasible choice for evaluating stability. This is because all the numerical models for the coupled analysis of the seepage-stress field have been established in Section 3, and it has previously been employed by Azarafza et al. [51] for assessing the stability of a complex secondary toppling failure case. However, there are two issues that may arise when implementing the strength reduction method in the GDEM numerical models. The first issue is the unfavorable computation cost due to the coupled analysis of the seepage-stress field. The second issue is the absence of a reliable criterion for determining the FoS in discrete element method modeling [52]. Therefore, this study utilizes the cantilever limit equilibrium method proposed by Aydan et al. [14] to evaluate the stability of the anti-dip layered rock slope. |
| + | |||
| + | This cantilever limit equilibrium method [14] considers the toppling failure of the rock stratum as a result of the tensile stress induced by bending, using the calculation model as illustrated in Figure 8. The model begins by assuming a basal failure plane for the anti-dip layered rock slope, usually perpendicular to the strata and represented by the red line in Figure 8(a). The rock layers above the basal failure plane are numbered from bottom to top, and their equilibrium conditions are examined by treating them as individual cantilever beams. | ||
<div class="center" style="width: auto; margin-left: auto; margin-right: auto;"> | <div class="center" style="width: auto; margin-left: auto; margin-right: auto;"> | ||
| Line 609: | Line 611: | ||
| − | in which ''φ<sub>i</sub>''and ''C<sub>i</sub>'' are the friction angle and the cohesion of the joint between the ''i''-th and ''i+''1-th rock layers, respectively. Similarly, ''φ<sub>i−</sub>''<sub>1 </sub>and ''C<sub>i−</sub>''<sub>1</sub> are the friction angle and the cohesion of the joint between the ''i''-th and ''i−''1-th rock layers, respectively. It is important to note that the effect of cohesion was initially ignored [14], but this study introduces it based on the improvement by Lu et al. [ | + | in which ''φ<sub>i</sub>''and ''C<sub>i</sub>'' are the friction angle and the cohesion of the joint between the ''i''-th and ''i+''1-th rock layers, respectively. Similarly, ''φ<sub>i−</sub>''<sub>1 </sub>and ''C<sub>i−</sub>''<sub>1</sub> are the friction angle and the cohesion of the joint between the ''i''-th and ''i−''1-th rock layers, respectively. It is important to note that the effect of cohesion was initially ignored [14], but this study introduces it based on the improvement by Lu et al. [53]. The height of the acting position of ''P<sub>i</sub>''<sub>+1</sub> and ''T<sub>i</sub>''<sub>+1</sub> is ''x<sub>i</sub>'', and the height of the acting position of ''P<sub>i</sub>''<sub>−1</sub> and ''T<sub>i</sub>''<sub>−1</sub> is ''x<sub>i</sub>''<sub>−1</sub>, which can be formulated as |
{| class="formulaSCP" style="width: 100%; text-align: center;" | {| class="formulaSCP" style="width: 100%; text-align: center;" | ||
| Line 1,191: | Line 1,193: | ||
[44]Huang D., Gu D., Song Y., Cen D., Zeng, B. Towards a complete understanding of the triggering mechanism of a large reactivated landslide in the Three Gorges Reservoir. Engineering Geology, 238: 36-51, 2018. | [44]Huang D., Gu D., Song Y., Cen D., Zeng, B. Towards a complete understanding of the triggering mechanism of a large reactivated landslide in the Three Gorges Reservoir. Engineering Geology, 238: 36-51, 2018. | ||
| − | [45]Cai Y., Yasuhiro M., Tetsuro E. Numerical analysis of stability for an antidip stratified rock slope. Chinese Journal of Rock Mechanics and Engineering, 27(12): 2517-2522, 2008. | + | [45]Yin Y., Wang L., Zhao P., Zhang Z., Huang B., Wang X. Crashed failure mechanism & prevention of fractured high-steep slope in the Three Gorges Reservoir, China. Shuili Xuebao, 54(3): 379 -391, 2022 |
| + | |||
| + | [46]Cai Y., Yasuhiro M., Tetsuro E. Numerical analysis of stability for an antidip stratified rock slope. Chinese Journal of Rock Mechanics and Engineering, 27(12): 2517-2522, 2008. | ||
| + | |||
| + | [47]Huang Y., Deng H., Li J., Feng Y., Wang W., Qi Y. Shear mechanical properties and constitutive model of jointed rock mass under water-rock interaction. Chinese Journal of Rock Mechanics and Engineering, 42(3): 545-557, 2023. | ||
| + | |||
| + | [48]Zhu C., Wu P., Yao H., Zhu D. Split Test of Sandstone under Conditions of Cyclic Saturation-drying and Long-term Saturation. Water Resources and Power, 30(12): 58-61, 2012 | ||
| + | |||
| + | [49]Zhu D., He L. Study on the Influence of Groundwater on Landslide Stability in the Three Gorges Reservoir. Arabian Journal for Science and Engineering, 47:4211-4223, 2022 | ||
| + | |||
| + | [50]Ren Q., Zhao Y., Zhu X., Zhou Y., Jiang Y., Wang P., Zhang C. CDEM-based simulation of the 3D propagation of hydraulic fractures inheterogeneous Coalbed Methane reservoirs. Computers and Geotechnics, 152, 104992: 1-18, 2022 | ||
| − | [ | + | [51]Azarafza M., Bonab M. H., Akgun H. Numerical analysis and stability assessment of complex secondary toppling failures: a case study for the south pars special zone. Geomechanics and Engineering, 27(5): 481-495, 2021 |
| − | [ | + | [52]Jiang W., Tan Y., Yan J., Ouyang Y., Fu Z., Feng Q. A BP neural network-based micro particle parameters calibration and an energy criterion for the application of strength reduction method in MatDEM to evaluate 3D slope stability. REVISTA INTERNACIONAL DE METODOS NUMERICOS PARA CALCULO Y DISENO EN INGENIERIA, 39(1): 12-23, 2023 |
| − | [ | + | [53]Lu H., Liu Q., Chen C. Improvement of cantilever beam limit equilibrium model of counter-tilt rock slopes. Chinese Journal of Rock Mechanics and Engineering, 33(2): 577-584, 2012. |
Revision as of 03:50, 26 December 2023
Abstract:The fluctuation of water levels in large reservoirs has long been recognized as a critical external factor that affects the stability of bank slopes. However, there have been limited studies investigating the influence of reservoir water level (RWL) fluctuation on anti-dip layered rock slopes. In this study, we constructed a conceptual model by selecting the sandstone in the Three Gorges Reservoir Area (TRGA) as the strata and considering variations in strata thickness, strata dip angle, permeability coefficient, RWL fluctuation rate, and slope height. Through seepage-stress field coupled analysis, we obtained the seepage field and groundwater lines, and determined the factor of safety (FoS) using the improved cantilever beam limit equilibrium method. We then investigated the variations of the groundwater line and FoS throughout the entire process of RWL rising and drawdown. Our results indicate that the changes in groundwater levels in the slope clearly lag behind RWL fluctuations, with stability improving during the rising stage but deteriorating during the drawdown stage. Range analysis, using the maximum curvature (MaxCurve) of the groundwater level line as the reference, reveals that the permeability coefficient has the most significant impact on the lagging effect, followed by the fluctuation rate, thickness, and dip angle. Similarly, when considering the amplitude of variation in FoS during the entire process of RWL rising and drawdown as the reference, range analysis shows that the permeability coefficient has the greatest impact on stability variation, followed by the fluctuation rate, thickness, dip angle, and slope height.
Keywords: sensitivity analysis; water level fluctuation; anti-dip rock slope; factor of stability; seepage field; cantilever limit equilibrium model
1. Introduction
The deformation and stability of layered rock slopes pose a significant and ongoing challenge in the prevention and control of geological hazards. Layered rock slopes can be classified into two types based on the geometric relationship between the rock layers and the free surface: bedding rock slopes and anti-dip layered rock slopes. The latter is generally considered to be more stable than the former, as it is difficult to form a complete failure surface within anti-dip layered rock slopes. However, it is important to note that a considerable proportion of rock slope failures occur in anti-dip layered rock slopes. Statistical data from nearly 100 landslides in China reveals that 33% of the landslides occurred in anti-dip layered rock slopes [1]. Over the past two decades, numerous incidents of anti-dip layered rock slope failures have been reported worldwide [2-6], some of which have resulted in catastrophic consequences.
Research on anti-dip layered rock slopes began in the 1950s, and the systematic study of deformation characteristics and failure modes was first initiated by Goodman and Bray [7]. Toppling is recognized as the most common form of failure in anti-dip layered rock slopes. The mechanisms of toppling failures are generally classified into three types: flexural, blocky, and blocky-flexural toppling. Various physical simulation tests and numerical simulations have been conducted to clarify the forming process and development mechanism for different types of toppling failure [8-13]. Additionally, significant efforts have been made to explore stability evaluation methods and treatment measures for anti-dip layered rock slopes [14-21]. However, it has been verified that toppling deformation has a sophisticated mechanical mechanism and the stability of anti-dip layered rock slopes is influenced by various internal and external factors, such as lithological characters, geometrical parameters, earthquakes, rainfalls, and so on [22-25]. A more comprehensive understanding of the major factors affecting stability is crucial for the prevention and treatment of toppling failure [26].
For bank slopes located in large reservoirs, the presence of reservoir water is a crucial factor to consider. Numerous studies have investigated the impact of water on the stability of bank slopes, including the effects of saturated or unsaturated seepage force [27-30], changes in groundwater level [31-32], and the degradation of rock mass caused by water [33-38]. In particular, extensive research has been conducted on the complex influence of reservoir water level fluctuation during the normal operation of the reservoir to enhance our understanding of bank slope stability [39-43]. However, there have been relatively few studies investigating the influence of reservoir water level fluctuation on anti-dip layered rock slopes [44]. Additionally, the sensitivity of the stability anti-dip layered rock slopes under fluctuating reservoir water levels on impact factors have yet to be confirmed [26].
This study aims to determine the sensitivity of impact factors on the stability of anti-dip layered rock slopes under fluctuating reservoir water levels. Firstly, a conceptual model of an anti-dip rock slope is constructed using representative strata from the Three Gorges Reservoir area (TRGA). The physical and mechanical parameters of the rock and joints are determined based on existing research. The main factors considered in the model are the thickness and dip angle of the strata, the permeability of the strata, the fluctuation rate of the reservoir water level (RWL), and the height of the slope. Different levels of these factors are incorporated into the orthogonal experiment design. The seepage force on the slope model and the groundwater level variation with RWL fluctuation are obtained through seepage-stress field coupled analysis using the Graphic Processing Unit accelerated continuous-based Discrete Element Method (GDEM) software. The software combines continuum and discontinuum techniques and incorporates a dual-medium seepage model for pores and fractures. The stability of the slope model under RWL fluctuation is evaluated by improving the cantilever beam limit equilibrium method, considering the reservoir water pressure on the slope surface and the interlayer water pressure between the layers. Finally, the factors are ranked based on range analysis to determine their influences on the stability variation of the anti-dip layered rock slope model throughout a complete reservoir water filling-drawdown cycle.
2. A conceptual model for the anti-dip rock slopes and the orthogonal experiment design
2.1 Brief description of the conceptual model for the anti-dip rock slopes in the TRGA
Anti-dip rock slopes are commonly found in the TRGA. One of the typical failure modes of high steep bank slopes in this area, as identified by Yin et al. [45], is the toppling failure of anti-dip rock slopes. An example of such a failure is the Gongjiafang landslide with the volume of about 500,000 m3, which occurred on 23 November 2008 and resulted in a surge wave of 31.8 m in the Wu Gorge. The mechanism behind the Gongjiafang landslide failure has been studied by Gu and Huang [4], and the issue of landslide-generated waves has been a significant topic of discussion since then.
The lithologies and slope structures of anti-dip rock slopes vary in TRGA. To comprehend the key factors influencing their stability, this study proposes a conceptual model based on the representative characteristics of these slopes. Rather than analyzing a specific example, the model offers a comprehensive understanding of anti-dip rock slopes, as depicted in Figure 1.
The conceptual model has a length of 140 m, with the reservoir water located on the right side of the model. The impoundment of the Three Gorges reservoir began in June 2003 and was completed in October 2010. Currently, on a hydrological year basis (October-September), the RWL fluctuates between 145 m during the wet season (May-September) for flood control and 175 m during the dry season (October-May) for hydropower generation. This creates a 30m height fluctuation zone for the RWL, as shown in Figure 1. The model includes a 30m height region below 145 m to account for the differences in physical and mechanical properties between rocks in the RWL fluctuation affected zone and the long term inundation zone.
In the conceptual model, the rock mass is defined as sandstone. Sandstone makes up a significant portion of the Jurassic and Triassic sedimentary clastic rocks, which are commonly found in the anti-dip rock slopes in the TRGA. Previous studies have extensively examined the variations in the physical and mechanical properties of sandstone under cyclic wet-dry conditions, yielding abundant data for selecting different parameters to accurately depict the impact of the environment on the properties of the sandstone [37-38].
In the conceptual model, the variables include the strata thickness t, the strata dip angle θ, the permeability coefficient k, the RWL fluctuation rate v and the slope height h. Although the slope angle is an important variable in the stability analysis of anti-dip rock slopes, the model assumes a constant slope angle of 70°. Previous researches have extensively studied the effect of slope angle on the stability of anti-dip rock slopes [46]. It has been found that when the slope angle is less than 70°, the anti-dip rock slopes composed of hard rock has a relatively low instability risk. Besides that, the stability variation of a rock slope under fluctuating RWL conditions can be attributed to seepage, which is usually less influenced by the slope angle compared to other factors.
2.2 Physical and mechanical parameters of sandstone and its joint plane
According to the different environments in which the rock mass is located, the conceptual model divides it into three zones from the base to the top: the long-term inundation zone, the RWL fluctuation affected zone, and the top zone. In the top zone, the water-rock interaction has little effect on the rock mass, so the parameters of sandstone and its joints can be considered normal. However, in the long-term inundation zone, where there is continuous immersion, and in the RWL fluctuation affected zone, where there are periodic wet-dry cycles, the irreversible progressive deteriorations in the physical and mechanical parameters of the rock mass are likely to occur. This indicates that the rock mass in these two zones should have degenerate parameters.
Previous researchers have extensively studied the deterioration laws of sandstone under these two water-rock interaction conditions [37-38]. The deterioration is usually steep in the beginning and then slows down, eventually reaching a point where the water immersion time or the number of wet-dry cycles no longer cause further deterioration. Recently, the wet-dry cycle experiments have been performed to obtain the shear mechanical properties of jointed rock masses under water-rock interaction [47]. It is verified that the degradation range of shear strength parameters caused by the first six water-rock interaction cycles accounted for approximately 90% of the total range. Given that more than 13 years have passed since the Three Gorges reservoir entered its normal operation stage, it is assumed that the deterioration of the physical and mechanical parameters of the rock mass has already been completed in this study. Consequently, the parameters of sandstone and its joints are assigned values based on previous studies [37-38, 47], which are provided in Table 1 and Table 2. The sandstone and joints in the RWL fluctuation affected zone exhibit higher parameters compared to those in the long-term inundation zone, which aligns with the findings of Zhu et al. [48]. Zhu et al. [48] conducted Brazil splitting tests on sandstone under wet-dry cycling and long-term saturation conditions. The results showed that the reduction in sandstone tensile strength was more significant in the wet-dry cycling condition than in the long-term saturation condition. This can be attributed to the expansion and contraction of mineral grains and cements during wet-dry cycles, which leads to a greater deterioration of cementation and friction between grains.
| Zone | Heavy
γ/(kN·m-3) |
Elastic-modulus
E/(GPa) |
Poisson ratio
μ |
Cohesion
C/(MPa) |
Friction angle
φ/(o) |
Tensile strength
σt/(MPa) |
| The top zone | 26.0 | 17.0 | 0.25 | 14.5 | 38 | 3.5 |
| The RWL fluctuation affected zone | 21.0 | 8.0 | 0.28 | 10.0 | 33 | 2.4 |
| The long term inundation zone | 22.5 | 10.0 | 0.27 | 11.4 | 34 | 2.7 |
| Zone | Cohesion
C/(MPa) |
Friction angle
φ/(o) |
| The top zone | 0.50 | 27 |
| The RWL fluctuation affected zone | 0.34 | 25 |
| The long term inundation zone | 0.39 | 26 |
2.3. The Level values of variables for the subsequent orthogonal experiment
The orthogonal experiment is a widely used method for studying the impact of multiple factors on a particular problem. As discussed in Section 2.1, the conceptual model in this study includes five variables: strata thickness t, strata dip angle θ, permeability coefficient k, RWL fluctuation rate v, and slope height h. Table 3 presents the three levels for t, θ, v, and h, and the two levels for k. Reasons for setting these level values are explained as follows.
| Levels | Factors | ||||
| Strata thickness
t(m) |
Strata dip angle
θ(o) |
RWL fluctuation rate
v(m/d) |
Permeability coefficient
k(m/s) |
Slope height
h(m) | |
| 1 | 1 | 50 | 1 | 1×10⁻⁴ | 70 |
| 2 | 2 | 60 | 2 | 1×10⁻⁵ | 80 |
| 3 | 3 | 70 | 3 | / | 90 |
Above all, the thickness of the strata has a significant influence on the seepage field in anti-dip layered rock slopes, assuming a constant permeability and fluctuation rate. However, this influence is minimal when the thickness is small. It is worth noting that excessively small thickness will result in increased complexity in the subsequent numerical model and higher computational costs. Therefore, for the purpose of this study, only anti-dip rock slopes with thick layers are considered. The minimum thickness is assumed to be 1m, and the thickness increases by 1m in each level.
Secondly, the minimum assumed strata dip angle is 50° according to previous research. In practice, a rock slope is considered a gentle dipping slope if the dip angle is less than 20° and a steep dipping slope if the dip angle is greater than 45°. It has been verified in previous studies that toppling failure is more likely to occur in steep dipping slopes [46]. Therefore, the three levels for the strata dip angle are set as 50°, 60°, and 70°.
Next, the fluctuation rate of RWL is determined by analyzing the data of RWL change in the TGRA from September 1, 2011 to September 1, 2014. The maximum rate of increase during this period was 3.21 m/d, while the maximum rate of decrease was 2.79 m/d. To simplify the analysis, the maximum value of RWL fluctuation rate is set at 3 m/d in this study, with the rate decreasing by 1 m/d in each subsequent level.
Then, following the study by Zhu and He [49], slopes are categorized into three types based on their permeability coefficients: strong permeability (k ⩾ 1×10⁻⁴ m/s), moderate permeability (1×10⁻⁵ m/s < k < 1×10⁻⁴ m/s), and weak permeability (k ⩽ 1×10⁻⁵ m/s). In this study, two threshold values were chosen to represent the two levels in Table 3, allowing for a better understanding of how permeability affects the seepage field in anti-dip layered rock slopes.
Finally, the three levels for the slope height are set at 70 m, 80 m, and 90 m, resulting in the slope crest being located at 10 m, 20 m, and 30 m above 175 m, which is the highest RWL. In comparison to the practical bank slopes in TRGA, the slope height is set at a lower level. This decision was made because in this study, the seepage field and groundwater level are obtained through the coupled analysis of the seepage-stress field. Setting a larger value for the slope height would result in excessive calculation workload.
3. The seepage field during a complete rising and drawdown process of RWL
3.1 Brief introduction of GDEM software
GDEM software, developed by Beijing Ji-Dao-Cheng-ran Technology Co., ltd. and the Institute of Mechanics, Chinese Academy of Sciences, utilizes the continuum-based discrete element method (CDEM) as its core algorithm. By combining the advantages of discrete elements and finite elements, CDEM can analyze the progressive failure of materials by considering the fracture of block boundaries and block interiors. This allows it to simulate the entire process from continuous deformation to crack generation and propagation. GDEM utilizes graphics processing unit (GPU) technology to enhance its calculation capabilities.
GDEM incorporates a dual-medium seepage model for both pores and fractures, making it suitable for conducting seepage-stress field coupled analysis in fractured rock slopes. This model divides the fractured rock mass into two systems: the rock block pore system and the fracture system. It establishes separate water kinematical equations for the pore and fracture systems based on the Darcy law and the cubic law, respectively, and combines them using a water exchange equation. The fluid flow in the fracture exerts fluid pressure on the rock blocks on either side, causing the adjacent rock blocks to open and close under the influence of fluid pressure and external load. The change in relative displacement between two rock blocks affects the opening of the fracture, which in turn leads to a change in fluid pressure. For more detailed information, please refer to the work of Ren et al [50]. While the primary focus of this study is on the seepage field, it is important to conduct a coupled analysis of the seepage-stress field. This is because the opening of fractures in the anti-dip rock slopes is bound to have an impact on seepage.
3.2 Seepage analysis of the conceptual model during a complete rising-drawdown process
In the numerical model used for the coupled analysis of the seepage-stress field, the fundamental unit is a triangular element with a side length of 1 m. Since the numerical models have three distinct heights, as indicated in Table 3, the number of elements varies from 19,180 to 23,450. The left and bottom boundaries are treated as fixed boundaries. Throughout the entire model, the initial groundwater level is assumed to be 145m, and it will change according to RWL fluctuations. On the right boundary, a variable water level is applied to simulate the rise and drawdown of the RWL. The entire process of rising and drawdown is divided into five stages. These stages include: a stable RWL at 145 m, RWL rising from 145 m to 175 m, a stable RWL at 175 m, RWL falling from 175 m to 145 m, and finally, a stable RWL at 145 m. To reduce computation costs, the first and final stages each last for 10 days, while the third stage lasts for 30 days. The durations of the second and fourth stages are determined by the RWL fluctuation rate v, as shown in Table 3. For instance, if v = 2 m/d, the second and fourth stages will each last for 15 days.
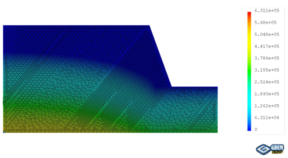
The coupled analysis of the seepage-stress field is conducted using GDEM software, and the calculation is terminated once that a default setting criteria that the non-balance ratio is less than 1×10⁻⁵ is satisfied. To facilitate the analysis, eight critical moments are selected: the moment when RWL is stable at 145 m, the moments when RWL rises to 155 m, 165 m, and 175 m, the moment when RWL is stable at 175 m, and the moments when RWL falls to 165 m, 155 m, and 145 m. The groundwater levels and the fracture water pressures at these critical moments are recorded for a detailed analysis and subsequent comparison. For example, in the case of t = 2 m, θ = 50o, v = 2 m/d, h = 70 m, and k = 1×10⁻⁴ m/s, the groundwater levels and the fracture water pressures are shown in Figure 2, in which the unit of water pressures is kPa.
The variation of groundwater level in the model is closely linked to the rise and drawdown of RWL. It increases as RWL rises and decreases as RWL falls. However, the rise and drawdown of groundwater always lag behind RWL. This results in the groundwater level inside the model being lower than RWL during the rising stage and higher than RWL during the drawdown stage. Furthermore, the gap between the groundwater level and RWL widens as we move from the slope surface to the deeper region. Therefore, the variation pattern of groundwater level under RWL rise and drawdown is similar to existing findings on landslides in TRGA [32], even though this study focuses on anti-dip rock slopes and the seepage field is obtained through a coupled analysis of the seepage-stress field.
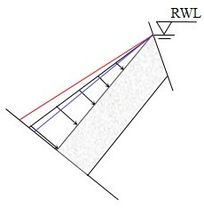
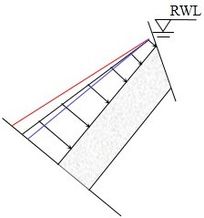
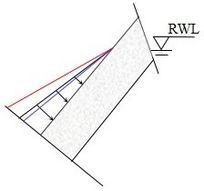
The pressures exerted by fracture water on rock layers are important for assessing the stability of anti-dip rock slopes during RWL fluctuation. The distribution of fracture water pressures between adjacent rock layers can be classified into three cases. Figure 3 depicts these three cases on the surface of the rock layer beneath the fracture, and all of them can be represented mathematically using linear equations derived from data analysis.
The first case occurs when the top point of the free surface is exactly at the RWL. The second case occurs when the top point is located below the RWL, while the third case occurs when the top point is located above the RWL. In the second case, the fracture water pressure at the top point is determined by the gap between its location and the RWL. In the third case, the range where no fracture water pressure applies is determined by the groundwater level line. Fracture water pressure shows an increasing trend from the free surface end to the fixed end. The rate of increase in fracture water pressure varies at different stages. Figure 3 illustrates this variation, with the red line representing the increasing trend during the drawdown stage, the black line representing the steady stage, and the blue line representing the rising stage. It is evident that the fracture water pressure exhibits the highest rate of increase during the RWL drawdown stage, followed by a normal rate of increase during the RWL steady stage, and the lowest rate of increase during the RWL rising stage. This study does not explore any statistical law for the distribution of fracture water pressures, as it is difficult to formulate. In the subsequent stability analysis, fracture water pressures will be considered as a type of interlayer load, with their values directly extracted from the seepage analysis.
4. Impact factor analysis of the lagging effect of groundwater level response to RWL
The significance of the lagging effect of groundwater level response to RWL in the stability evolution of slopes under RWL fluctuation conditions has been validated in previous researches [31-32]. Based on comparison on the groundwater levels results, the lagging effect is found to be mainly influenced by t, θ, k, and v. No difference can be observed when the slope height h varies, which may be caused by the fact that three levels of the slope height h have a relative small gap in this study. In order to gain a better understanding of how the lagging effect is influenced by t, θ, k, and v, impact factor analysis is performed in this section. First, a univariate analysis is conducted for each of these factors individually. Subsequently, the maximum value of the curvature of the groundwater level line in the model, are proposed to measure the lagging effect. Through range analysis, these factors are ranked to determine their respective influences on the lagging effect.
4.1 Univariate analysis for evaluating the influence of factors on the lagging effect
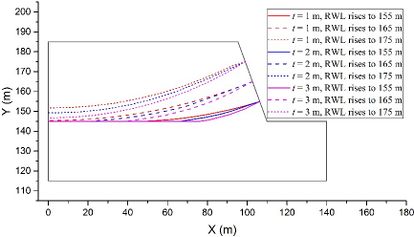
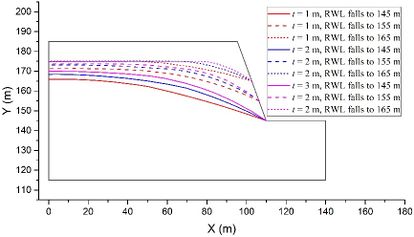
To begin with, the influence of the strata thickness t on the lagging effect is investigated. Models with constant values of θ = 50o, v = 2 m/d, h = 70 m, and k = 1×10⁻⁴ m/s are used as examples. Figure 4 illustrates the groundwater levels at different moments when the RWL rises to 155 m, 165 m, and 175 m, and falls to 165 m, 155 m, and 145 m. Only the groundwater level lines are plotted in the figure for clarity. In the rising stage (Figure 4(a)), it can be observed that a larger thickness t results in a bigger gap between the RWL and the groundwater level on the left, and also leads to a more distinct curve in the groundwater level near the slope surface. Similarly, in the drawdown stage (Figure 4(b)), the thickness t has a similar effect on the groundwater level. Therefore, a larger thickness t induces a more significant lagging effect. This can be attributed to the fact that an increase in t indicates a decrease in fractures between rock layers, resulting in a slower rate of permeation and exudation of water during RWL fluctuation.
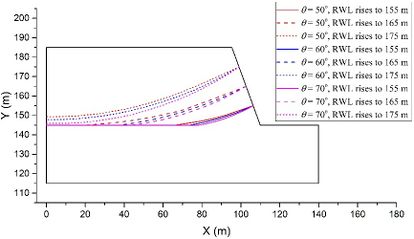
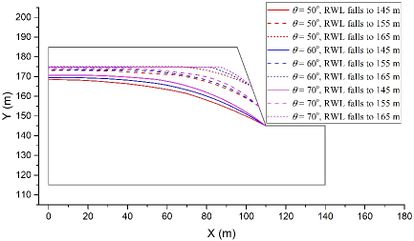
Next, the influence of the strata dip angle θ is investigated using models with constant values of t = 2 m, v = 2 m/d, h = 70 m, and k = 1×10⁻⁴ m/s as examples. Figure 5 illustrates the groundwater levels at the same six moments as shown in Figure 4. In the rising stage (Figure 5(a)) and the drawdown stage (Figure 5(b)), a larger dip angle θ leads to a greater difference between the RWL and the groundwater level on the left side, as well as a more pronounced curve in the groundwater level near the slope surface. Therefore, a larger dip angle θ results in a more significant lagging effect. This can be attributed to the dominant pathway for water entering and exiting the slopes, which are fractures between rock layers. As the dip angle θ increases, it becomes more challenging for water to enter and exit the left region of the model.
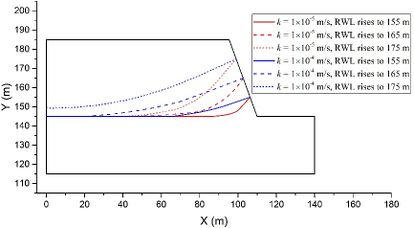
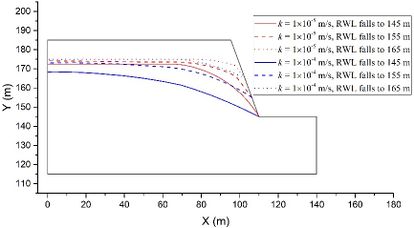
Then, the influence of the permeability coefficient k is evaluated using models with constant values of θ = 50o, t = 2 m, h = 70 m, and v = 2 m/d as examples. Figure 6 illustrates the groundwater levels under two different k settings. It is evident that a smaller permeability coefficient k leads to a more pronounced lagging effect. This observation is akin to the impact of permeability coefficient k on the lagging effect in soil slopes [29].
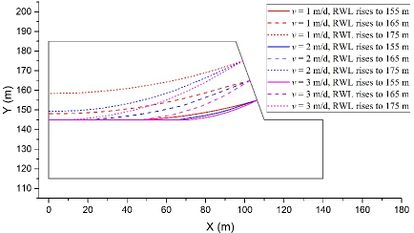
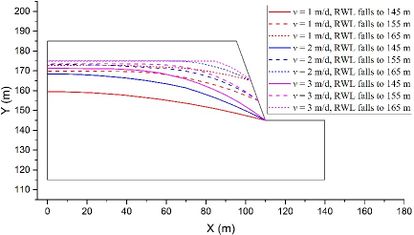
Last, the influence of the RWL fluctuation rate v is evaluated using models with constant values of θ = 50o, t = 2 m, h = 70 m, and k = 1×10⁻⁴ m/s as examples. Figure 7 illustrates the groundwater levels under three different v settings. It is evident that a higher RWL fluctuation rate v leads to a more pronounced lagging effect. This observation aligns with the existing conclusions regarding the impact of the RWL fluctuation rate v on the groundwater level in slopes located in TRGA [32].
4.2 Range analysis for ranking the influence of factors on the lagging effect
Evaluation of the relative influence of various factors on the lagging effect is crucial for understanding the stability of anti-dip rock slopes under RWL fluctuation. In order to achieve this, an indicator called MaxCurve is proposed to measure the lagging effect. This indicator quantifies the maximum curvature of the groundwater level line in the model. A larger MaxCurve value indicates a more severe lagging effect.
In views that the lagging effect is most significant when the RWL rises to 175 m and falls to 145 m, the MaxCurve values at these two key moments are extracted and range analysis is conducted to rank the influence of different factors. Since only two levels are chosen for the permeability coefficient k, the pseudo-horizontal method is used for range analysis. This approach results in nine combinations of different levels for the thickness t, dip angle θ, permeability coefficient k, and fluctuation rate v, which are presented in Table 4. Furthermore, Table 4 also includes the results of MaxCurve at the two key moments.
| No. | Levels | MaxCurve when RWL rises to 175 m | MaxCurve when RWL falls to 145 m | |||
| t | θ | v | k | |||
| 1 | 1 | 1 | 1 | 1 | 0.00298 | 0.00206 |
| 2 | 3 | 2 | 2 | 1 | 0.00402 | 0.00442 |
| 3 | 2 | 3 | 3 | 1 | 0.00431 | 0.00562 |
| 4 | 3 | 3 | 1 | 2 | 0.00582 | 0.00672 |
| 5 | 2 | 1 | 2 | 2 | 0.00641 | 0.00651 |
| 6 | 1 | 2 | 3 | 2 | 0.00678 | 0.00694 |
| 7 | 2 | 2 | 1 | 1 | 0.00311 | 0.00236 |
| 8 | 1 | 3 | 2 | 1 | 0.00381 | 0.00372 |
| 9 | 3 | 1 | 3 | 1 | 0.00423 | 0.0056 |
The process and results of range analysis are presented in Table 5. According to the values of R, the permeability coefficient k has the greatest impact on the lagging effect, followed by the fluctuation rate v, the thickness t, and the dip angle θ. This ranking is valid at both moments when the RWL rises to 175 m and falls to 145 m. However, there are differences between the two moments. When the RWL rises to 175 m, the influences of t and θ on the lagging effect are relatively insignificant compared to k, and the R value of v is much lower than that of k. On the other hand, when the RWL falls to 145 m, the influences of t and θ increase significantly and cannot be ignored, and the R value of v is similar to that of k.
| Parameters | MaxCurve when RWL rises to 175 m | MaxCurve when RWL falls to 145 m | ||||||
| t | θ | v | k | t | θ | v | k | |
| K1 | 0.01357 | 0.01362 | 0.01191 | 0.02246 | 0.01272 | 0.01417 | 0.01114 | 0.02378 |
| K2 | 0.01383 | 0.01391 | 0.01424 | 0.01901 | 0.01449 | 0.01372 | 0.01465 | 0.02017 |
| K3 | 0.01407 | 0.01394 | 0.01532 | 0.01674 | 0.01606 | 0.01816 | ||
| k1 | 0.00452 | 0.00454 | 0.00397 | 0.00374 | 0.00424 | 0.00472 | 0.00371 | 0.00396 |
| k2 | 0.00461 | 0.00464 | 0.00475 | 0.00634 | 0.00483 | 0.00457 | 0.00488 | 0.00672 |
| k3 | 0.00469 | 0.00465 | 0.00511 | 0.00558 | 0.00535 | 0.00605 | ||
| R | 0.00017 | 0.00011 | 0.00114 | 0.00260 | 0.00134 | 0.00078 | 0.00234 | 0.00276 |
5. Stability variation of the conceptual model during a complete rising-drawdown process and its impact factors
5.1 An improved cantilever beam limit equilibrium method for evaluating the stability of anti-dip rock slopes suffering reservoir water action
Numerous studies have been conducted on the assessment method of anti-dip rock slope stability. In this study, the numerical analysis based on the strength reduction method is considered a feasible choice for evaluating stability. This is because all the numerical models for the coupled analysis of the seepage-stress field have been established in Section 3, and it has previously been employed by Azarafza et al. [51] for assessing the stability of a complex secondary toppling failure case. However, there are two issues that may arise when implementing the strength reduction method in the GDEM numerical models. The first issue is the unfavorable computation cost due to the coupled analysis of the seepage-stress field. The second issue is the absence of a reliable criterion for determining the FoS in discrete element method modeling [52]. Therefore, this study utilizes the cantilever limit equilibrium method proposed by Aydan et al. [14] to evaluate the stability of the anti-dip layered rock slope.
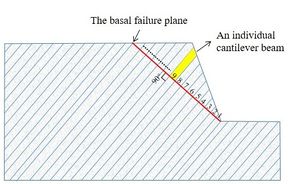
This cantilever limit equilibrium method [14] considers the toppling failure of the rock stratum as a result of the tensile stress induced by bending, using the calculation model as illustrated in Figure 8. The model begins by assuming a basal failure plane for the anti-dip layered rock slope, usually perpendicular to the strata and represented by the red line in Figure 8(a). The rock layers above the basal failure plane are numbered from bottom to top, and their equilibrium conditions are examined by treating them as individual cantilever beams.
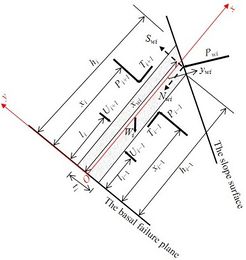
As shown in Figure 8(b), the thickness and dip angle above the basal failure plane are represented as ti and θ for the i-th rock layer, respectively. The upper and lower boundaries of this rock layer have the heights hi and hi−1, respectively. The forces in the model include the weight Wi, the extrusion force Pi+1 and the friction force Ti+1 resulting from the interaction with the i+1-th layer, the extrusion force Pi−1 and the friction force Ti−1 resulting from the interaction with the i-1-th layer, the forces Ui+1 and Ui−1 caused by the fracture water pressures between rock layers, and the force Pwi on the free surface of the rock layer caused by the reservoir water pressure. It is important to note that the original model [14] does not consider the reservoir water pressure on the slope surface.
The calculation model simplifies all forces as concentrated forces for simplified computation. The weight Wi, which acts on the center of the rock layer, can be computed as
|
(1) |
in which γidenotes the unit weight for the rock layer.
The values of friction forces Ti+1 and Ti−1 are determined based on the values of extrusion forces Pi+1 and Pi−1, respectively, that is
|
|
(2) |
in which φiand Ci are the friction angle and the cohesion of the joint between the i-th and i+1-th rock layers, respectively. Similarly, φi−1 and Ci−1 are the friction angle and the cohesion of the joint between the i-th and i−1-th rock layers, respectively. It is important to note that the effect of cohesion was initially ignored [14], but this study introduces it based on the improvement by Lu et al. [53]. The height of the acting position of Pi+1 and Ti+1 is xi, and the height of the acting position of Pi−1 and Ti−1 is xi−1, which can be formulated as
|
|
(3) |
The parameter χ is determined by the distribution of extrusion force between rock layers. In this study, the extrusion between rock layers is considered to be uniformly distributed, resulting in χ = 0.5.
The forces Ui+1 and Ui−1, resulting from the fracture water pressures between rock layers, are derived from the numerical simulation results and subsequently simplified as point forces. The heights at which Ui+1 and Ui−1 act are represented by li and li−1, respectively.
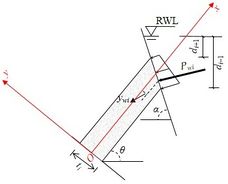
The pressure of the reservoir water induces a force, Pwi, on the free surface of the rock layer. This force is simplified as a point force and its value and position depend on the depth of submergence of the free surface. Let γw denote the unit weight of water. When the free surface is completely submerged, as shown in Figure 9(a), the top point of the free surface experiences a water pressure of γwdi+1, while the bottom point experiences a water pressure of γwdi−1. Consequently, Pwi can be computed as
|
(4) |
where α and θ are the slope angle and the dip angle of the rock layer, respectively. And, the acting position of Pwi is located at
|
|
(5) |
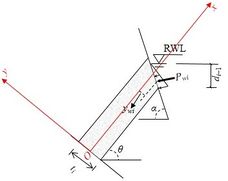
Figure 9(b) illustrates a scenario where the free surface is partially submerged and the rock layer experiences water pressure γwdi−1 at the lowest point of the free surface. In this situation, Pwi can be computed as
|
(6) |
and its acting position is located at
|
|
(7) |
In the local framework represented by red lines in Figure 8(b), the force Pwi is acting at the position (xwi, -ywi). The force Pwi can be further decomposed into Nwi along the x direction and Swi along the y direction.
The rock layer is considered as an individual cantilever beam experiencing the forces shown in Figure 8(a). Assuming the plain strain state, the tensile stress σx at a point located y distance from the neutral axis of the beam can be calculated as
|
(8) |
in which N represents the axial force, M is the bending moment, A is the sectional area, and I denotes the moment of inertia. The limit equilibrium method assumes that rock layers above the basal failure surface reach their limit state simultaneously. If the i-th rock layer reaches its limit state, the tensile stress σx at y = 0.5ti will be equal to the tensile strength σt. Given a value for the FoS, the following computation is performed to determine the extrusion force Pi−1.
|
(9) |
where
|
(10) |
|
(11) |
|
(12) |
|
(13) |
|
(14) |
|
(15) |
and
|
(16) |
The cantilever limit equilibrium method is used to solve the FoS for anti-dip layered rock slopes in a step-by-step manner, starting from the uppermost rock layer numbered n, which is unstable under its own weight and water pressures. The criteria for slope stability are as follows:
|
|
(17) |
5.2 The stability of the conceptual model during a complete rising-drawdown process
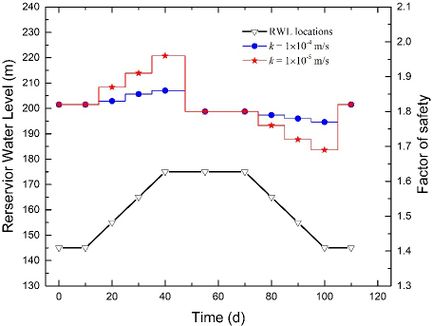
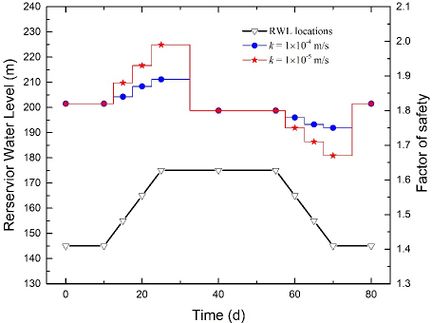
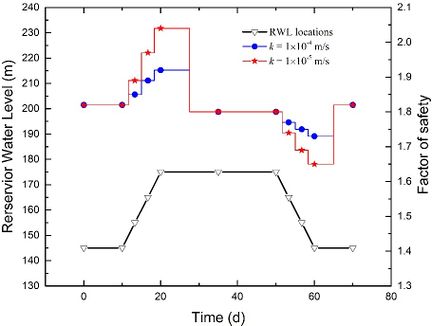
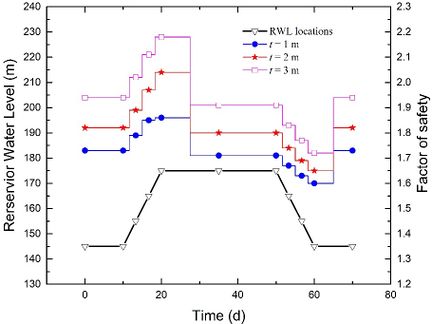
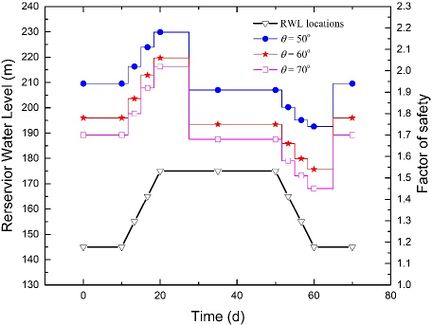
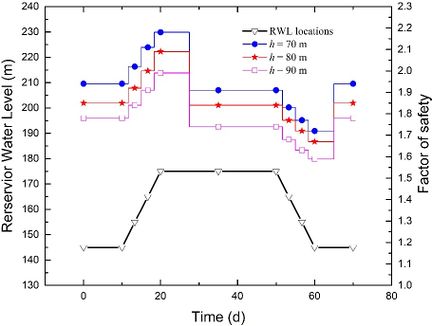
The conceptual model's FoS is analyzed at eight critical moments in Section 3.2 using the improved cantilever beam limit equilibrium method. This approach provides a comprehensive understanding of stability variations during the entire process of rising and drawdown of the RWL. In the rising stage, the FoS consistently increases and reaches its maximum value when the RWL reaches 175 m. Subsequently, the FoS stabilizes at a certain value when the RWL remains stable at 175 m for a sufficient duration. During the drawdown stage, the FoS decreases and reaches its minimum value when the RWL falls to 145 m. Eventually, the FoS grows to a stable value when the RWL remains stable at 145 m for a sufficient duration. Generally, the FoS is higher when the RWL is stable at 145 m compared to when it is stable at 175 m. This common variation pattern in the stability of anti-dip layered rock slopes holds true regardless of the changes of the permeability coefficient k, fluctuation rate v, thickness t, dip angle θ, and slope height h. This is demonstrated in Figure 10, Figure 11, Figure 12, and Figure 13.
To investigate the impact of the permeability coefficient k and fluctuation rate v on stability, we plotted stability evolutions during a complete rising-drawdown process in Fig. 10. The parameters used were t = 2 m, θ = 50°, and h = 70 m. We separately depicted stability evolutions for v = 1 m/d, v = 2 m/d, and v = 3 m/d in Fig. 10(a), Fig. 10(b), and Fig. 10(c), respectively. When the fluctuation rate v is kept constant, we observed that the FoS increases more significantly during the rising stage and decreases more significantly during the drawdown stage when the permeability coefficient k is smaller. Similarly, when the permeability coefficient k is constant, the FoS increases more significantly during the rising stage and decreases more significantly during the drawdown stage when the fluctuation rate v is greater. Moreover, when the RWL stabilizes at either 145 m or 175 m, the FoS values exhibit no difference. This suggests that the influence of the seepage field on the stability of the conceptual model diminishes once the RWL remains stable at a certain level for a sufficient duration.
Fig. 11 illustrates the stability evolutions during a complete rising-drawdown process for θ = 50o, v = 3 m/d, k = 1×10⁻⁵ m/s, and h = 70m. It is observed that when the RWL remains stable at either 145 m or 175 m, a larger strata thickness t generally results in a higher value of FoS. Moreover, as the strata thickness t increases, the increase in FoS during the rising stage and the decrease in FoS during the drawdown stage become more pronounced. This suggests that the difference in FoS between t = 1 m and t = 3 m is amplified during the rising stage, while it is reduced during the drawdown stage.
Figure 12 illustrates the stability evolutions throughout a complete rising-drawdown process with specific parameters: t = 3 m, v = 3 m/d, k = 1×10⁻⁵ m/s and h = 70m. The observations reveal that when the RWL remains stable at either 145 m or 175 m, a larger dip angle θ generally results in a lower value of FoS. Additionally, as the strata dip angle θ increases, the increase in FoS during the rising stage and the decrease in FoS during the drawdown stage become more pronounced. This implies that the difference in FoS between θ = 50o and θ = 70o is reduced during the rising stage, but amplified during the drawdown stage.
In Figure 13, the stability evolutions during a complete rising-drawdown process are illustrated for the following parameters: θ = 50o, t = 3 m, v = 3 m/d and k = 1×10⁻⁵ m/s. It can be observed that when the RWL remains stable at either 145 m or 175 m, a higher slope height h generally leads to a smaller value of FoS. As the slope height h decreases, the increase in FoS during the rising stage and the decrease in FoS during the drawdown stage become more noticeable. The difference in FoS between h = 70 m and h = 90 m is slightly amplified during the rising stage, while it is slightly reduced during the drawdown stage.
5.3 Range analysis for ranking the influence of factors on the stability variation
Based on the investigation of different factors on stability in Section 5.2, we can gain insight into the conditions that lead to better stability in anti-dip layered rock slopes. However, it is important to note that the stability can vary significantly during a complete rising and drawdown process of RWL, which requires careful control and prevention measures. In other words, the greater the stability variation, the more attention should be given to the impact of RWL fluctuations on the stability. Therefore, it is necessary to assess the relative influence of different factors on stability variation.
The amplitude of variation in FoS, which measures the difference between the maximum and minimum values of the FoS during a complete RWL rising and drawdown process, is employed to indicate the level of stability variation. Range analysis is performed to rank the impact of different factors. Likewise, the pseudo-horizontal method is utilized for range analysis, considering that only two levels are selected for the permeability coefficient k. This results in 16 combinations of different levels for the thickness t, dip angle θ, fluctuation rate v, permeability coefficient k, and slope height h, as shown in Table 6. Furthermore, the outcomes of the amplitude of variation in FoS are presented in Table 6.
| No. | Levels | Amplitude of variation in FoS | ||||
| t | θ | v | k | h | ||
| 1 | 1 | 1 | 1 | 1 | 1 | 0.079 |
| 2 | 2 | 2 | 2 | 1 | 2 | 0.146 |
| 3 | 3 | 3 | 3 | 1 | 3 | 0.212 |
| 4 | 3 | 1 | 3 | 1 | 1 | 0.201 |
| 5 | 2 | 3 | 1 | 2 | 1 | 0.435 |
| 6 | 1 | 1 | 2 | 2 | 3 | 0.454 |
| 7 | 3 | 1 | 3 | 2 | 2 | 0.514 |
| 8 | 3 | 2 | 3 | 2 | 1 | 0.542 |
| 9 | 3 | 1 | 1 | 1 | 2 | 0.099 |
| 10 | 3 | 3 | 2 | 1 | 1 | 0.162 |
| 11 | 1 | 2 | 3 | 1 | 1 | 0.185 |
| 12 | 2 | 1 | 3 | 1 | 3 | 0.188 |
| 13 | 3 | 2 | 1 | 1 | 3 | 0.105 |
| 14 | 3 | 1 | 2 | 1 | 1 | 0.159 |
| 15 | 2 | 1 | 3 | 1 | 1 | 0.190 |
| 16 | 1 | 3 | 3 | 1 | 2 | 0.192 |
The process and results of range analysis are presented in Table 7. According to the values of R, the permeability coefficient k has the greatest impact on the stability variation, followed by the fluctuation rate v, the thickness t, the dip angle θ, and the slope height h. This ranking agrees with the conclusion on the relative influence of factors on the lagging effect.
| Parameters | Amplitude of variation in FoS | ||||
| t | θ | v | k | h | |
| K1 | 0.910 | 1.884 | 0.718 | 1.918 | 1.953 |
| K2 | 0.959 | 0.978 | 0.921 | 1.945 | 0.951 |
| K3 | 1.994 | 1.001 | 2.224 | 0.959 | |
| k1 | 0.2275 | 0.2355 | 0.1795 | 0.1598 | 0.2441 |
| k2 | 0.2398 | 0.2445 | 0.2303 | 0.4863 | 0.2378 |
| k3 | 0.2493 | 0.2503 | 0.2780 | 0.2398 | |
| R | 0.0220 | 0.0150 | 0.0990 | 0.3170 | 0.0060 |
6. Conclusions
To evaluate the impact of various factors on the stability of anti-dip rock slopes under fluctuating water levels in the TRGA, a conceptual model is constructed. The model focuses on sandstone as the strata and considers variations in strata thickness t, strata dip angle θ, permeability coefficient k, RWL fluctuation rate v, and slope height h. Seepage field and groundwater lines are obtained through seepage-stress field coupled analysis using GDEM software. The FoS is determined using the improved cantilever beam limit equilibrium method. The variations of the groundwater line and the FoS during the entire process of RWL rising and drawdown are investigated. Range analysis is employed to rank the impact of different factors. Based on the findings, the following conclusions can be drawn:
(1) The changes in groundwater levels in anti-dip layered rock slope exhibit a clear lag behind RWL fluctuations. During the rising stage, the groundwater level inside the model is lower than RWL, while during the drawdown stage, it is higher. Moreover, the gap between the groundwater level and RWL widens as we move from the slope surface to deeper regions. Range analysis confirms that the permeability coefficient k has the most significant impact on the lagging effect, followed by the fluctuation rate v, the thickness t, and the dip angle θ.
(2) The stability of anti-dip layered rock slopes varies throughout the entire RWL rising and drawdown process. Stability is improved during the rising stage but deteriorates during the drawdown stage. The FoS reaches its highest value when the RWL reaches 175 m and its lowest value when the RWL reaches 145 m. When the RWL remains stable at 175 m for a longer period, the FoS gradually decreases from its maximum value to a certain level. Conversely, when the RWL remains stable at 145 m for a longer period, the FoS increases from its minimum value to a certain level. Importantly, the FoS is higher when the RWL is stable at 145 m compared to when it is stable at 175 m.
(3) Different factors influence the stability of anti-dip layered rock slopes and its variation during an entire RWL rising and drawdown process. A smaller permeability coefficient k and a greater fluctuation rate v lead to a more significant enhancement and damage of stability during the RWL rising and drawdown stages, respectively. A larger strata thickness t, a smaller dip angle θ, and a smaller slope height h generally contribute to improved stability. As the strata thickness t increases, the dip angle θ increases, and the slope height h decreases, the enhancement of stability during the rising stage and the damage of stability during the drawdown stage become more noticeable. Range analysis shows that the permeability coefficient k has the greatest impact on the stability variation, followed by the fluctuation rate v, the thickness t, the dip angle θ, and the slope height h.
Acknowledgments
The work is supported by the National Natural Science Foundation of China (Grant Nos. U22A20660 and 52079070), and the Open Research Program of the Hubei Key Laboratory of Disaster Prevention and Mitigation (China Three Gorges University) (Grant no. 2022KJZ07).
References
[1]Huang R., Li W. Formation, distribution and risk control of landslides in China. Journal of Rock Mechanics and Geotechnical Engineering, 3(2): 97-116, 2011.
[2]Nichol S. L., Hunger O., Evans S. G. Large-scale brittle and ductile toppling of rock slopes. Canadian Geotechnical Journal, 39(4): 773-788, 2002.
[3]Tan R., Yang X., Hu R. Review of deformation mechanism and stability analysis of anti-dipped rock slopes. Rock & Soil Mechanics, 30(2): 479-484, 2009.
[4]Gu D., Huang D. A complex rock topple-rock slide failure of an anaclinal rock slope in the Wu Gorge, Yangtze River, China. Engineering Geology, 208: 165-180, 2016.
[5]Bowa V. M., Xia, Y. Stability Analyses of Jointed Rock Slopes with Counter-tilted Failure Surface Subjected to Block Toppling Failure Mechanisms. Arabian Journal for Science and Engineering, 43(10): 5315-5331, 2018.
[6]Xia M., Ren G., Li T., Cai M., Yang T., Wan Z. Complex rock slope deformation at Laxiwa Hydropower Station, China: background, characterization, and mechanism. Bulletin of Engineering Geology and the Environment, 78(5): 3323-3336, 2019.
[7]Goodman R. E., Bray J. W. Toppling of rock slopes. In Rock Engineering: American Society of Civil Engineers, Geotechnical Engineering Division Conference, Boulder, Colorado, 2: 201–234, 1976.
[8]Adhikary D. P., Dyskin A. V., Jewell R. J. Numerical modelling of the flexural deformation of foliated rock slopes. International Journal of Rock Mechanics &Mining Sciences & Geomechanics Abstracts, 33(6): 595–606, 1996.
[9]Adhikary D. P., Dyskin A. V., Jewell R. J., Stewart D. P. A study of the mechanism of flexural toppling failure of rock slopes. Rock Mechanics and Rock Engineering, 30(2): 75-93, 1997.
[10]Tu X., Dai F., Lu X., Zhong H. Toppling and stabilization of the intake slope for the Fengtan Hydropower Station enlargement project, Mid-South China. Engineering Geology, 91(2-4): 152–167, 2007.
[11]Chen Z., Gong W., Ma G., Wang J, HE L. Comparisons between centrifuge and numerical modeling results for slope toppling failure. Science China-Technological Sciences, 58(9): 1497–1508, 2015.
[12]Xie L., Yan E., Wang J., Lu G., Yu G. Study on evolutionary characteristics of toppling deformation of reverse-dip layered rock slope based on surface displacement monitoring data. Environmental Earth Sciences, 77(4), 156: 1-8, 2018
[13]Dong M., Zhang F., Lv J., Hu M., Li Z. Study on deformation and failure law of soft-hard rock interbedding toppling slope base on similar test. Bulletin of Engineering Geology and the Environment, 79(9): 4625-4637, 2020.
[14]Aydan Ö. Kawamoto T. The stability of slopes and underground openings against flexural toppling and their stabilisation. Rock Mechanics and Rock Engineering, 25(3): 143-165, 1992.
[15]Bobet A. Analytical solutions for toppling failure. International Journal of Rock Mechanics and Mining Sciences, 36(7): 971–980, 1999.
[16]Liu C., Jaksa M. B., Meyers A. G. A transfer coefficient method for rock slope toppling. Canadian Geotechnical Journal, 46(1): 1-9, 2009
[17]Amini M., Majdi A., Aydan Ö. Stability Analysis and the Stabilisation of Flexural Toppling Failure. Rock Mechanics and Rock Engineering, 42(5), 751-782, 2009.
[18]Amini M., Ardestani A., Khosravi M. H. Stability analysis of slide-toe-toppling failure. Engineering Geology, 228: 82-96, 2017.
[19]Smith J. V. Self-stabilization of toppling and hillside creep in layered rocks. Engineering Geology, 196: 139–149, 2015.
[20]Zheng Y., Chen C., Liu T., Xia K., Liu X. Stability analysis of rock slopes against sliding or flexural-toppling failure. Bulletin of Engineering Geology and the Environment, 77(4): 1383-1403, 2018.
[21]Ardestani A., Amini M., Esmaeili K. A two-dimensional limit equilibrium computer code for analysis of complex toppling slope failures. Journal of Rock Mechanics and Geotechnical Engineering, 13(1): 114-130, 2021.
[22]Han B., Wang S. Mechanism for toppling deformation of slope and analysis of influencing factors on it. Journal of Engineering Geology, 7(3): 213-217, 1999.
[23]Brückl E., Brunner F. K., Lang E., Mertl S., Müller M., Stary U. The Gradenbach Observatory—monitoring deep-seated gravitational slope deformation by geodetic, hydrological, and seismological methods. Landslides, 10(6): 815-829, 2013.
[24]Zhang Z., Wang T., Wu S., Tang H. Rock toppling failure mode influenced by local response to earthquakes. Bulletin of Engineering Geology and the Environment, 75(4): 1361-1375, 2016.
[25]Luo J., Pei X., Jiang R., Li T. Sun H., Jin B., Li Q. The Characteristics and Seepage Stability Analysis of Toppling-Sliding Failure under Rainfall. Sustainability, 15, 7736: 1-17, 2023.
[26]Zhao X., Yan L., Yang L., Chi F., Ning Y. Deformation characteristics and influential factors of a toppling rock slope based on the grey relational analysis. European Journal of Environmental and Civil Engineering, 27(7): 2507-2518, 2023.
[27]Lane P. A., Grifths D. V. Assessment of stability of slopes under drawdown conditions. Journal of Geotechnical and Geoenvironmental Engineering, 126(5): 443–450, 2000.
[28]Sun G., Zheng H., Huang Y., Li C. Parameter inversion and deformation mechanism of Sanmendong landslide in the Three Gorges Reservoir region under the combined effect of reservoir water level fluctuation and rainfall. Engineering Geology, 205: 133-145, 2016.
[29]Putty M. R. Y., Prithviraj B. N., Kumar P. N., Nithish M. G., Giri G., Chandramouli P. N. An insight into the hydrological aspects of landslides of 2018 in Kodagu, South India. Landslides, 18(5): 1597-1610, 2021.
[30]Zhou C., Cao Y., Yin K., Intrieri E., Catani F., Wu L. Characteristic comparison of seepage-driven and buoyancy-driven landslides in Three Gorges Reservoir area, China. Engineering Geology, 301, 106590: 1-13, 2022.
[31]Shrestha H. K., Yatabe R., Bhandary N. P. Groundwater flow modeling for effective implementation of landslide stability enhancement measures. Landslides, 5(3): 281-290, 2008.
[32]Zhu D., He L. Study on the Influence of Groundwater on Landslide Stability in the Three Gorges Reservoir. Arabian Journal for Science and Engineering, 47(4), 4211–4223, 2022.
[33]Vásárhelyi B. Statistical Analysis of the Influence of Water Content on the Strength of the Miocene Limestone. Rock Mechanics and Rock Engineering, 38(1): 69-76, 2005.
[34]Vásárhelyi B., Ván P. Influence of water content on the strength of rock. Engineering Geology, 84(1-2): 70-74, 2006.
[35]Zhao Z., Yang J., Zhang D., Peng H. Effects of Wetting and Cyclic Wetting–Drying on Tensile Strength of Sandstone with a Low Clay Mineral Content. Rock Mechanics and Rock Engineering, 50(2): 485-491, 2017.
[36]Liu X., Jin M., Li D., Zhang L. Strength deterioration of a Shaly sandstone under dry–wet cycles: a case study from the Three Gorges Reservoir in China. Bulletin of Engineering Geology and the Environment, 77(4): 1607-1621, 2018.
[37]Jiang Q., Deng H., Li J., Luo Z., Assefa E., Fang J., Xiao Y. The degradation effect and mechanism by water-rock interaction in the layered sandstone in the Three Gorges reservoir area. Arabian Journal of Geosciences, 12(23), 722: 1-11, 2019.
[38]Luo Z., Zhu Z., Jiang Q., Xu X., Liu D., Zhou M. Study on the Evolution Law of Sandstone Porosity under Soaking-Drying Cycles. Ksce Journal of Civil Engineering, 26(1): 25-34, 2022.
[39]Tang H., Li C., Hu X., Wang L., Criss R., Su A., Wu Y., Xiong C. Deformation response of the Huangtupo landslide to rainfall and the changing levels of the Three Gorges Reservoir. Bulletin of Engineering Geology and the Environment, 74(3): 933-942, 2015.
[40]Palis E., Lebourg T., Tric E., Malet J. P., Vidal M. Long-term monitoring of a large deep-seated landslide (La Clapiere, South-East French Alps): initial study. Landslides, 14(1): 155-170, 2017.
[41]Sun G., Yang Y., Jiang W., Zheng H. Effects of an increase in reservoir drawdown rate on bank slope stability: A case study at the Three Gorges Reservoir, China. Engineering Geology, 221: 61-69, 2017.
[42]Miao F., Wu Y., Li L., Tang H., Li Y. Centrifuge model test on the retrogressive landslide subjected to reservoir water level fluctuation. Engineering Geology, 245: 169-179, 2018.
[43]Sun L., Tang X., Abdelaziz A., Liu Q., Grasselli G. Stability analysis of reservoir slopes under fluctuating water levels using the combined finite-discrete element method. Acta Geotechnica, 18(10): 5403-5426, 2023.
[44]Huang D., Gu D., Song Y., Cen D., Zeng, B. Towards a complete understanding of the triggering mechanism of a large reactivated landslide in the Three Gorges Reservoir. Engineering Geology, 238: 36-51, 2018.
[45]Yin Y., Wang L., Zhao P., Zhang Z., Huang B., Wang X. Crashed failure mechanism & prevention of fractured high-steep slope in the Three Gorges Reservoir, China. Shuili Xuebao, 54(3): 379 -391, 2022
[46]Cai Y., Yasuhiro M., Tetsuro E. Numerical analysis of stability for an antidip stratified rock slope. Chinese Journal of Rock Mechanics and Engineering, 27(12): 2517-2522, 2008.
[47]Huang Y., Deng H., Li J., Feng Y., Wang W., Qi Y. Shear mechanical properties and constitutive model of jointed rock mass under water-rock interaction. Chinese Journal of Rock Mechanics and Engineering, 42(3): 545-557, 2023.
[48]Zhu C., Wu P., Yao H., Zhu D. Split Test of Sandstone under Conditions of Cyclic Saturation-drying and Long-term Saturation. Water Resources and Power, 30(12): 58-61, 2012
[49]Zhu D., He L. Study on the Influence of Groundwater on Landslide Stability in the Three Gorges Reservoir. Arabian Journal for Science and Engineering, 47:4211-4223, 2022
[50]Ren Q., Zhao Y., Zhu X., Zhou Y., Jiang Y., Wang P., Zhang C. CDEM-based simulation of the 3D propagation of hydraulic fractures inheterogeneous Coalbed Methane reservoirs. Computers and Geotechnics, 152, 104992: 1-18, 2022
[51]Azarafza M., Bonab M. H., Akgun H. Numerical analysis and stability assessment of complex secondary toppling failures: a case study for the south pars special zone. Geomechanics and Engineering, 27(5): 481-495, 2021
[52]Jiang W., Tan Y., Yan J., Ouyang Y., Fu Z., Feng Q. A BP neural network-based micro particle parameters calibration and an energy criterion for the application of strength reduction method in MatDEM to evaluate 3D slope stability. REVISTA INTERNACIONAL DE METODOS NUMERICOS PARA CALCULO Y DISENO EN INGENIERIA, 39(1): 12-23, 2023
[53]Lu H., Liu Q., Chen C. Improvement of cantilever beam limit equilibrium model of counter-tilt rock slopes. Chinese Journal of Rock Mechanics and Engineering, 33(2): 577-584, 2012.
Document information
Published on 25/01/24
Accepted on 04/01/24
Submitted on 28/11/23
Volume 40, Issue 1, 2024
DOI: 10.23967/j.rimni.2024.01.005
Licence: CC BY-NC-SA license
Share this document
Keywords
claim authorship
Are you one of the authors of this document?
