| Line 133: | Line 133: | ||
<span style="text-align: center; font-size: 75%;">'''Fig. 3-1 Modal Analysis Diagram'''</span></div> | <span style="text-align: center; font-size: 75%;">'''Fig. 3-1 Modal Analysis Diagram'''</span></div> | ||
| − | In this model, a subspace iterative method was employed to extract the first four modes, with the first frequency being 1.3058 Hz, corresponding to a period of 0.74 s for the model. The results obtained from both manual calculation and software using the formula <math> | + | In this model, a subspace iterative method was employed to extract the first four modes, with the first frequency being 1.3058 Hz, corresponding to a period of 0.74 s for the model. The results obtained from both manual calculation and software using the formula '''ω='''<math> \sqrt{K/M}</math>showed little discrepancy, indicating that the structural model is accurate and reliable. |
==3.2 Time-history analysis== | ==3.2 Time-history analysis== | ||
Revision as of 09:55, 18 November 2023
Abstract: Corrugated web H-beam refers to a steel beam with a wavy shape along its length, which is extensively utilized in various parts of building structures such as beams, columns, and walls. It serves the purpose of connection and support, while the corrugated or folded design enhances the shear resistance and out-of-plane stiffness of the web to some extent. However, despite their advantages including high strength, stiffness, and lightweight construction, relevant regulations stipulate that these members can only be used in lower-intensity applications or higher-intensity scenarios if specific conditions are met. One crucial condition is that the ratio between the design value of axial force subjected to seismic action and the product of the member's flange section area and steel's tensile strength should not exceed 0.4. In this study, we aim to further investigate the seismic characteristics and applicable intensity of corrugated steel structures under earthquakes through large-scale finite element ABAQUS simulations. We will observe dynamic characteristics and failure modes of corrugated rigid frame structures using elastic-plastic time-history analysis methods as well as examine plastic deformation features of steel beam members under low cyclic loads via hysteretic analysis methods. The findings demonstrate that when properly designed with reasonable beam spans, corrugated web rigid frame structures can still be employed in high-intensity areas above 7 degrees even when subjected to an axial compression ratio up to 0.5.
Keywords: Corrugated web; Intensity; Hysteretic behavior; Axial pressure ratio
1 Introduction
The concept of green building is comprehensively implemented in project onstruction and building, integrating principles of environmental protection and energy conservation to achieve features of sustainable development. Furthermore, the advancement of assembled steel structures effectively promotes the progress of green building. [1]
Corrugated steel profiles represent a novel form of environmentally friendly construction steel that has emerged in recent decades. The availability of materials, on-site component cutting and assembly capabilities, waste-free production processes, reduced transportation costs, and the ability to select sections based on load requirements have facilitated ongoing research in this field. [2]With the recent comprehensive investigations conducted by scientific researchers, static studies on corrugated steel profiles have reached a relatively advanced stage while dynamic research has been progressively expanding. In terms of bridge applications, Jiang Lizhong et al. experimentally demonstrated that corrugated web steel-concrete composite box girders exhibit well-defined load-displacement hysteresis loops under low-cycle repeated loads without any noticeable pinching phenomenon, thereby displaying excellent seismic performance. [3]. According to the principle of equal shear capacity in box girder sections, Feng Wenzhang developed finite element models for both corrugated steel web continuous rigid frame bridges and corresponding concrete web continuous rigid frame bridges. A comparative analysis was conducted on the dynamic characteristics and seismic performance of these two types. The findings reveal that under earthquake loading, corrugated steel web rigid frame bridges exhibit reduced internal forces at low piers and top shears at high piers compared to concrete web rigid frame bridges; however, they experience increased top bending moment at high piers and bottom internal forces at piers. [4]. Through mechanical formula analysis, Li Pengfei et al. have demonstrated that the implementation of hollow piers not only results in reduced weight but also effectively enhances the torsional performance of the upper structure in continuous rigid frame bridges with corrugated steel webs, thereby increasing its transverse compressive stiffness. Consequently, when designing continuous rigid frame box girder bridges with corrugated steel webs, employing hollow piers offers significant advantages. [5]. In terms of architecture, The seismic performance of the H-beam cantilever beam and frame with corrugated web was analyzed using the ABAQUS finite element model, as conducted by Wanyu [6]. The seismic performance of corrugated web dampers has been enhanced through Peng Jiacheng’s experimental research, thereby expanding the potential applications of corrugated steel materials [7]. Xingyu Mou et al. proposed a novel composite shear wall configuration comprising a frame consisting of corrugated concrete-filled steel tubular columns and filled corrugated steel plates, and demonstrated the excellent seismic performance of this composite structure through numerical analysis and experimental investigations [8]. According to the current investigation, despite the numerous advantages of corrugated web profiles, their promotion and utilization in China remain inadequate due to the intricate production process and limited seismic performance [9, 10]. Therefore, conducting research on corrugated steel within the realm of seismic applications for industrial and civil buildings holds immense significance. [11]
The simulation analysis in this study employed a combination of dynamic and quasi-static approaches. Time-history analysis was conducted on the rigid frame, while hysteresis analysis was performed on the steel beam [12]. These analyses were utilized to further investigate the ratio between the seismic-induced axial force design value and the product of the member's flange section area and its steel tensile strength design value. This research provides a theoretical basis for utilizing such components in high-intensity earthquake zones.
2 Modeling and analytical hypotheses
2.1 Analytical model and its corresponding parameters
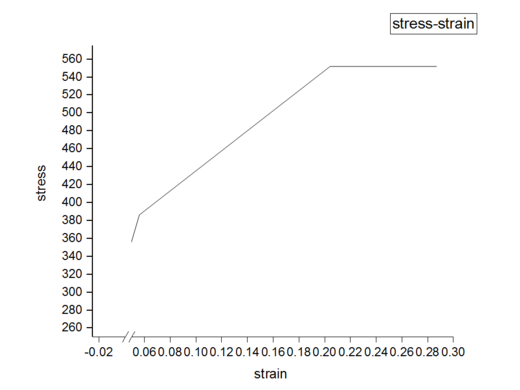
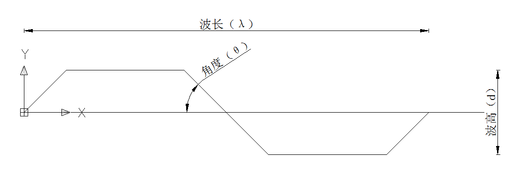
The material parameters are presented in Table 2-1, as depicted in Figure 2-1. Additionally, the web fluctuation parameters utilized in this study can be found in Table 2-2 and Fig.2-2.
| Steel | Elastic modulus | Density | Poisson's ratio | Design value of tensile strength |
| Q345 | 2.06×10¹¹N/m2 | 7850kg/m3 | 0.28 | 310N/mm2 |
| Angle(°) | Wave length
(mm) |
Wave height
80 (mm) |
Flange thickness-to-width ratio | Thick-ness
(mm) |
Web height
(mm) |
| 45 | 240 | 25 | 0.05 | 2 | 520 |
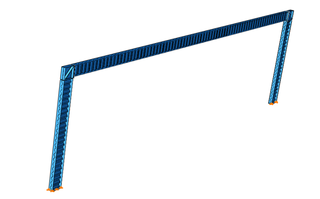
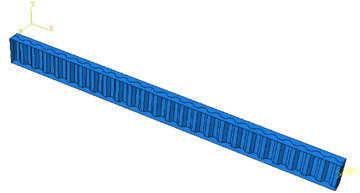
As depicted in Figure 2-3, Model 1 represents a rigid frame structure with zero ridge slope, featuring corrugated beam members of lengths 6m, 12m, 18m, and 24m, along with uniformly sized column heights of 6m. The node serves as a rigid junction connecting the X-direction (column height), Y-direction (perpendicular to the beam axis), and Z-direction (span direction) of the rigid frame. On the other hand, Model 2 exemplifies an ordinary rigid frame beam member model used for observing the hysteretic characteristics of corrugated steel beams under low-cycle reciprocating loads.
|
(1)Rigid frame structure model |
(2)Steel beam structure mode |
2.2 Analytical assumptions
(1)In the ideal state, it is assumed that the connection between the node of the member and the support in a rigid frame is perfectly rigid. (2)The beam of a rigid frame structure is assumed to be supported solely by pressure-type steel plate roofs and cold-formed steel purlins. (3)It is assumed that the structures are subjected to ideal conditions when under stress.
3 The dynamic analysis of a rigid frame structure
3.1 Modal analysis
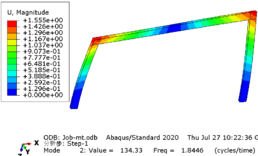
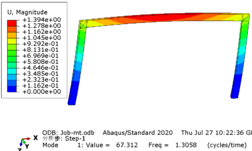
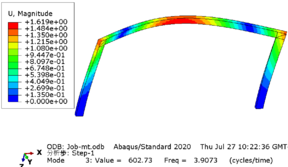
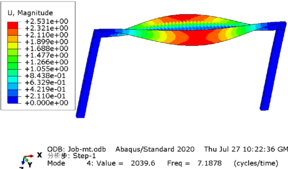
Taking the rigid frame with a span of 12 meters as an example, the modal analysis of the structure is carried out, and each mode is shown in Fig.3-1
|
First-order mode |
Second-order mode |
Third-order mode |
Fourth-order mode |
In this model, a subspace iterative method was employed to extract the first four modes, with the first frequency being 1.3058 Hz, corresponding to a period of 0.74 s for the model. The results obtained from both manual calculation and software using the formula ω=showed little discrepancy, indicating that the structural model is accurate and reliable.
3.2 Time-history analysis
In the Time- history analysis, a pair of eccentric forces is applied to simulate the beam as a flexural member and control it at the required axial compression ratio. The formula used for calculating the axial compression ratio is given by , where N represents the axial pressure value, denotes the net cross-sectional area of the flange, and f represents the design value of steel's tensile strength.
3.2.1 The modulation of seismic wave amplitude
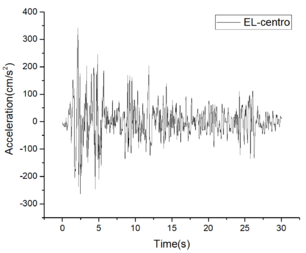
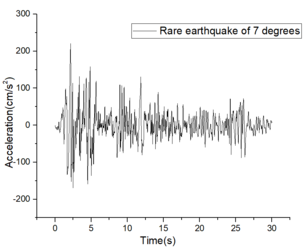
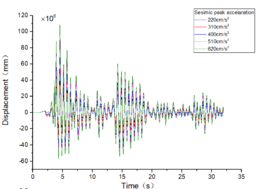
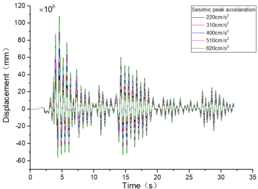
Under the column base constraint Ux, UR1, UR2, and UR3 are set to zero, and the EL-Centro seismic wave is applied along Uy and Uz directions with amplitude modulation performed according to the formula . Taking the EL-Centro wave as an example, it exhibits a peak acceleration of 2.20 m/s^2 and is depicted in Fig.3-2.
|
(a) Before the EL-Centro Amplitude Modulation |
(b) After the EL-Centro Amplitude Modulation |
3.2.2 The basis for analysis
According to the Stipulate of the the《Technical Specification for Steel Structures of Lightweight Buildings with Portal Frames》(GB51022:2015)[12]3.3.1: In a single-layer portal frame configuration, excluding crane and light steel wallboard, the maximum displacement of the column's top should not exceed H/ 60. This implies that the angular displacement between layers must be less than 0.017.
According to the Stipulate of the the《Technical Specification for Steel Structures of Lightweight Buildings with Portal Frames》(GB51022:2015)[12]3.3.2:The deflection limit for members of inclined beams in portal frames, supporting only profiled steel roofs and cold-formed steel purlins, is L/180, where L represents the full-span length.
3.2.3 The analysis of the results
(1) Comparative analysis under seismic conditions at axial compression ratios of 0.4 and 0.5
The eccentric load is applied to the beam of the rigid frame structure, subjecting the member to a specified axial compression ratio, and seismic waves are applied during rare earthquakes at the base of the rigid frame column. Firstly, we compare and analyze the structural stress and failure under earthquake conditions with an axial compression ratio of 0.4 and 0.5.
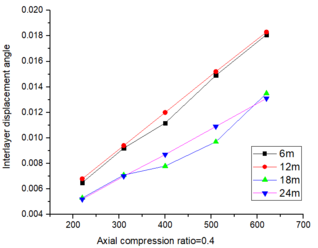
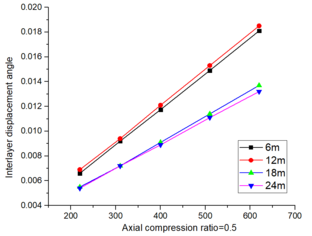
According to the analysis in Section 2.2.2, it is evident that for beam spans of 6m and 12m as shown in Tab.3-1, the inter-story displacement angle fails to meet the design requirements for seismic activity of a magnitude of nine degrees in high-risk areas. However, it does satisfy the intensity criteria under various coaxial pressure ratios at spans of 18m and 24m. The deflection meets the design specifications across different spans.
| Beam span | n | Wave peak value | 220 | 310 | 400 | 510 | 620 |
| 6m | 0.4 | (Interlayer displacement) max
|
39.29 | 54.91 | 70 | 89.60 | 108.61 |
| (Interlayer displacement angle) max | 0.0065 | 0.0092 | 0.0117 | 0.0149 | 0.0181 | ||
| (Mid-span deflection)max | 5.30 | 5.46 | 5.60 | 5.76 | 5.90 | ||
| 0.5 | (Interlayer displacement) max | 39.63 | 55.20 | 70.45 | 89.34 | 108.67 | |
| (Interlayer displacement angle) max | 0.0066 | 0.0092 | 0.01174 | 0.0149 | 0.0181 | ||
| (Mid-span deflection)max | 6.65 | 6.68 | 6.81 | 7.10 | 7.14 | ||
| 12m | 0.4 | (Interlayer displacement) max | 40.79 | 56.36 | 72.03 | 91.21 | 109.89 |
| (Interlayer displacement angle) max | 0.0068 | 0.0094 | 0.0120 | 0.0152 | 0.0183 | ||
| (Mid-span deflection)max | 13.51 | 13.62 | 13.79 | 13.92 | 14.01 | ||
| 0.5 | (Interlayer displacement) max | 41.30 | 56.51 | 72.66 | 91.86 | 111.04 | |
| (Interlayer displacement angle) max | 0.0069 | 0.0094 | 0.0121 | 0.0153 | 0.0185 | ||
| (Mid-span deflection)max | 16.57 | 16.72 | 16.80 | 16.91 | 17.07 | ||
| 18m | 0.4 | (Interlayer displacement) max | 31.65 | 42.57 | 46.57 | 58.31 | 81.41 |
| (Interlayer displacement angle) max | 0.0053 | 0.0071 | 0.0078 | 0.0097 | 0.013665 | ||
| (Mid-span deflection)max | 24.98 | 24.99 | 25.12 | 25.68 | 25.82 | ||
| 0.5 | (Interlayer displacement) max | 32.70 | 43.20 | 54.79 | 68.57 | 82.26 | |
| (Interlayer displacement angle) max | 0.0055 | 0.0072 | 0.0091 | 0.0114 | 0.0137 | ||
| (Mid-span deflection)max | 30.24 | 30.33 | 30.61 | 30.94 | 31.10 | ||
| 24m | 0.4 | (Interlayer displacement) max | 31.20 | 41.82 | 52.35 | 65.33 | 78.57 |
| (Interlayer displacement angle) max | 0.0052 | 0.0070 | 0.0087 | 0.0109 | 0.0131 | ||
| (Mid-span deflection)max | 42.47 | 40.76 | 41.02 | 41.27 | 41.61 | ||
| 0.5 | (Interlayer displacement) max | 32.48 | 43.45 | 53.5 | 66.40 | 79.36 | |
| (Interlayer displacement angle) max | 0.0054 | 0.0072 | 0.0089 | 0.0111 | 0.0132 | ||
| (Mid-span deflection)max | 50.31 | 48.03 | 50.61 | 50.98 | 50.14 |
Note: The peak amplitude of seismic waves is measured in cm/s2, while displacement and deflection are measured in mm.
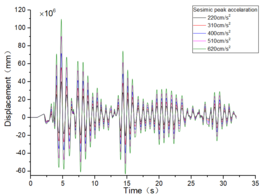
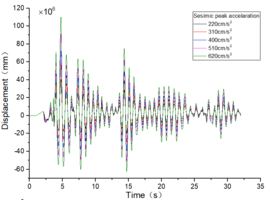
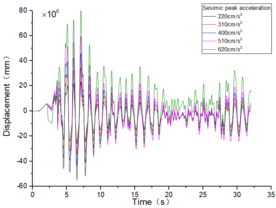
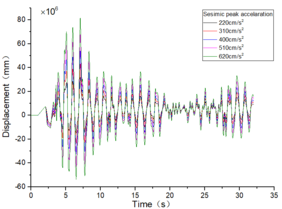
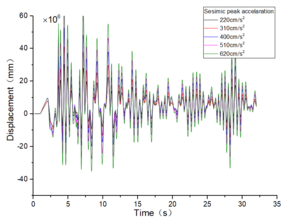
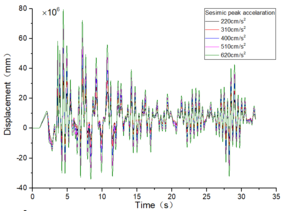
The inter-story displacement and inter-story displacement angle remain unaffected by the axial compression ratio, as evidenced in Fig. 3-2 and Fig. 3-3, while their values exhibit an increasing trend with higher seismic wave intensity.
|
a1-Span-6m-Axial compression ratio=0.4 |
a2-Span-6m-Axial compression ratio=0.5 |
| b1-Span-12m-Axial compression ratio=0.4 |
b2-Span-12m-Axial compression ratio=0.5 |
| c1-Span-18m-Axial compression ratio=0.4 | c2-Span-18m-Axial compression ratio=0.
5 |
| d1-Span-24m-Axial compression ratio=0.4 |
d2-Span-24m-Axial compression ratio=0.5 |
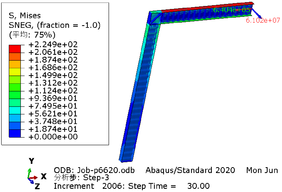
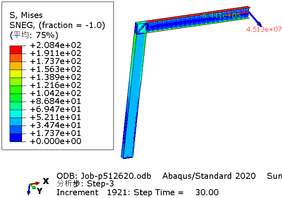
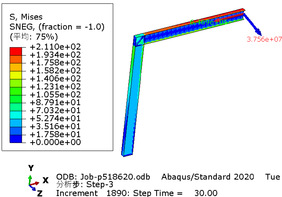
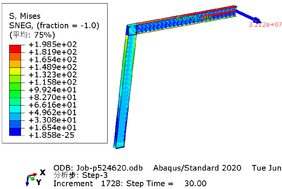
The greater the acceleration of an earthquake, the more severe the structural damage it inflicts. In this case study, we analyze the force cloud diagram of a member subjected to an intensity level of 9 degrees. According to Table 3-2, when the axial compression ratio ranges from 0.4 to 0.5, the member does not reach its yield strength and stress values decrease as span length increases. The structure experiences a maximum internal force of 647.7kN at an axial compression ratio approximately equal to 0.52; however, even at its highest stress value of 224.9MPa, it remains below its yield point and thus avoids any structural damage.
| Span | The axial compression ratio is 0.4 | The axial compression ratio is 0.5 |
| 6m | 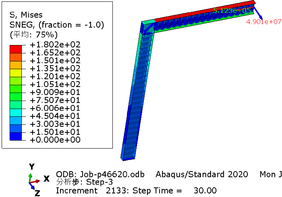
|
|
| 12m | 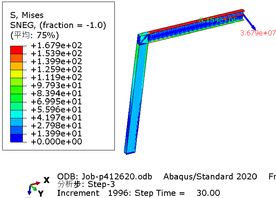
|
|
| 18m | 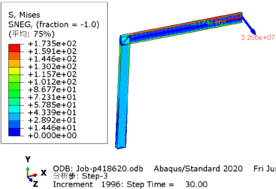
|
|
| 24m | 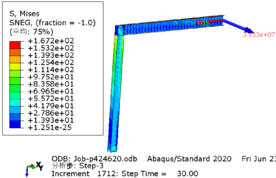
|
|
|
|
|
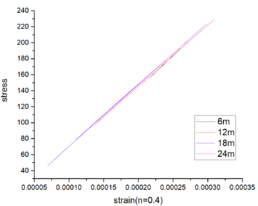
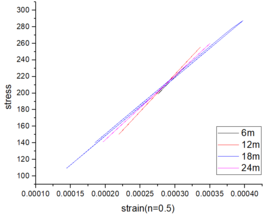
The stress-strain curves depicted in Fig. 3-5 for various beam spans and axial compression ratios demonstrate that irrespective of whether the axial compression ratio is 0.4 or 0.5, the observed elastic behavior persists within the range of beam spans from 6 to 24m. This characteristic enhances its ability to withstand external loads and seismic forces.
(2) When the axial compression ratio is 0.6, 0.7 and 0.8
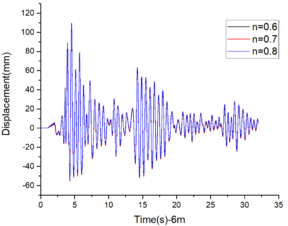
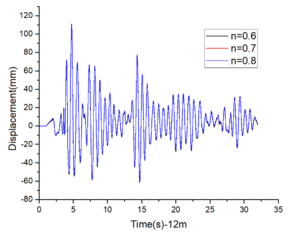
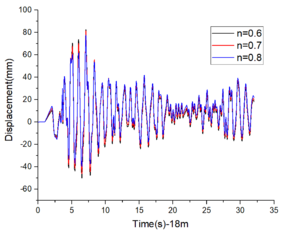
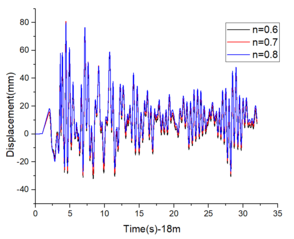
The analysis in Section 2.1 reveals that for beam spans of 6m and 12m, the inter-story displacement limit cannot be satisfied under the influence of rare earthquakes at a magnitude of 9 degrees. This is primarily attributed to the susceptibility of small span-to-height ratio connected beams to brittle shear failure during seismic events. However, as the span-to-height ratio increases, their mechanical behavior gradually approaches that of conventional frame beams, resulting in improved seismic performance [14-17]. Consequently, it can be inferred that even with larger axial pressure ratios, both 6m and 12m spans still fail to meet the requirements for rare earthquakes at a magnitude of 9 degrees. To further investigate the maximum achievable axial compression ratio for corrugated rigid frames, similar methods will be employed to analyze structural failure under rare earthquake conditions at magnitudes of 9 degrees when subjected to axial compression ratios of 0.6, 0.7, and 0.8.
|
|
|
|
The Technical code for the steel structure of the light-weight building with gabled frames(GB51022:2015) and Figure 3-6 showed the inter-story displacement fails to meet the code requirements under the influence of a 9-degree rare earthquake for beam spans of 6m and 12m, but it satisfies the requirements for spans of 18m and 24m. Table 3-3 demonstrates that the deflection complies with the code specifications. This conclusion remains consistent when considering coaxial compression ratios of both 0.4 and 0.5.
|
Beam span |
6m | 12m | 18m | 24m |
| 0.6 | 8.4 | 20.23 | 37.03 | 59.57 |
| 0.7 | 9.4 | 22.7 | 44.75 | 68.20 |
| 0.8 | 12.48 | 28.94 | 60.00 | 84.50 |
| 限值 | 33.33 | 66.67 | 100 | 133.33 |
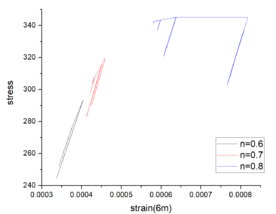
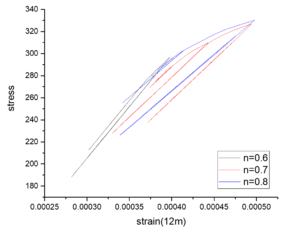
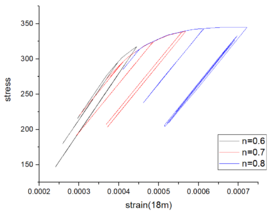
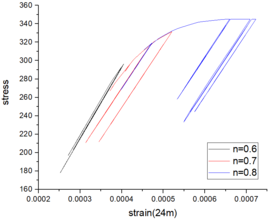
The stress-strain curve in Fig.3-7 demonstrates a distinct hysteretic characteristic as the axial compression ratio increases, with a more pronounced effect observed at higher ratios. This indicates that the rigid frame beam undergoes plastic deformation as the axial compression ratio rises, and this deformation becomes more significant with increasing compression. To ensure optimal seismic characteristics of the rigid frame structure, it is advisable to maintain the structure predominantly within the elastic stress stage. Therefore, based on the aforementioned conclusion, it can be inferred that even with an axial compression ratio of 0.5, the rigid frame structure still exhibits favorable seismic characteristics.
|
|
|
|
Fig. 3-7 stress-strain curves of different spans
4 Quasi-static analysis
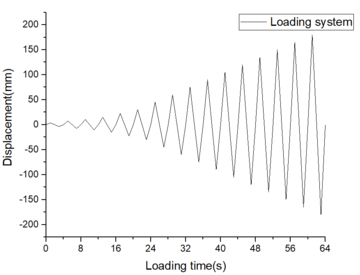
In the section of quasi-static hysteretic analysis, one end is fully consolidated, meaning that all six degrees of freedom are constrained to zero, while the other end is subjected to loading. The loading end applies a displacement amplitude in the vertical beam direction when the axial compression ratio is set at 0.4 and 0.5 respectively. The displacement starts from 0 mm and incrementally increases to 180 mm step by step. Simultaneously, the corresponding duration of each amplitude is defined in the analysis step, as depicted in Figure 4-1.
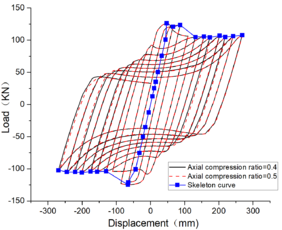
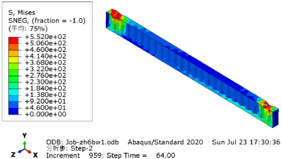
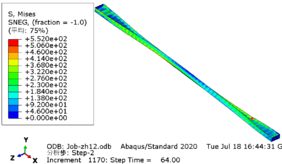
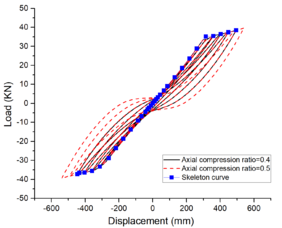
The hysteresis curves presented in Table 4-1 and the Mises cloud graph demonstrate that variations in axial compression ratio have minimal influence on the hysteresis loop. At a span of 6m, the hysteresis curve exhibits maximum completeness with a slight pinch and possesses the highest capacity for energy dissipation. The skeleton curve encompasses all three stages of elasticity, elastic-plasticity, and plasticity, while localized failure occurs at the beam ends upon reaching their yield limit.
When the beam span is 12m, the hysteretic curve exhibits significant pinching, and the beam undergoes noticeable torsion under displacement loading. At this juncture, failure of the steel beam no longer occurs solely at its end but rather manifests as local buckling at the point of torsion.
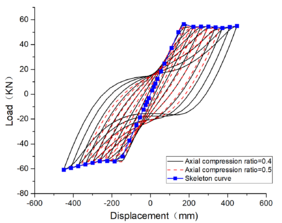
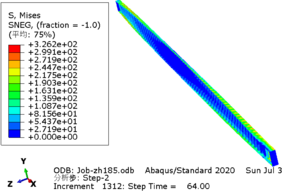
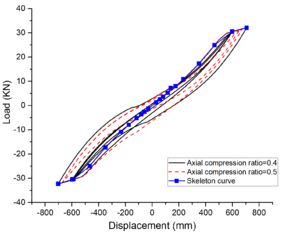
The area enclosed by the hysteretic loop gradually decreases with an increase in the shear-span ratio, as illustrated in Table 4-1. Moreover, the hysteretic curve exhibits significant pinching and slipping, resulting in a reduced external force required for the same displacement and diminished energy dissipation. At an 18m span, the torsional slip of the member is pronounced; however, at a 24m span, the member demonstrates nearly elastic deformation albeit with noticeably decreased energy dissipation.
The conclusion can be inferred that, for a specific axial compression ratio, the hysteresis analysis load capacity of the structure decreases as the span length increases. Moreover, it is observed that the hysteretic performance is minimally affected by the axial compression ratio; however, low cyclic loads still provide valuable insights for seismic analysis.
| Hysteretic curve | Mises cloud picture | |
| 6m | ||
| 12m | ||
| 18 | ||
| 24m |
5 Conclusions
1. The rigid frame beam spans ranging from 6 to 24m are designed to withstand earthquakes of up to 8 degrees or lower, while the spans of 18m and 24m can simultaneously resist earthquakes of magnitude 9 and below. Therefore, it is essential to carefully control the beam span to ensure optimal seismic resistance for the structure.
2. To ensure that structural failure always occurs within the elastic stage, it is crucial to limit the axial compression ratio and ensure a sound structural design. The utilization of corrugated web rigid frame structures may be appropriate in regions with infrequent seismic activity exceeding 7 degrees, provided that the axial compression ratio does not surpass 0.5.
3. The axial compression ratio has little influence on the hysteretic performance of the members. With the increase of the span, the members will slip, the hysteretic curve will shrink, and the energy dissipation will become smaller, which is not conducive to the earthquake resistance of the structure.
Reference:
[1] Chen Haoyu. Analysis and discussion on the application of prefabricated designand construction in green buildings. China Residential Facilities, 06(37-39), 2023,(inChinese).
[2] Alexander Ibragimov, Ekaterina Zinoveva, and Stanislav Rosinskiy. Prefabricated steel structures with a corrugated web (part 1. beam). IOP Conference Series Materials Science and Engineering, 869:072041, 2020.
[3] JIANG Lizhong, ZHONG Tianxuan, TAN Zhihua, ZHOU Wangbao, and WU Lingxu XU Tianxin. Study on seismic performance of steel-concrete composite box girder with corrugated web. Journal of Railway Science and Engineering, 18(555-563), 2021,(in Chinese).
[4] Feng Wen-zhang, Liu Bao-dong, Mou Kai, and Wang Hai. Research on seismic performance of continuous Rigid-frame bridge with corrugated steel webs. Earthquake Resistant Engineering and Retrofitting, 37(70-74), 2015,(in Chinese).
[5] LI Peng-fei, LIU Bao-dong, and XIAOYing-nan. Influence of pier types on dynamic characteristics of continuous rigid frame bridge with corrugated steel webs. Bridge construction, (2):3, 2011,(in Chinese).
[6] Wan-yu. Seismic performance analysis of h-shaped steel cantilever beam and frame with corrugated web. Master’s thesis, Nanchang University, 2022,(in Chinese).
[7] Peng Jiacheng. Theoretical and experimental study and analysis of damping effects on corrugated web damper. Master’s thesis, Huazhong University of Science and Technology, 2020.
[8] Xingyu Mou, Henglin Lv, and Xian Li. Seismic performance of corrugated steel plate composite shear walls with various configurations. In Structures, volume 57, page 105133. Elsevier, 2023.
[9] Technical specification for application of corrugated web steel structures 291:2011.
[10] Ltd. China Institute of Building Standard Design Research Co. Technical Specification for Steel Structures of Ligh-tweight Buildings with gabled frames GB51022-2015.Technical Specification for Steel Structures of Ligh-tweight Buildings with gabled frames GB51022-2015, 2003.
[11] Cheng jin. Analysis of overall stability performance of h-shaped steel axial compression members with corrugated webs. Master’s thesis, Southwest Petroleum University,2017.16
[12] Md Shahnewaz, Carla Dickof, and Thomas Tannert. Experimental investigation of the hysteretic behavior of single-story single-and coupled-panel clt shear walls with nailed connections. Engineering Structures, 291:116443, 2023.
[13] Editorial Board of the Encyclopedia of Earthquake Prevention and Disaster Reduction in China. Earthquake engineering. Earthquake engineering, 2010,( in Chinese).
[14] HU Qi. Study on the seismic performance of coupling beam in coupled shearwall. PhD thesis, Hefei University of Technology, 2013,( in Chinese).
[15] HAN Xiaolei and Liang Qizhi. Study on the structural control performance of coupled shear walls with a stiffening beam. South ChinaUniversity of Technology, 1991: 2. (in Chinese).
[16] LIANG Oizhiand HANXiaolei. Performance of rigid and ordinary connecting beams under low cycle repeated loading. Journal of South China University of Technology (Natural Sciences), 000(001):27–33, 1995,( in Chinese).
[17] FEDERAL EMERGENCY FEMA 356 et al. Prestandard and commentary for the seismic rehabilitation of buildings. Federal Emergency Management Agency: Washington, DC, USA, 2000.
[18] WANG Ming-qing, ZHANG Zhi, CHEN Zhen-hai, HAN Yi, and LIU Yuan-zhen.Seismic performance analysis of new connection nodes between embedded wall panels and steel frames. Science Technology and Engineering, 23(18):7868–7877, 2023.
[19] Guofeng Xue, Wei Bao, Jin Jiang, and Yongsong Shao. Hysteretic behavior of beam-to-column joints with cast steel connectors. Shock and Vibration, 2019:1–20, 2019.
[20] Zhang Li and Xu Yafeng. Analysis of the influence of different axial compression ratios on the hysteresis performance of carbon fiber reinforced steel reinforced concrete filled steel tube columns. In Proceedings of the 8th Shenyang Scientific Academic Annual Conference, pages 601–606.
[21] LV Liang, SUN Guohua, and YANG Weixing. Influence of axial compression ratio on hysteretic behavior of i-shaped steel tube bundle high strength concrete composite shear wall. Journal of Suzhou University of Science and Technology(Engineering and Technology Edition), 36(1):8–14, 2023
Document information
Published on 21/03/24
Accepted on 29/02/24
Submitted on 23/10/23
Volume 40, Issue 1, 2024
DOI: 10.23967/j.rimni.2024.03.001
Licence: CC BY-NC-SA license
Share this document
claim authorship
Are you one of the authors of this document?
