(Tag: Visual edit) |
|||
| Line 1: | Line 1: | ||
| − | |||
| − | |||
| − | |||
| − | |||
| − | |||
| − | |||
| − | |||
| − | |||
| − | |||
| − | |||
| − | |||
| − | |||
| − | |||
| − | |||
| − | |||
| − | |||
| − | |||
== '''Microstructure effect analysis of carbon black-filled rubber composites''' == | == '''Microstructure effect analysis of carbon black-filled rubber composites''' == | ||
Lihong Huang<sup>1,2</sup>, Xin Tao<sup>2</sup>, Tieping Wei<sup>1,2</sup>, Zhifeng Li<sup>2</sup> | Lihong Huang<sup>1,2</sup>, Xin Tao<sup>2</sup>, Tieping Wei<sup>1,2</sup>, Zhifeng Li<sup>2</sup> | ||
Revision as of 09:13, 12 January 2024
Microstructure effect analysis of carbon black-filled rubber composites
Lihong Huang1,2, Xin Tao2, Tieping Wei1,2, Zhifeng Li2
1. Fujian Key Laboratory of Intelligent Machining Technology and Equipment, Fujian University of Technology, Fuzhou 350118, China.
2. School of Mechanical and Automotive Engineering, Fujian University of Technology, Fuzhou 350118, China.
Corresponding author: Lihong Huang
E-mail address: 183132514@qq.com-->
Abstract: The unidirectional tensile stress-strain curves of four kinds of carbon black-filled rubbers with different volume contents were obtained by mechanical experiments, and the fine morphology maps of the carbon black-filled rubber composites were obtained by electron microscope experiments. Based on the hyperelastic constitutive model of rubber, an ellipsoidal carbon black particles randomly distributed finite element model was established using DIGIMAT and ABAQUS, and uniaxial tensile simulation was carried out on the established two-dimensional model. The effects of the volume fraction, distribution angle and number of agglomerates of carbon black particles on the stress-strain relationship curve and stress distribution of the composites were analyzed. The results show that: with the increasing volume fraction of carbon black particles, the stiffness value of the composite material becomes larger; when the particle direction is 0° to the load direction, the strength of the material is improved and the stress concentration phenomenon is less; with the increasing number of carbon black agglomerates, the strength of the composite material decreases and the stress concentration phenomenon is obvious in agglomerated area.
Key words: Rubber composites; carbon black; RVE; finite element
1 Introduction
Rubber is an elastic polymer with strong nonlinear viscoelastic behaviour [1-3], and it has widespread applications in various fields, especially in the automotive industry, power cables, construction engineering, and medical devices, however, traditional rubber materials may not meet specific requirements under certain conditions, such as limitations in wear resistance, mechanical property, and conductivity. To improve rubber performance and broaden its applicability, researchers have introduced fillers into the rubber matrix, among these fillers, carbon black has garnered significant attention due to its outstanding characteristics[4-6].As a filler, carbon black exhibits structural stability, excellent conductivity, and a high specific surface area, which can significantly enhance the physical and mechanical properties of rubber. Nevertheless, the performance of carbon black-filled rubber composites is not solely dependent on the type and content of carbon black particles, it is also closely related to their microstructure[7-9].
In recent years, many scholars have carried out a lot of research on the microstructural effects of carbon black particles. Tomita [10] et al. used a non-affine molecular chain network model to numerically simulate the deformation behavior of rubber under macroscopic homogeneous stretching and the deformation behavior of plane-strained rubber monoliths containing cylindrical carbon blacks. The study showed that an increase in the volume fraction of carbon black and an increase in the distribution of the inhomogeneity of carbon black significantly improved the resistance to deformability and hysteresis loss; Li et al. developed a three-dimensional finite element model of filler agglomerate distribution versus regular distribution for different carbon black volume fractions, which showed that the stress-strain curves predicted by the agglomerated particles model were higher than those predicted by regular particles, and that the agglomerated particles predictions progressively became more stringent than those observed in the experiments when the deformation of a given magnitude was applied.AKUTAGAWA [11] et al. combined the three-dimensional transmission electron microtomography (TEMT) and voxel finite element techniques to reconstruct a finite element model of filler agglomeration distribution, calculate the strain distribution, and also calculate a virtual rubber model with perfectly dispersed fillers, and the results showed that the overall stresses in the actual filler model reconstructed using the three-dimensional TEMT images were higher than those in the model with perfectly dispersed fillers. Li [12]et al. calculated the RVE of filler rubbers with different particle shapes when the volume fraction of carbon black was 15%, and the RVE of filler rubbers with different particle shapes when deformation was applied was higher than those observed in experiments. The compressive stress-strain curves of RVE with different particle shapes showed that at the same strain level, the composite with rectangular cross-section particles required the highest stress, the elliptical cross-section particles the next highest, and finally the square cross-section particles.
In this paper, a combination of experiments and numerical simulations was used to analyze the mechanical behavior of carbon black-filled rubber composites under tensile action. Firstly, uniaxial tensile experiments were carried out on four kinds of carbon black volume fractions of filled rubbers, and the intrinsic parameters were obtained based on the experimental fitting, and then a two-dimensional elliptic plane strain model was established for uniaxial tensile simulation, to analyze the effects of microstructural variations on the mechanical behavior of the carbon black-filled rubber composite composites.
2 Experiment
2.1 Mechanical experiment
Four kinds of carbon black-filled rubber materials with different contents were selected, and the formulations of the four vulcanized rubbers are listed in Table 1. The tensile specimens were prepared according to the national standard (GB/T528-2009). The tests were carried out on an AG-Xplus 2KN Shimadzu universal material testing machine. The experiments were repeated at least 3 times for each condition, and the average value was taken as the final experimental result.
| Rubber | NR | N330 | ZnO | Accelerator NS | Antioxidant 4020 | Sulphur | Aromatic hydrocarbon oil | Stearic acid | |
| NR1 | 100 | 0 | 3 | 0.75 | 4 | 1.8 | 10 | 1.5 | 0 |
| NR2 | 100 | 15 | 3 | 0.75 | 4 | 1.8 | 10 | 1.5 | 6.19% |
| NR3 | 100 | 35 | 3 | 0.75 | 4 | 1.8 | 10 | 1.5 | 13.34% |
| NR4 | 100 | 55 | 3 | 0.75 | 4 | 1.8 | 10 | 1.5 | 19.47% |
In this paper, the rubber specimens were firstly modulated before doing the uniaxial tensile experimental process, so as to eliminate the influence of Mullins effect on the mechanical behavior of rubber, and to obtain more stable experimental data. Each specimen was subjected to 6 repeated unidirectional tensile loading and unloading at a strain rate of 0.06 /s, with a cyclic strain of 150%, and the modulated specimens were placed at room temperature for 24 hours before uniaxial tensile testing.
2.2 Experiment results
The deformation of rubber in terms of engineering strain is generally less than 100%. Therefore, 100% strain is used to characterize the mechanical properties of rubber materials in uniaxial tensile tests.
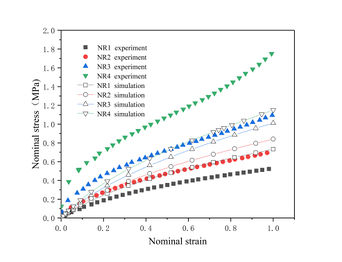
Figure 1 shows the nominal stress-strain curves of unmodulated rubber and modulated rubber obtained by unidirectional tensile tests, from which it can be learned that the modulated rubber agrees with the unmodulated rubber in that its stiffness increases with the increase in the volume fraction of carbon black. When the filling amount of carbon black is small, the curves of modulated rubber and unmodulated rubber are almost coincident, but as the filling amount of carbon black increases, the difference between the stress-strain curves of modulated rubber and unmodulated rubber becomes more and more obvious, and the curves show obvious "upward curvature" characteristics.
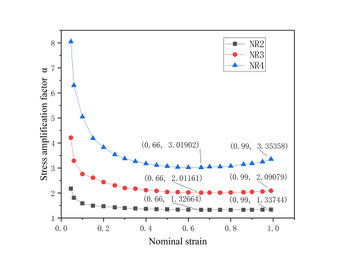
The stress amplification factor α [13]versus strain curves for three types of filled rubbers are given in Fig. 2 for evaluating the effect of carbon black particles on the superelastic stress of rubber materials. The expression for the stress amplification factor α is given by:
where σ(ε) is the stress of the filled rubber at a given strain ε and σ_0 (ε) is the stress of the unfilled rubber at the same strain ε.
From Fig. 2, it can be seen that in the initial deformation stage, the value of the stress amplification factor is higher, and then with the increase of strain, the value of α of the filled rubber has a tendency to decrease and then increase, and the higher the volume fraction of carbon black is, the more obvious this trend is. The reason for the above trend is that in the case of low strain, the interaction between the filler particles and the rubber matrix is weak, and the stress transfer is incomplete, resulting in a slightly higher stress amplification factor, with the increase of strain, the interaction between the filler particles may become stronger, resulting in the gradual formation of a network structure of the filler in the rubber matrix, which enhances the stress transfer, and thus stress amplification factor will have a decreasing section,the factor will have a decreasing segment, but as the strain continues to increase, it will make the carbon black particles more compact with each other, leading to stress concentration, and thus the stress amplification factor increases.
2.3 SEM experiment
Using liquid nitrogen on the four different carbon black volume content of the rubber to be observed frozen slices, and the fracture was sprayed with gold, in the NovaNanoSEM450 scanning electron microscope to observe the carbon black distribution on the surface, as shown in Fig. 3, the analysis shows that, carbon black volume fraction of 0%, the figure of the lumps of material is ZnO, when the carbon black volume fraction of 6.19%, the new addition of carbon black particles In the matrix distribution is more uniform, but no agglomeration phenomenon, with the increase of carbon black volume fraction, the particle agglomeration phenomenon began to appear, and the number of agglomerates and the volume fraction is positively proportional to the relationship.

% |

% |

% |

% |
3. Structural modelling
3.1 Determination of constitutive parameters
The constitutive model is the basis for studying the mechanical properties of rubber materials, and its geometric nonlinear relationship must be considered when establishing the constitutive relationship of hyperelastic materials. In engineering practice, strain energy function [14-17] is commonly used to represent the hyperelastic constitutive relationship of rubber materials, three common constitutive models are listed below.
1. Mooney-Rivlin Model
The Mooney-Rivlin model, a more classical intrinsic model in which the mechanical behavior of all rubber materials can be simulated almost all the time, is suitable for describing small and medium deformations, and its strain energy density function is as follows:
Its common second-order expansion is given by.
where is the strain energy density function of the rubber-like nonlinear material model, and are the first and second invariants of the Green deformation tensor, respectively, and and are the intrinsic parameters, which are determined by experiments.
2. Yeoh Model
The Yeoh model has an additional term containing exponential decay compared to the Mooney-Rivlin model, and its strain energy function is expressed as:
Its commonly used form is given as follows:
Where , and are material constants.
3. Ogden Constitutive Model
The Ogden intrinsic model is based on the concept of the strain energy density function, which describes the mechanical behavior of a material by expressing the strain energy density function as a power series expansion of the strain. It assumes that the strain energy of a material can be described by higher order terms of strain which have different weights in different strain directions. Its strain energy density function is as follows:
Where is the order, and are material parameters.
Based on the experimental unidirectional tensile data, the above three hyperelastic constitutive model were selected for fitting, and the fitting curves are shown in Fig. 4 In order to judge the fitting accuracy of the three models more intuitively, the root-mean-square error RSME, the residual error SSE, and the coefficient of determination R2 of each model fitting were calculated, and the results were listed in Table 2.
From the results in Fig. 4, it can be seen that all three models fit the experimental curves well at a strain of 1. Considering that the smaller values of RMSE and SSE indicate the higher fitting accuracy of the models, and the closer the value of R2 is to 1 indicates the better fitting of the models, it can be concluded from Table 2 that the Mooney-Rivlin model has a higher fitting accuracy compared to the other two models, therefore, the Mooney-Rivlin intrinsic model will be used for simulation calculations in the subsequent work. Based on the fitting of the previous experimental data, the material constants for the Mooney-Rivlin intrinsic model were determined to be C10 = 0.11418 MPa, and C01 = 0.081221 MPa.
| RMSE | SSE | ||
| Mooney-Rivlin | 0.0015089 | 2.98E-04 | 0.99989 |
| Yeoh | 0.0023356 | 7.15E-04 | 0.99974 |
| Ogden | 0.012336 | 0.0199 | 0.99268 |
3.2 Model Establishment
In order to study the distribution of reinforcing phases in the composite matrix, researchers have proposed the hypothesis that the composite microstructure is periodic and follows a statistical law. To facilitate the study, the concept of representative volume element (RVE) is introduced, which suggests that the whole composite is composed of periodically arranged RVEs [18-21]. Fig. 5 shows a schematic diagram of representative volume element (RVE) selection. When selecting the RVE, it should be large enough to contain enough compositional information of the microstructure, at the same time, the size of the RVE should be small enough to reflect the non-uniformity of its microstructure,this ensures that the RVE captures critical microstructural features without excessive computational cost.
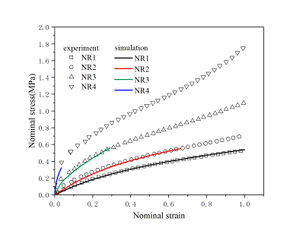
Carbon black is usually regarded as an isotropic elastic material with a Young's modulus of 500 MPa and a Poisson's ratio of 0.3. A hyperelastic intrinsic model was used to model the rubber, and the carbon black particles were treated separately from the rubber matrix in the modeling, and the rubber matrix without carbon black particles was unfilled rubber. Figure 6 shows the comparison between the 3D RVE model and the experimental stress-strain curves under four different volume fractions, and the 3D model curves are in good agreement with the experimental curves, however, due to the limitation of computer hardware resources, when the volume fraction of carbon black exceeds 13%, the model can only realize the deformation in a small range, so it is challenging to observe the changes of the stress-strain curves and the internal cloud maps of the matrix under large deformation, in addition, the strain in tensile simulation is further reduced due to the wider size range of aggregates, therefore, in this study, two-dimensional RVE was used to perform finite element analysis of carbon black-filled rubber. In the two-dimensional RVE modeling, the area fraction is commonly used instead of the volume fraction, which greatly improves the convergence of the simulation; however, the finite element results of the two-dimensional RVE do not accurately represent the experimental results, but they still qualitatively reflect the trend of changes.
The geometric model of a two-dimensional RVE with multiple particle inclusions was established using Digimat software. The side length of the RVE denoted as L, is set to 1 μm. The elliptical particles have a radius of r = 86 nm and an aspect ratio of 0.5825. To ensure the carbon black content and mesh quality, a minimum distance of 0.3r is defined between any two particles. Figure 5(c) shows the geometric model of the RVE with a carbon black content of Vf = 13.34%.
3.3 Abaqus operation
After completing the 2D geometric modeling of the RVE, calculations were performed with the help of ABAQUS software. In ABAQUS the rubber matrix was modeled using CPE8H hybrid cells suitable for large deformation problems, and the carbon black particles were modeled using CPE8 cells. For the model shown in Figure 5(c) a total of 12690 nodes and 4169 cells are divided, the grid division is shown in Fig. 7 and the equation constrained periodic boundary conditions are used as follows:
4. Results and Discussion
4.1 Analysis of Deformation Field and Stress Field
For the numerical model with 13.34% volume content of carbon black, uniaxial stretching was realized by applying 1 μm displacement along the x-axis, and the deformation map and stress field of the RVE model were calculated with the help of ABAQUS software, and the deformation map and stress field of the RVE with a volume fraction of 13.34% are shown in Fig. 8 and Fig. 9, respectively.
From Fig. 8, it can be seen that when the tensile strain of carbon black-filled rubber with a volume fraction of 13.37% is 1, the material undergoes a large deformation, with a large deformation of the rubber matrix and a small deformation produced by the carbon black particles. And it can be observed that the two-dimensional RVE model has exactly the same shape of the opposite boundary, which conforms to the periodic boundary condition.
From the observation in Fig. 9, it can be seen that the stress distribution in the RVE model is inhomogeneous, the stresses are significantly higher near the carbon black particles compared to other regions, as the distance between the carbon black particles decreases, the stress concentration phenomenon is more likely to occur, resulting in denser contour lines, along the stretching direction, a series of shear bands are formed between the particles, and regions of higher stress are located within these shear bands, in addition, shear bands also form in the longitudinal direction, but they are significantly less numerous than in the transverse direction.
4.2 Effect of Volume Fraction
Representative volume element (RVE) models were constructed for 0%, 6.19%, 13.34%, and 19.47% volume fractions of the composites using DIGIMAT software. The plane strain model was used for finite element calculation to obtain the nominal stress-nominal strain curve of the material, as shown in Fig. 10. From Fig. 10, it can be seen that when the carbon black volume fraction is low, the stress-strain curve gradually increases with increasing strain and the stiffness and strength of the composites are relatively low, compared to higher volume fractions of carbon black particles, and this behavior can be attributed to the limited reinforcement provided by the low concentration of carbon black particles, the stiffness and strength of the composites increased significantly with increasing volume fraction of carbon black,higher stress levels at a given strain compared to low volume fraction indicate improved load carrying capacity. The presence of higher concentrations of carbon black particles resulted in more efficient stress transfer within the composite structure.
Furthermore, it is worth noting that for volume fractions of carbon black greater than 13.34%, there is a significant deviation in the fitting results, this discrepancy can be mainly attributed to the fact that the present study employed a two-dimensional model and used the area fraction of carbon black particles as a substitute for the volume fraction, which cannot accurately represent the true results.
4.3 Effect of Particle Orientation
A representative volume element was established when the particle volume fraction was 13.34%, and the particles were oriented at 0°, 45°, and 90° with the tensile direction, respectively, and finite element calculations were carried out by the plane strain model, and the Mises stress cloud map and the nominal stress-strain curves of the composites are shown in Fig. 11 and Fig. 12,it can be learned that the material strength is the highest when the particles are completely distributed at an angle of 0°, followed by 90°, and the lowest when the particles are at 45° to the load direction, which is due to the fact that when the carbon black particles are oriented randomly, it makes the material have a similar going structure in all directions, and the material's isotropy is strengthened, while when the carbon black particles show a certain fixed distribution of orientation, the material's anisotropy is strengthened, and the material has better mechanical strength in the direction where the carbon black particles are located. The material has better mechanical strength in the direction where the particles are located, so the strength is higher than the 45° distribution. When the particles are distributed at 45° and 90° to the tensile direction, the stress concentration phenomenon is more obvious than the 0° distribution, and more shear bands will sprout.

(a)0° |

(b)45° |

(c)90° |
4.5 Effect of Particle Agglomeration
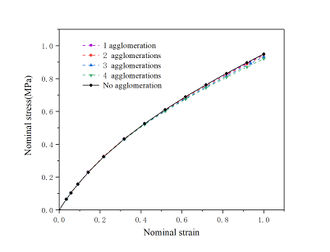
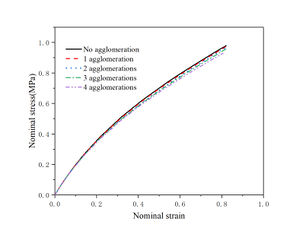
Particles in the matrix are usually distributed unevenly, there will be agglomeration, the literature for the agglomeration of less involved, so this paper with the help of DIGIMAT software, the establishment of the RVE model containing carbon black agglomerates, agglomerates are established as in Fig. 13, the formation of agglomerates formed by a number of carbon black particles is idealized as a larger carbon black particles, the establishment of the degree of particle clustering was 1 at the aggregation, 2 at the aggregation, 3 at the aggregation, 4 at the aggregation model for numerical simulation calculations, to more accurately respond to the trend of the stress-strain curve changes after the generation of agglomeration, the establishment of carbon black particles volume fraction of 13.34% and 19.47% of the two kinds of uniaxial tensile nominal stress-nominal strain curve of the composite material and the Mise stress cloud diagram shown in Fig. 14 and Fig. 15 were obtained.
As can be seen in Figures 14 and 15, the combined strength of the composites decreases slightly as agglomeration occurs, when only one agglomeration point exists, the stress-strain relationship is approximate to the non-agglomeration case, however, as the degree of agglomeration increases, the overall stress level of the composite decreases. This is due to the fact that more agglomeration leads to load transfer from regions with fewer particles to the agglomerated regions, even under small strain conditions, defects may appear in the agglomerated regions due to stress concentration.
In addition, an increase in the degree of agglomeration leads to a larger distance between the carbon black particles, which affects the cross-linking reaction between the rubber molecules and the carbon black particles, the reduction in the number of chemical bonds in the network structure of the crosslinked composite results in a decrease in its strength.
Mises stress cloud map in Fig. 16 and Fig. 17 show similar results for both volume fraction RVE models. The stress concentration becomes more pronounced as the agglomeration increases, this can be attributed to the idealization of agglomerates, i.e., larger carbon black particles with a larger contact area with the matrix.

(a)1 agglomeration |

(b)2 agglomerations |
 (c)3 agglomerations (c)3 agglomerations
|
 (d)4 agglomerations (d)4 agglomerations
|

(a)1 agglomeration |
 (b)2 agglomerations (b)2 agglomerations
|

(c)3 agglomerations |
 (d)4 agglomerations (d)4 agglomerations
|
Conclusion
In this study, a two-dimensional plane strain model was developed for elliptical carbon black particles, and simulations and analyses of uniaxial tension were performed. The effects of carbon black volume fraction, particle distribution angle, and agglomeration on the stress-strain relationship and stress distribution in the Representative Volume Element (RVE) of the composite material were investigated. The following conclusions were drawn:
1. As the volume fraction of carbon black particles increases, the stress-strain curve of the rubber composite material rises, indicating higher stiffness.
2. When the particles are distributed at an angle of 0° with respect to the loading direction, the composite material exhibits the highest strength, while the strength is lowest when the distribution angle is 45°. The 45° and 90° distributions result in the formation of more shear bands compared to the 0° distribution.
3. The occurrence of agglomeration leads to a decrease in the overall strength of the composite material, and as the number of agglomerates increases, stress concentration becomes more pronounced.
These findings provide insights into the influence of carbon black characteristics on the mechanical behaviour of the composite material. They contribute to a better understanding of the relationship between microstructural parameters and the macroscopic performance of rubber composites. Further studies can explore more complex particle shapes and investigate the effect of other factors on the mechanical response of the material.
Acknowledgements
This work was supported by Natural Science Foundation Project of Fujian Province (Grant No. 2020J05179)), and Science and Technology Project of FuJian University of Technology (Grant No. GY-Z20012).
References
[1] Ramesan, M. T. , R. Alex , and N. V. Khanh . "Studies on the cure and mechanical properties of blends of natural rubber with dichlorocarbene modified styrene–butadiene rubber and chloroprene rubber." Reactive & Functional Polymers 62.1(2005):41-50.
[2] Payne, A. R. . "The Dynamic Properties of Carbon Black-Loaded Natural Rubber Vulcanizates. Part I." Journal of Applied Polymer Science 6.19(2010):57-63.
[3] Hubert, et al. "Theory of the Elastic Properties of Rubber." Journal of Chemical Physics 11(1943).
[4] Elizabeth, K. I , R. Alex , and S. Varghese . "Evaluation of blends of natural rubber and hydrogenated nitrile rubber containing chemically modified natural rubber." Plastics Rubber & Composites 37.8(2008):359-366.
[5] Sumita, Masao . "Characterization of Disporsion of Filler and Polymer-Filler Interaction in Rubber-Carbon Black Composites." (1996).
[6] Zhong Xian Ooi, H. Ismail , and A. A. Bakar . "Optimisation of oil palm ash as reinforcement in natural rubber vulcanisation: A comparison between silica and carbon black fillers." Polymer Testing (2013).
[7] Jean, A. , et al. "A multiscale microstructure model of carbon black distribution in rubber." Journal of Microscopy (2011).
[8] Figliuzzi, Bruno , et al. "Modelling the microstructure and the viscoelastic behaviour of carbon black filled rubber materials from 3D simulations." (2016).
[9] Li, Qing, and Yang Xiaoxiang. "Numerical Study on the Mechanical Behavior of N330 Carbon Black Reinforced Rubber Composites." Journal of Composite Materials Science and Engineering 7 (2019): 16-20.
[10] Tomita, Yoshihiro , W. Lu , and Y. Furutani . "Numerical evaluation of micro- to macroscopic mechanical behavior of carbon-black-filled rubber." Key Engineering Materials 274-276.2(2004):19-24.
[11] Akutagwa, K , et al. "Mesoscopic mechanical analysis of filled elastomer with 3D-Finite Element Analysis and transmission electron microtomography." Rubber Chemistry and Technology 2(2008):81.
[12] Li, Qing , and X. X. Yang . "Numerical Simulation for Mechanical Behavior of Carbon Black Filler Particle Reinforced Rubber Matrix Composites." Applied Mechanics & Materials 137(2011):1-6.
[13] Xia, et al. "TEST AND CALCULATION OF THE CARBON BLACK REINFORCEMENT EFFECT ON THE HYPER-ELASTIC PROPERTIES OF TIRE RUBBERS." Rubber Chemistry and Technology (2015).
[14] Li, Xiaofang, and Yang Xiaoxiang. "Hyperelastic Constitutive Models for Rubber Materials." Elasticity 15.1 (2005): 9.
[15] Khajehsaeid, H. , J. Arghavani , and R. Naghdabadi . "A hyperelastic constitutive model for rubber-like materials." European Journal of Mechanics / A Solids 38.none(2013):144-151.
[16] Hüsnü Dal, K. Acikgoz , and Y. Badienia . "On the Performance of Isotropic Hyperelastic Constitutive Models for Rubber-Like Materials: A State of the Art Review." Applied Mechanics Reviews (2021).
[17] Attard, Mario M , and G. W. Hunt . "Hyperelastic constitutive modeling under finite strain." International Journal of Solids & Structures 41.18-19(2004):5327-5350.
[18]Khisaeva, Z. F., and M. Ostoja-Starzewski. "On the size of RVE in finite elasticity of random composites." Journal of elasticity 85 (2006): 153-173.
[19] Savvas, Dimitrios , G. Stefanou , and M. Papadrakakis . "Determination of RVE size for random composites with local volume fraction variation." Computer Methods in Applied Mechanics & Engineering 305.jun.15(2016):340-358.
[20] Omairey, et al. "Development of an ABAQUS plugin tool for periodic RVE homogenisation.".
[21] Catalanotti, G . "On the generation of RVE-based models of composites reinforced with long fibres or spherical particles." Composite Structures 138.mar.(2016):84-95.
Document information
Published on 25/01/24
Accepted on 04/01/24
Submitted on 20/10/23
Volume 40, Issue 1, 2024
DOI: 10.23967/j.rimni.2024.01.002
Licence: CC BY-NC-SA license
Share this document
claim authorship
Are you one of the authors of this document?

