| Line 473: | Line 473: | ||
|- | |- | ||
| - style="padding-top:10px;"| | | - style="padding-top:10px;"| | ||
| − | [[File:Draft_Samper_308636645_8237_Fig7_2.png| | + | [[File:Draft_Samper_308636645_8237_Fig7_2.png|600px]] |
|- style="text-align: center; font-size: 75%;" | |- style="text-align: center; font-size: 75%;" | ||
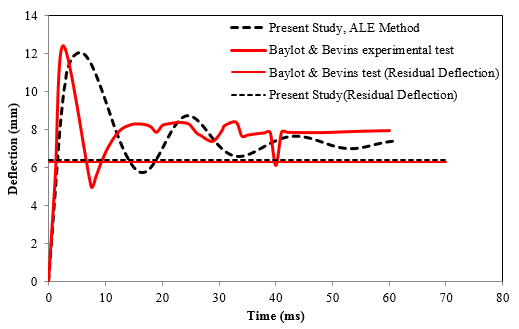
| colspan="1" style="padding-bottom:10px;"| '''Figure 7.''' Mid-height deflection time history [23]. | | colspan="1" style="padding-bottom:10px;"| '''Figure 7.''' Mid-height deflection time history [23]. | ||
Revision as of 10:31, 11 December 2017
Abstract
In recent years, many studies have been conducted by governmental and nongovernmental organizations across the world in an attempt to better understand the effect of explosive loads on buildings in order to better design against specific threats. This study is intended to contribute to increase the knowledge about how explosions affect reinforced concrete (RC) columns. In this study, a nonlinear model is developed to study the blast response of RC columns subjected to explosive loads. Numerical modeling of RC column under explosive load is presented using advanced finite element code LS DYNA. The obtained numerical model is validated with the experimental test and the results are in substantial agreement with the experimental data. ALE method for blast analysis is presented in the current research. The effects of scaled distance on the damage profile of RC columns are investigated. The results demonstrate that the level of damage increased with describing the scaled distance. Also the results shown duration for the blast loading, and hence the impulse, varies with charge masses at the specified scaled distance. Higher magnitude charge masses produced longer blast loading durations than lower magnitude charge masses. This means that at the same scaled distance, a charge mass of higher magnitude produced a higher impulse than the lower magnitude charge mass. The findings of this research represent the scaled distance is an important parameter that should be taken into account when analyzing the behavior of RC columns under explosive effects. The data collected from this research are being used to improve the knowledge of how structures will respond to a blast event, and improve finite element models for predicting the blast performance of concrete structures.
1. Introduction
Reinforced concrete (RC) columns are essential structural elements to any type of structure and assessment of reinforced concrete (RC) columns against blast loads and prediction of suitable structure to withstand blast loads plays vital role in construction field. In recent years, the number of terrorist attacks by bombs has increased dramatically around the world. Many buildings have been destroyed and a lot of people have been killed during these attacks. While the issue for the protection from bomb blasts has been considered in the past in the military, no sufficient attention has been paid for civilian structures. In the case of reinforced concrete elements, research and development has made great progress in recent years for the behavior of several cases such as reinforced concrete slabs, beams and columns, i.e. [1-6] and many more. Of all components in a structure, columns may be the most critical ones as they carry the most amount of the structural component. In the past, they were generally not designed to sustain large lateral dynamic loads such as blast loading and, for that reason, are very susceptible to terrorist attacks. For this reason, the need to better understand column behavior quickly became clear in the field of progressive collapse.
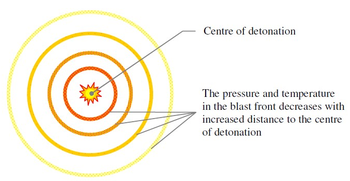
A structure subjected to an explosion will have a complex behavior. Good knowledge about the properties of the load, the material response, the dynamical behavior of the structure and analytical tools is necessary in order to analyses the response of the structure. Blast loading and its effects on a structure is influenced by a number of factors including charge weight, W location of the blast (or standoff distance), R and the geometrical configuration and orientation of the structure (or direction of the blast). RC columns response will differ according to the way these factors combine. Therefore, it is necessary to identify the influence of each factor on the blast response of RC columns. When the charge detonates, a blast wave with high pressure and temperature will spread out from the center of the detonation as shown in the Figure 1. The pressure will decrease with increasing distance from the detonation center and the pressure front, referred to as the blast wave, will travel in supersonic speed. A blast wave consists of a positive and a negative phase and an idealized wave.
|
| Figure 1. Schematic contour of detonation in air. |
Experimental test and finite element analysis are the two methods to design of RC columns when subjected to blast loads. Experimental studies of blast problems require special and expensive instrumentation given the highly dynamic or impulsive nature of the loading. Large-scale blast tests can cost millions of dollars [7]. Numerical simulation of blast experiments is the most widely used approach to verify a design for a specific threat as it offers great capabilities [8-10]. The use of finite element models allows a variety of structures and retrofit materials to be evaluated with relatively low expense in a much shorter time frame. LS-DYNA is an advanced finite element code for analyzing the large deformation dynamic response of structures. The significance of using LS-DYNA for simulations, finite element model, boundary conditions, constitutive material models and blast load application is described in the current study.
2. Development of Model and Numerical Simulation
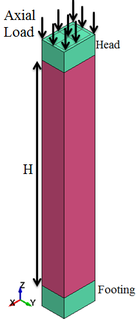
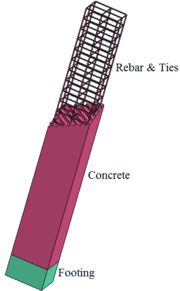
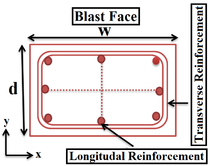
The model used for this study is shown in the Figure 2. The cross section of the column is 500mm 700mm rectangular with 8 longitudinal reinforcements of mm. The model is 4400 mm height with a transverse reinforcement of mm. LS-DYNA element library consists of a huge variety of element types. In this study, 8-nodes constant stress solid elements with 1-point quadrature integration are employed to model the concrete members with the mesh size of 50 mm. The 2-node Hughes-Liu beam element with Gauss quadrature integration is employed for modelling steel reinforcements with the mesh size of 50 mm. The interface between concrete and steel is modeled using the Contact-1D formulation such that the nodes in the steel element are modeled dependent of the nodes in the concrete element. In this study the column is fixed at the footing and heading to prevent any translational movement ( direction) at their base except for the top nodes which are released to have translation in the direction of the applied load ( direction). Ramp loading was implemented to avoid high stress concentration at the loading zone at the top of the column. The material data used in this study is presented in Table 1 for the concrete and the reinforcement respectively.
|
|
|
| Figure 2. Details of RC column. | ||
| Material | Parameters | Value |
| Concrete | Concrete strength | 42 MPa |
| Mass density | 2400 kg/m3 | |
| Poisson's ratio | 0.2 | |
| Tensile stress at failure | 6.0 MPa | |
| Steel reinforcement | Young's Modulus | 200 GPa |
| Longitudinal steel strength | 460 MPa | |
| Transverse steel strength | 250 MPa | |
| Mass density | 7800 kg/m3 | |
| Poisson's ratio | 0.3 | |
| Plastic strain at failure | 0.18 |
3. Blast Loads Simulation using ALE Method
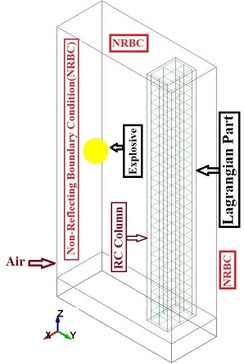
LS-DYNA mainly uses explicit time integration to solve nonlinear dynamic problems, e.g. explosions/blast loading. ALE method for blast analysis is presented in this part. With this method we can see the formation and the propagation in air of the blast wave. In this model we have 4 parts including two ALE parts that are the air and the explosive and two Lagrangian parts that are the column and the ground. When there is more than one ALE part we have to define each part in the section called ALE multi material group part with element formulation 11. The ALE formulation combines the Lagrangian and Eularian frames of reference to resolve the technical difficulties that each experience through an advection steps.
Fluid structure interaction (FSI) is modeled in LS-DYNA using the CONSTRAINED LAGRANGE IN SOLID option. The explosive can be contained within the air mesh by specifying an initial fraction of the air volume occupied by the explosive through the INITIAL VOLUME FRACTION GEOMETRY option in LS-DYNA. This option is used in conjunction with the ALE multi-material formulation. The explosive geometry can be specified to be of a sphere, a cylinder or a cube. The field of the air needs the BOUNDARY NON REFLECTING conditions, in order to not have the reflection of the wave at the end of the ALE boundaries. Configurations of blast loads in the numerical model are shown in the Figure 3. Information on blast load parameters is available from the standard sources [11-14].
|
| Figure 3. Explosive modeling using ALE method. |
4. Material Models
In this study five material models are established with the real behaviour under blast load. The concrete damage model designated as MAT_72_R3 in LS-DYNA is used to simulate concrete [8, 15]. For modelling of the steel reinforcement, the MAT PIECEWISE LINEAR PLASTICITY material model in LS-DYNA was adopted [16]. Air is modeled with 8 nodes finite elements using the hydrodynamic material model MAT NULL and the ‘Linear Polynomial’ EOS. The air material is assigned to follow Ideal Gas equation of state. The ideal gas EOS relates the pressure to the specific internal energy in such a way that it follows the following equation. For solids elements equation of state can be called trough this material model to avoid deviatoric stress calculation. The air can be treated as a perfect gas, described by a linear polynomial equation of state, with pressure depending on density and internal energy (). The pressure related to the energy can be expressed as follows:
|
(1) |
|
(2) |
where , , , , , and are constant, is the ratio of current density and is the initial internal energy per volume [17].
For the material model of the explosive, in this case TNT, the HIGH EXPLOSIVE BURN material model has chosen with 8th node finite elements [18]. The JWL equation of state (EOS) is used in the current research. JWL is the most popular and is easily calibrated EOS which used in this study. The JWL equation is the pressure-volume relationship on the expansion isentropic. The pressure is represented as a function of volume and energy . The JWL equation is the pressure-volume relationship on the expansion isentrope and is given by
|
|
(3) |
where are linear explosion parameters; , and are nonlinear explosion parameters; is the relative volume and is specific internal energy of every unit of mass, is the pressure of the detonation products of high explosives.Material properties of concrete, steel reinforcement, explosive and air are given in the Table 2.
| Units(g,mm,ms,MPa) | ||||||||
| *MAT_CONCRETE_DAMAGE_REL3(Concrete) | ||||||||
| RO | fc | PR | ||||||
| 0.0024 | 40 | 0.2 | ||||||
| *MAT_PIECEWISE_LINEAR_PLASTICITY(Reinforcement) | ||||||||
| RO | E | PR | fy | |||||
| 0.0078 | 2e+005 | 0.3 | 460 | |||||
| *MAT-HIGH-EXPLOSIVE-BURN(Explosive) | ||||||||
| RO | D | PCJ | ||||||
| 0.00163 | 6930 | 2.1e4 | ||||||
| *EOS-JWL(Explosive) | ||||||||
| A | B | R1 | R2 | w | V0 | E0 | ||
| 3.712e5 | 3231 | 4.15 | 0.95 | 0.3 | 7000 | 1 | ||
| *Mat-NULL(Air) | ||||||||
| RO | PC | MU | ||||||
| 1.225e-6 | -1e-5 | 8.5e-10 | ||||||
| *EOS-LINEAR POLYNOMIAL(Air) | ||||||||
| C0 | C1 | C2 | C3 | C4 | C5 | C6 | E0 | V0 |
| 0 | 0 | 0 | 0 | 0.4 | 0.4 | 0 | 0.25 | 1 |
5. Strain Rate Effect
Materials such as steel and concrete exhibit greater strength when loaded at high rates and standards and manuals for blast-resistant design allow nominal component strengths to be increased by Dynamic Increase Factors to account for rate effects. In order to investigate reinforced concrete elements under blast loading conditions, strain rate effect must be considered.
5.1 Concrete Strain Rate
Dynamic increase factors for concrete were applied on the materials stress-strain curve to properly capture the dynamic effect onto the material behavior. The ability of concrete to increase in strength as the strain rate increases is sometimes referred to as the dynamic increase factor (DIF). The DIF is a function of the compressive or tensile strength at high strain rates versus the compressive or tensile strength of the concrete at static testing strain rates. In the current research, The dynamic increase factor for the tensile strength of concrete is presented by Malvar and Ross [19] that is presented as follows.
|
|
(4) |
|
|
(5) |
where is the dynamic tensile strength and the static tensile strength
|
|
(6) |
|
|
(7) |
where is the static uniaxial strength of concrete (in MPa) and 10 MPa.
The dynamic increase factor(DIF) for compression is typically determined by CEB[20] as follows:
|
|
(8) |
|
|
(9) |
where is the dynamic compressive strength, the static compressive strength and the static cube strength
|
|
(10) |
|
|
(11) |
5.2 Steel Reinforcement Strain Rate
The stress-strain behavior of steel is particularly sensitive to the loading rate and this phenomenon is known as strain rate sensitivity. As far as energy absorption is concerned, the strain rate sensitivity plays an equally important role to that of the inertia effect of the material. It clearly reflects from the load-displacement curve of the material, which was tested under various uniaxial compression strain rates [21]. The Dynamic Increasing Factor (DIF), which is defined as the ratio of the dynamic to static yield stress, was used to represent the influence of strain rate on strength enhancement under dynamic conditions. To derive these equations Malvar [22] used several test results available in the literature. For determining the yield strength and ultimate strength for reinforcing bars at different strain rates, he proposed the following formulation of the DIF:
|
|
(12) |
where is the steel yield strength
|
|
(13) |
|
|
(14) |
6. Verification of Numerical Models
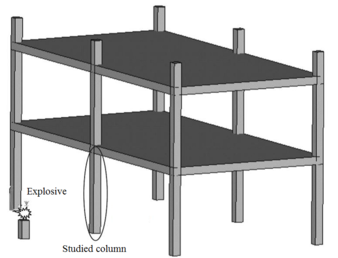
Numerical simulations need to be validated against experimental test cases to build confidence in the predictive capability of a model as well as to ensure that the accuracy and precision of a model falls within the required error corridor. In this study column design was chosen based on previous research conducted by Baylot and Bevins [23] on reinforced concrete columns under explosive loads. Experimental investigations comprised a series of five different two story RC building models. Hemispherical C4 charges are placed in front of the center column as shown in Figure 4. The center column served as the test column and is scaled appropriately to represent an exterior column. However, the detailed study is confined to the exterior middle columns directly subjected to near field blast pressure.
|
| Figure 4. Schematic diagram of column position. |
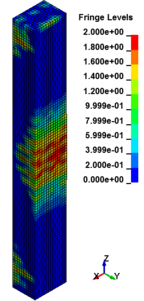
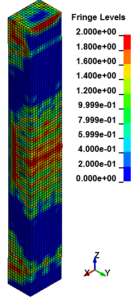
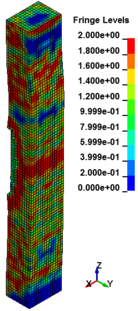
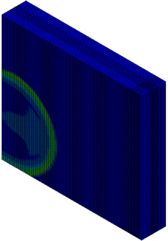
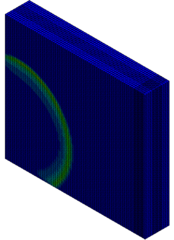
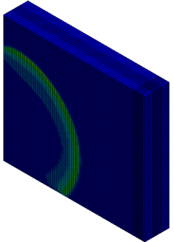
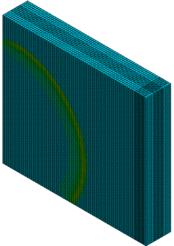
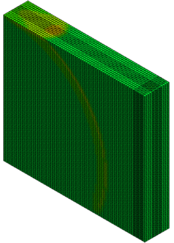
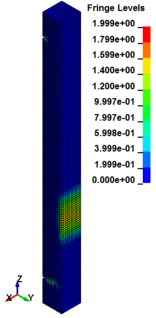
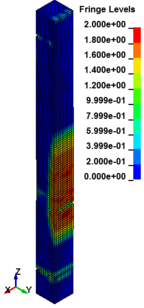
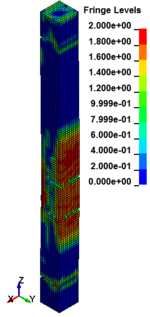
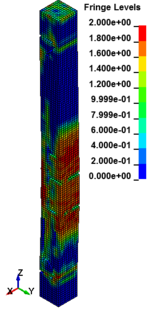
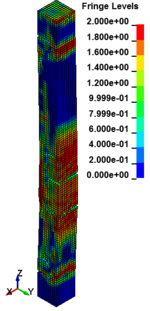
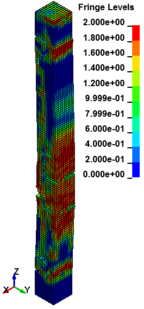
The column cross section was mm and the column free span length was 935 mm. Eight longitudinal rebar with the diameter of 7 mm was placed in the column. The longitudinal reinforcements were closed with stirrups with diameter of 3.35 mm. The average unconfined concrete strength was 42 MPa. The average density of the concrete is 2068 kg/m and modulus of elasticity 28.7 GPa. Steel reinforcements with an average yield stress of 450 MPa for longitudinal rebar and 400 MPa for transvers rebar were used. The cover is 8.5 mm. The blast loads parameters for experiment Number 02 were generated using 7.087kg of explosive C4 positioned with a standoff distance of 1.07m from the exterior column and 0.2286m above the ground. Figure 5 represents the pressure wave propagation at different stage of times. As shown in the Figure 5, in a first time, the presence of the reacted explosive is very important, so that there is a region near the explosive at very high pressure. Going forward in time we can see that this high pressure region quickly dissolves, and the shock-wave propagates. The other thing that it is possible to see is the peak of the overpressure. We can clearly see that the pressure in the shock front decrease rapidly as a function of the distance of the detonation. Figure 6 illustrates the damage state of the column at different stages of time following the blast by use of an effective plastic strain variation.
|
|
|
|
|

|
| Figure 5. FSI-Column contour of pressure wave propagation at different times | ||
|
|
|
|
|
|
| Figure 6. Effective Strain Diagrams at Different Stages of Time. | ||
Figure 7 shows peak displacement results obtained from current study and Baylot and Bevins study [23]. The peak displacement estimated in the current study was 12 mm while the peak displacement in the Baylot and Bevins [23] was 12.5 mm. the residual displacement computed in the current study and experimental study was 6.3 mm. The results show that the numerical model has a high level of agreement with experimental results done by Baylot and Bevins [23].
| Figure 7. Mid-height deflection time history [23]. |
7. Blast Response of RC Columns
In this study, the effects of explosive loads on the RC columns are determined. A series of simulations are presented to dynamic assessment of RC columns subjected to blast detonations. In these case studies, the column depth, width and height are 500 mm, 700 mm and 4400 mm respectively. There are eight longitudinal reinforcements with diameter of 25 mm placed on the cross-section, the stirrup reinforcement rebar has a diameter of 12 mm, and spaced at 200 mm between stirrup reinforcements along the column height. Concrete with compressive strength of 42 MPa and longitudinal and transverse steel reinforcement with yield stress of 460 and 250 MPa are used. The calculation of the load on the structure may be performed using a scaling approach. The scaled distance is a function of the mass of the explosive, W, and the distance between the target and the point of detonation, R that represented by equation (15).
|
|
(15) |
7.1 Response of RC Column under Different Scaled Distance
Parametric numerical simulations of explosions are conducted to assess the effects of different scaled distances on the non-linear response of RC columns when subjected to explosive loads. The numerical analysis in this research is performed within charge weight ranges of 0.5 to 8 kg and the standoff distance is kept constant at each of these charge weights. Using equation (15), the ranges for scaled distance in the analysis are 0.25 m/kg1/3 to 0.629 m/kg1/3 that represents in the Table 3. The graphs of the displacement and pressure are presented and discussed in the following sections.
| Standoff distance | charge weight | Scaled distance |
| (mm) | (kg) | (m/kg1/3) |
| 500 | 0.5 | 0.629 |
| 1 | 0.5 | |
| 3 | 0.346 | |
| 4 | 0.314 | |
| 5 | 0.292 | |
| 8 | 0.25 |
7.2 Effect of Scaled Distance on the Damage Profile of RC Columns
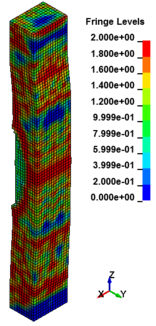
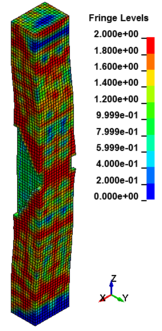
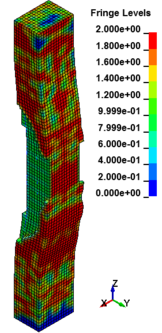
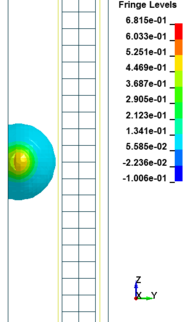
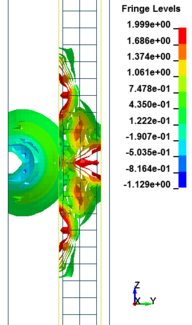
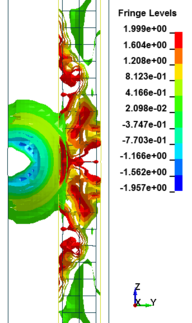
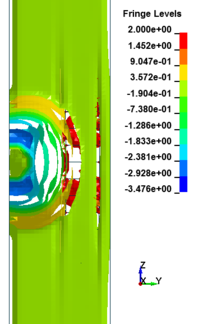
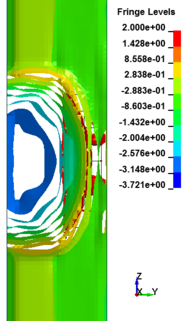
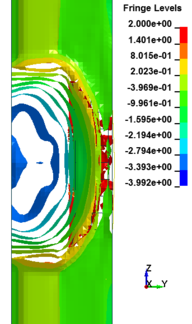
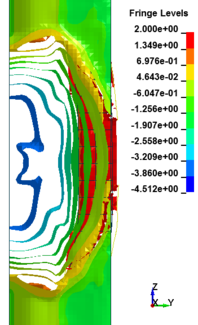
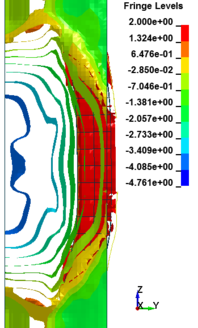
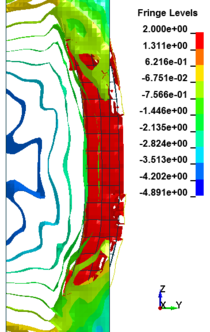
Figure 8 shows the damage profiles of RC columns when subjected to blast loads. As a result, when the RC columns are subjected to lower scaled distance, the columns sustain the severe impulsive loading. It can be observed that increasing the scaled distance in RC columns resulted in a further decrease in the damage level of RC column. At higher scaled distances, column response tends to be more flexural for all column types. The concrete core remains much more intact with less column damage. Figure 9 represents damage profile development for RC column due to detonation at different stages of time.
|
|
|
|
|
|
|
|
|
| Figure 9. Damage profile development of RC columns under different scaled distance at different stages of times. | ||
7.3 Effect of Scaled Distance on the Peak Pressure of RC Columns
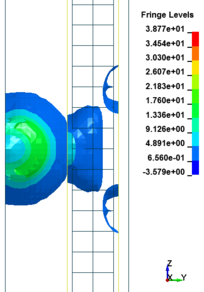
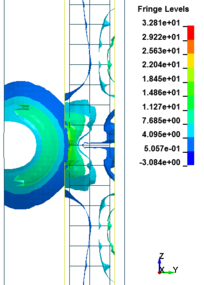
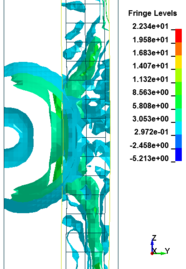
This section discusses results from comparison of the peak pressure at different elevations on the RC column for the different ranges of scaled distance. Figure 10 shows the pressure magnitudes along the height of RC columns when subjected to close-in detonations. The close-in regime is associated with the type of loading where the explosive is very close to the structure. In this case, the duration of loading is much lower than the natural period of the structure. According to Figure 10, when the RC column is under bigger magnitudes of blast detonations, the columns sustain the severe damage and the RC column withstand high impulsive loading. As can be seen from Figure 10, the pressure of the RC columns all change sharply at the height of columns.
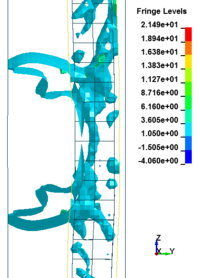
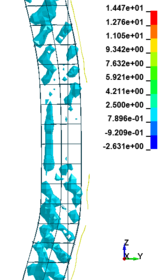
In general, as the scaled distance decreased, the intensity of the blast load along the height of the RC columns increased. Therefore a decrease in the scaled distance of the blast load results in an increase in the peak pressure. The results indicate the maximum recorded pressures increase from the lower scaled distances to the higher scaled distances. The general trend observed is that the maximum pressure occurred at the mid- height of RC columns. Figure 11 represents the pressure fringe contour magnitudes of RC columns when subjected to close-in detonations. The process of propagation of the detonation wave in air, its reflection from the column and the subsequent propagation of the reflected wave along the height of the column can be seen in the contour plots of Figure 11.

|
|
|
|
|
|
| Figure 11. Shock wave developments due to detonation at different stage of times. | ||
7.4 Effect of Scaled Distance on the Peak Displacement of RC Columns
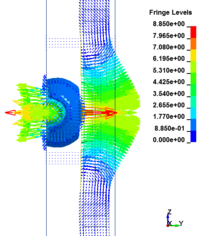
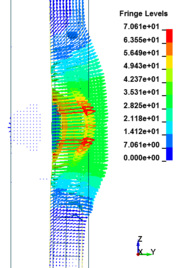
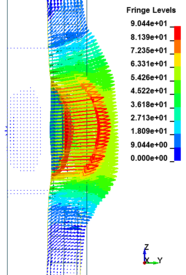
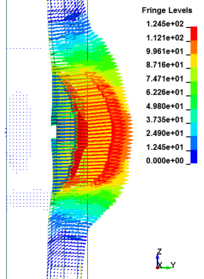
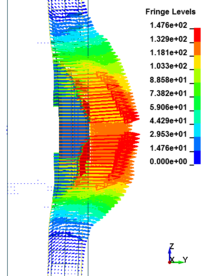
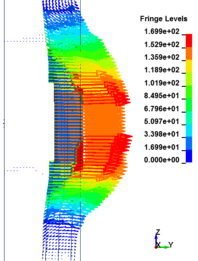
This section discusses results from comparison of the deflections at different elevations on the RC columns for different six scaled distances. Peak deflections are measured at the nearest element from detonation centre for all RC columns. Figure 12 show the peak deflection of the RC columns along the height of columns for different scaled distances. As can be seen from Figure 12, the displacement of the RC columns all change sharply at the height of columns. As a result, the intensity of the blast loads is maximum at the mid height of the columns and the columns sustain high impulsive loading. Therefore the maximum displacement of the columns occurs at the mid height of the columns. It is evaluated that at the same standoff distance, decreasing the equivalent TNT mass resulted in decreased lateral displacement and increasing the magnitude of equivalent TNT mass resulted in increased lateral displacement and much more extensive damage to the RC column. Regardless of the column height and the TNT height, the maximum displacement of the RC columns always occurs at the centre of the blast loaded area. The general trend observed is that the maximum deflections occurred at the mid- height of RC columns. Also Figure 13 represents the vector of displacement in RC columns at different stage of times when subjected to high impulsive loads.
| (a) |
| (b) |
| (c) |
| (d) |
| (e) |
| (f) |
| Figure 12. Displacement along the RC column height under different scaled Distances. (a) Z=0.629 m/kg1/3; (b) Z=0.5 m/kg1/3; (c) Z=0.346 m/kg1/3; (d) Z=0.314 m/kg1/3; (e) Z=0.292 m/kg1/3; (f) Z=0.25 m/kg1/3 . |
|
|
|
|
|
|
| Figure 13. Vector of displacement in RC columns at different stage of times. | ||
8. Conclusion
In this research intensive numerical simulations of the responses of RC columns subjected to blast detonations have been carried out. The numerical modelling of blast load performed using advanced finite element code LS-DYNA. In this study the finite element models validated by comparing the numerical analysis with the experimental field test available in the literature. It can be observed that decreasing the scaled distance in RC columns resulted in a further increase in the damage level of RC columns. When the RC columns are subjected to lower scaled distance, the columns sustain the severe impulsive loading. Therefore a decrease in the scaled distance of the blast load results in an increase in the peak pressure and increase lateral displacement of RC columns. The findings of this research represent the scaled distance is an important parameter that should be taken into account when analysing the behaviour of RC columns under explosive effects.
Acknowledgments
The authors would like to thank Universiti Kebangsaan Malaysia for financial support under grant ERGS-1-2013-PK04-UKM-02-1and FRGS-1-2015-TK01-UKM-02-4.
References
[1] J. Xu, C. Wu, H. Xiang, Y. Su, Z.-X. Li, Q. Fang, et al., Behaviour of ultra high performance fibre reinforced concrete columns subjected to blast loading, Engineering Structures, vol. 118, pp. 97-107, 7/1/ 2016.
[2] L. M. Wijesundara and S. K. Clubley, Numerical modelling of reinforced concrete columns subject to coupled uplift and shear forces induced by internal explosions, Structure and Infrastructure Engineering, vol. 12, pp. 171-187, 2016.
[3] R. Codina, D. Ambrosini, and F. de Borbón, Experimental and numerical study of a RC member under a close-in blast loading, Engineering Structures, vol. 127, pp. 145-158, 2016.
[4] M. Campidelli, M. Tait, W. El-Dakhakhni, and W. Mekky, Numerical strategies for damage assessment of reinforced concrete block walls subjected to blast risk, Engineering Structures, vol. 127, pp. 559-582, 2016.
[5] B. Yan, F. Liu, D. Song, and Z. Jiang, Numerical study on damage mechanism of RC beams under close-in blast loading, Engineering Failure Analysis, vol. 51, pp. 9-19, 2015.
[6] Y. Shi and M. G. Stewart, Damage and risk assessment for reinforced concrete wall panels subjected to explosive blast loading, International Journal of Impact Engineering, vol. 85, pp. 5-19, 11// 2015.
[7] J. Zukas, Introduction to hydrocodes. Vol. 49, Elsevier, 2004.
[8] X. Bao and B. Li, Residual strength of blast damaged reinforced concrete columns, International journal of impact engineering, vol. 37, pp. 295-308, 2010.
[9] A. A. Mutalib and N. Bakhary, Empirical Formulae To Predict Pressure And Impulsive Asymptotes For P–I Diagrams Of RC Columns Strengthened With FRP, Jurnal Teknologi, vol. 55, pp. 27–38, 2011.
[10] A. A. Mutalib, N. M. Tawil, S. Baharom, and M. Abedini, Failure Probabilities of FRP Strengthened RC Column to Blast Loads, Jurnal Teknologi, vol. 65, pp. 135-141, 2013.
[11] W. Baker, P. Cox, P. Westine, J. Kulesz, and R. Strehlow, Explosion hazards and evaluation., Amsterdam, New York, Elsevier Scientific Pub. Co., 1983.
[12] UFC-3-340-02, Design of structures to resist the effects of accidental explosions, ed. US Army Corps of Engineers, Naval Facilities Engineering Command. Air Force Civil Engineer Support Agency, Dept of the Army and Defense Special Weapons Agency, Washington DC, 2008.
[13] UFC-4-010-01, minimum antiterrorism standards for buildings, ed. Washington DC: US Army Corps of Engineers, Naval Facilities Engineering Command. Air Force Civil Engineer Center, US.Department of Defense, 2013, p. 111.
[14] TM5-1300, Structures to resist the effects of the accidental explosions. In Technical Manual ed: US Department of Army, Picatinny Arsenal, New Jersey, 1990.
[15] H. M. I. Thilakarathna, D. Thambiratnam, M. Dhanasekar, and N. Perera, Numerical simulation of axially loaded concrete columns under transverse impact and vulnerability assessment, International Journal of Impact Engineering, vol. 37, pp. 1100-1112, 2010.
[16] A. A. Mutalib and H. Hao, Numerical analysis of FRP-composite-strengthened RC panels with anchorages against blast loads, Journal of Performance of Constructed Facilities, vol. 25, pp. 360-372, 2010.
[17] LS-DYNA, Keyword User's Manual V971,CA: Livermore Software Technology Corporation(LSTC), Livermore, California, ed, 2015.
[18] M. H. Mussa, A. A. Mutalib, R. Hamid, S. R. Naidu, N. A. M. Radzi, and M. Abedini, Assessment of damage to an underground box tunnel by a surface explosion, Tunnelling and Underground Space Technology, vol. 66, pp. 64-76, 2017.
[19] L. Malvar and C. Ross, Review of strain rate effects for concrete in tension, American Concrete Institute Materials Journal, vol. 95(6), pp. 735-9, 1998.
[20] C. e.-i. d. béton, CEB-FIP model code 1990: design code, Telford, 1993.
[21] K. Marsh and J. Campbell, The effect of strain rate on the post-yield flow of mild steel, Journal of the Mechanics and Physics of Solids, vol. 11, pp. 49-63, 1963.
[22] L. J. Malvar, Review of static and dynamic properties of steel reinforcing bars, ACI Materials Journal, vol. 95, 1998.
[23] J. T. Baylot and T. L. Bevins, Effect of responding and failing structural components on the airblast pressures and loads on and inside of the structure, Computers & Structures, vol. 85, pp. 891-910, 2007.
Document information
Published on 03/01/18
Accepted on 04/12/17
Submitted on 05/12/17
Volume 34, Issue 1, 2018
DOI: 10.23967/j.rimni.2017.12.001
Licence: CC BY-NC-SA license
Share this document
Keywords
claim authorship
Are you one of the authors of this document?
