(Created page with " ==Abstract== The energy supply characteristic of a proton-exchange membrane fuel cell for houses is strongly influenced in a hydrogen supply unit. Therefore, a bioethanol r...") |
m (Scipediacontent moved page Draft Content 185575519 to Obara 2014a) |
(No difference)
| |
Latest revision as of 14:10, 1 June 2017
Abstract
The energy supply characteristic of a proton-exchange membrane fuel cell for houses is strongly influenced in a hydrogen supply unit. Therefore, a bioethanol reforming system (FBSR) with a sunlight heat source is developed as a potential fuel supply system for distributed fuel cells. However, the temperature distribution of a catalyst layer in the reactor is not stable under conditions of unstable solar radiation and unstable outside air temperature; as a result, it is thought that the inversion ratio (the percentage of hydrogen obtained from ethanol) of a reforming reaction will decrease. In this paper, heat transmission analysis was used in the catalyst layer of the reformer of FBSR, and the fundamental performance of FBSR was investigated. Fluctuations of the solar insolation over a short period of time affect the hydrogen-generating rate of FBSR. Moreover, the amount of hydrogen production of FBSR was simulated using meteorological data from a day in March and a day in August in a cold region (Sapporo in Japan). In this research, the relation between the collected area of a solar collector and the energy supply to an individual house was obtained.
Introduction
Solar reforming using solar energy needs to be developed for the realization of clean energy. Recently, solar reforming systems, such as methanol, methane, and natural gas, have been investigated [1-7]. We examine a system using the heat obtained from a small sunlight solar collector to reform bioethanol into a vapor FBSR (fuel cell system with bioethanol solar reforming system). We propose that hydrogen will be produced when installing FBSR in individual houses and apartments [8], and we aim to use a layered neural network as the weather forecast information [9, 10]. Generally, a fuel inversion ratio is obtained by using the temperature of the catalyst layer and the space velocity of the bio-ethanol vapor. Unsteady-state heat analysis is introduced into the catalyst layer. From this analysis, the distribution of temperature, inversion ratio, and process gas composition is investigated. From these results, the hydrogen production rate in the unsteady-state of FBSR is obtained. The solar insolation input into the receiver surface of the FBSR reactor that is filled up with the catalyst fluctuates according to the weather. The amount of hydrogen production of FBSR is influenced by solar insolation fluctuation over a short time period. Accordingly, if the solar irradiance input into the receiver surface of the FBSR reactor fluctuates many times in a short period, the time period of the reforming reaction will not be enough. Therefore, the amount of hydrogen production of FBSR changes with characteristics of the fluctuation of solar insolation. The purpose of this study was to investigate the characteristics of the amount of hydrogen production and the efficiency of the reformer under circumstances of global solar radiation with fluctuating inputs. Furthermore, the performance concerning supply of power and heat by a FBSR to an individual house in Sapporo in Japan is investigated. From these results, the efficiency of the system and the rate of use concentrated solar energy are examined.
System Scheme
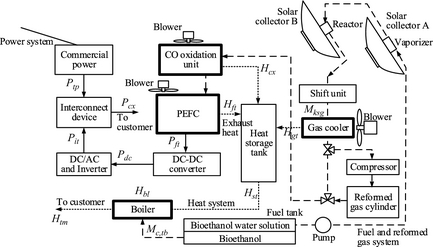
Figure 1 shows a block diagram of the fuel cell system with a bioethanol solar reforming system (FBSR) [8-10]. Two rotating parabolic mirrors with a solar tracking system are used for FBSR. In the following sentences, these rotating mirrors are called solar collector A and B. The high-density solar energy collector A is used for evaporation of a bioethanol fuel. The solar energy collected by solar collector B is used as the heat source for reforming of this fuel vapor.
|
|
|
Figure 1. Block diagram. |
In order to store hydrogen, the storage tank of the reformed gas is installed in the system. While compressing and storing the reformed gas, it removes the water vapor in the gas using a cooler. The gas is not generated by supplying a fuel cell with solar radiation. To export power to the commercial power grid (with a regular frequency and voltage), the output of the fuel cell is converted with a DC–DC converter and an inverter. The exhaust heat from the gas cooler, the fuel cell, and the CO oxidization equipment (Fig. 1) is stored in the heat medium (antifreezing solution) of the heat storage tank. The heat medium of the heat storage tank described in the top is supplied to a boiler; exhaust heat is supplied to the demand side of the FBSR. When the supplied solar heat is insufficient, a boiler is operated. The fuel consumption of the boiler is reducible by recovery of exhaust heat. Moreover, the heat supply to the demand side can be made to follow the fluctuation of load.
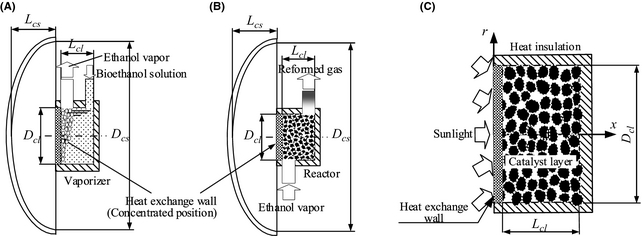
The reformer is shown in Figure 2. Figure 2A and B is solar collector A and B, respectively. A vaporizer is installed in solar collector A and ethanol fuel evaporates in this container. On the other hand, solar collector B changes ethanol vapor into reforming gas with much hydrogen composition. Solar collector B has a diameter Dcs and width Lcs. The reactor is installed in the concentrated position (it is shown in Fig. 2A and B). The heat collected using the solar collector is supplied to the catalyst layer through the end of the reactor with area Ahs (heat-supply surface). Ethanol fuel is converted into vapor beforehand using the vaporizer. It supplies this vaporized fuel to the heat-supply surface side of the reactor. In this paper, the vaporized fuel supplied to the catalyst layer is described as process gas. Process gas is reformed into gas with high hydrogen content by the catalyst layer. Because the reformed gas contains CO, a shift component and a CO oxidation component are installed.
|
|
|
Figure 2. PEM fuel cell system with bioethanol-solar-reforming (FBSR) (A) solar collector A, (B) solar collector B, and (C) catalyst installed into the reactor. |
Analysis Procedure
Heat transfer of the reactor
Model of the catalyst layer and reforming reaction
Figure 2C shows the model of the catalyst layer in the reactor. The reactor has the geometry of a cylinder and it is filled up with the spherical reforming catalysts that are several millimeters in diameter. The heat collected with solar collector B is transferred to the heat-supply surface of the reactor, thus heating the catalyst layer. However, as shown in Figure 3, part of the solar insolation incident on the heat-supply surface is discharged into the ambient air by convective heat transfer qcon (eq. (1)) and radiative heat transfer qrad (eq. (2)). All of the sides of the reactor except the heat-supply surface are insulated. In the catalyst layer, heat is transferred to the reforming reaction by heat conduction of the catalyst particles, and the heat convection of process gas. When the catalyst in the reactor is distributed uniformly, the reaction rate in the whole catalyst is regulated by the space velocity of process gas, temperature distribution, pressure, etc. So, in this paper, the heat transfer between catalyst particles is handled as heat conduction of a catalyst layer. Therefore, the temperature of the catalyst layer is calculated with the convective heat transfer of process gas, the heat conduction of the catalyst layer, and reaction heat (endotherm).
|
|
(1) |
|
|
(2) |
|
|
|
Figure 3. Input and output on the heat exchange wall of the reactor. |
Heat transport in the catalyst layer
The heat transport in the catalyst layer [11] is calculated from equation (3) using the Da number (Damkohler) correction. The right-hand side of equation (3) contains terms relating to the convection and chemical reaction of the process gas. Nu, Re, and Da are calculated by equations (4)–(6), respectively. The flow of the process gas in the reactor chamber is treated as turbulence. The magnitude of the turbulence of the flow can be known by equation (5). Furthermore, the heat transfer rate of turbulence is calculated by equation (6).
|
|
(3) |
|
|
(4) |
|
|
(5) |
|
|
(6) |
Reforming reaction
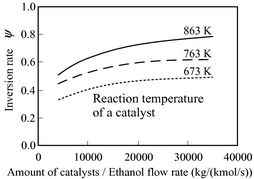
Equation (7) expresses the vaporization reforming reaction of ethanol. There are several reaction paths but only the reaction in equation (7) is taken into consideration in this paper. The percentage of hydrogen obtained from ethanol (inversion ratio) differs with catalyst temperature and the space velocity of ethanol/water vapor. Figure 4 shows the experimental result of the ethanol vapor reforming using a commercial catalyst in Akpan et al. [12]. Figure 4 shows the relations between the amount of catalyst per flow rate (modified contact time) of ethanol, the temperature of the catalyst layer, and the inversion ratio. Figure 4 indicates that the inversion ratio is so large that there are several different catalyst fillings. Furthermore, the inversion ratio is so large that temperature of the catalyst is high.
|
|
(7) |
|
|
|
Figure 4. Catalyst performance. |
Basic formula
Equation (8) is the heat diffusion equation in the catalyst layer. Here, T is the temperature of the catalyst layer, r is the radial coordinate in the catalyst layer, and x is the coordinate in the direction of the axis of the catalyst layer. The amount of heat consumed by the reaction in the catalyst layer is represented by qr, ρc, Cc, and λc in the right-hand side of equation (8). They represent the density of the catalyst, specific heat, and heat conductivity, respectively. t is sampling time. The space element used for numerical modeling consists of an element with spatial dimensions in the direction of r, and the direction of x, for the catalyst layer with cylindrical shape shown in Figure 3. In this paper, the following assumptions are introduced into analysis using a two-dimensional model:
- The catalyst and process gas are in local thermal equilibrium.
- The temperature dependence of physicality property values are taken into consideration.
- The flow velocity of process gas is uniform in cross section.
- The pressure loss of the process gas is disregarded.
A discretizated version of equation (8) is solved under the assumptions of equations (1)-(4), where the boundary conditions are given in equations (9), (10), (10). Then the temperature distribution of the catalyst layer is calculated. Central differences are used in the discretized equation. The mass flow rate of the process gas is calculated using equation (12); and the boundary conditions in this case are equations (13) and (14). ug in equation (12) is the volume flow rate of process gas and ρg is the mean density. u0 in equation (14) is the volume velocity of the fuel vapor in the entrance of the catalyst layer. u0 is the volume flow rate of the fuel vapor divided by the cross-sectional area of the catalyst layer. Equation (15) expresses the amount of heat consumed by the reaction created by the reforming reaction. gg, ψ, and Hr in the equation are the molar flow rate, the inversion ratio, and the reaction heat of process gas, respectively. If the temperature T of the catalyst layer is given, then the inversion ratio ψ will be obtained from the performance of the catalyst. Because Hr is determined by the reaction of equation (7), if gg is given, we can calculate the amount of heat consumed by the reaction qr with the reforming reaction.
|
|
(8) |
|
|
(9) |
|
|
(10) |
|
|
|
|
(11) |
|
|
(12) |
|
|
|
|
(13) |
|
|
(14) |
|
|
(15) |
Analysis procedure
The model of the catalyst layer is shown in Figure 5. The element number of the catalyst layer is expressed by elx,r (with , ). First, the surface temperature Ths of the heat-supply surface of the reactor is calculated. Ths is calculated from heat capacity of the heat-supply surface, the input heat of solar insolation qs, and heat release by convective heat transfer qcon and radiation heat transfer qrad (eqs. (1) and (2)). The temperature distribution (Tx,r ) of the catalyst layer is obtained by introducing a calculus of finite differences into equation (8) under boundary-conditions equations (9)–(11). The Gauss Seidel method is used to check for convergence of the calculus of finite differences. Once the temperature distribution Tx,r is calculated, the inversion ratio (ψx,r ) in each element will be found from the relations of the catalyst performance and temperature which are shown in Figure 4. According to this ψx,r , the amount of heat consumed by the reaction (qr,x,r ) created by the reforming reaction of the process gas is obtained from equation (15). From the relations shown in Figure 5, the gas composition in the outlet of element elx−1,r can be calculated from the composition of the process gas in element elx,r of the outlet. The temperature distribution (Tx,r ) of the catalyst layer is again calculated using the result of the amount of heat consumed by the reaction created by the reforming reaction. This calculation is iterated to convergence of the discretization equation of equation (8). At each sampling time, the same convergence calculation is carried out and the convergence solution at Tx,r is obtained. Once the convergence solution at Tx,r in each sampling time is obtained, the inversion ratio distribution and distribution of gas composition will be determined.
|
|
|
Figure 5. Change in the composition of process gas. |
Efficiency of the reformer
The efficiency of the reformer is defined by the ratio of the energy content of the produced hydrogen (higher heating value) to the solar irradiance of solar collectors A and B. Equation (16) is the formula for the efficiency of the reformer. Taking into account the generation efficiency of a fuel cell and the power consumption in auxiliary machinery, an FBSR with a reformer efficiency of 30% is highly efficient when compared with a solar cell with inversion efficiency 15%. In this research, the efficiency of the reformer is set to 30%. This value is obtained by experiments.
|
|
(16) |
Case Analysis
Specification of the reformer
In this section, we explore the introduction of the FBSR into an individual house. The specifications concerning the reformer of this FBSR are shown in Table 1. A commercial supported catalyst is used for the reforming catalyst introduced into the analysis. A support of this catalyst is spherical alumina, and the support is adsorbed in a nickel alloy. The reacting characteristics concerning the ethanol reforming experiment using this catalyst are described in Bianchini et al. [5]. In this analysis, the outside air temperature T∞ is set to 273, 293, and 308 K. The heat transfer coefficient h∞ in equation (1) is set to 10 W/m2 K, assuming natural convection. Moreover, in equation (2) gives 0.95 assuming a black body. The area Ahs of the heat-supply surface of the reactor is 0.005 m2. The diameter Dcl of the catalyst layer is 80 mm and the width Lcl is 60 mm. If the reactor is filled with reforming catalysts of a mean particle diameter 3 mm, the filling factor is 0.85.
| Length of the catalyst layer (Lcl) | 60 mm |
| Diameter of the catalyst layer (Dcl) | 80 mm |
| Particle diameter of the catalyst (Dc) | 3.0 mm |
| The number of element of x-axis (Nx ) | 30 |
| The number of element of r-axis (Nr ) | 40 |
| Density of the catalyst | 213 kg/m3 |
| Heat conductivity of the catalyst | 10 W/m K |
The transmission of the heat exchange wall of the reactor is decided to be 0.9. Moreover, the concentrated efficiency of the solar collector is 0.9. The cause of concentrated loss is mainly a distortion and the soil of the mirror plane.
Analysis conditions and operating conditions
Analysis conditions are shown in Table 2. The analysis element was set up in the direction of r and the direction of x of the catalyst layer, with spacings of 2 mm. The numbers of analysis elements were Nx = 30 and Nr = 40, respectively. The sampling interval time was 0.01 sec and the analysis is calculated for a maximum 600 sec. In the analysis of the discretization formula of equation (8), a convergence condition was set to 10−5. S/C (molar ratio of vapor to ethanol) of the ethanol fuel supplied to the vaporizer was 2.0. The modified contact time (amount of catalysts [kg]/ethanol flow rate [kmol/s]), shown on the horizontal axis in Figure 4, was set as 35,000 kg/(kmol/s). In this paper, we analyze cases of 250, 500, and 1000 W/m2 of energy incident upon the solar collector qs (where these are the amounts of global solar radiation). Although three different values were analyzed for T∞ and qs, respectively, the solution concerning arbitrary T∞ and qs was obtained using proportion interpolation.
| Each concentration area of solar collectors A and B | 1.0 m2 |
| Steam/carbon ratio | 3.0 |
| Catalyst filling factor | 0.85 |
| Sampling time | 0.01 sec |
Analysis Results
Temperature distribution of the catalyst layer
Figure 6 shows the analysis results of the temperature distribution of the catalyst layer. When solar radiation is input into the heat-supply surface, the time to reach the maximum temperature is set to 0 sec. The supply to the reactor of the fuel vapor (ethanol solution) is started at 0 sec. The temperature of the heat-supply surface with a solar irradiance of 250 W/m2 when the outdoor temperature is 293 K is about 500 K. The temperature of the heat-supply surface if the time of solar irradiance is 1000 W/m2 is about 890 K. The fuel vapor temperature of the reactor entrance was set up similar to the heat-supply surface. As the fuel inversion ratio increases, the catalyst temperature in the reactor gets higher. Therefore, the temperature distribution of the catalyst layer differs greatly, so that there is much solar radiation.
|
|
|
Figure 6. Temperature distribution in the catalyst layer. Outside air temperature 293 K. (A) After 2, (B) after 40, and (C) after 100 sec. |
Composition of the process gas
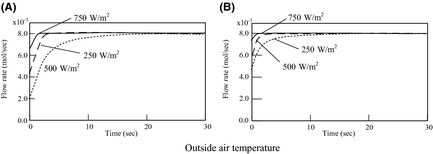
Figure 7 show the process gas composition along the x axis of the catalyst layer as predicted by the analysis. The molar flow rate of hydrogen is larger than other gases in the composition. Distribution of the molar flow rate of hydrogen, and the time at which the hydrogen flow rate becomes stable are influenced by the magnitude of the solar irradiance input into the reactor. If there is little solar irradiance and a short period of solar radiation fluctuation, the hydrogen generation rate may not reach the maximum possible. For example, when there is solar radiation fluctuation for 10 or less seconds with solar irradiance 250 W/m2, the hydrogen-generating rate is always smaller than the maximum (about 0.008 mol/s).
|
|
|
Figure 7. Flow rate of process gas in the catalyst layer. Outside air temperature 293 K. The amount of heat collection by solar collector B is (A) 250 W/m2 and (B) 500 W/m2. |
Hydrogen-generating rate
Figure 8 shows the results of the analysis for the hydrogen-generating rate as a function of sampling time. When the outside air temperature is high and there are large amounts of insolation input, a large production rate is obtained. However, in realistic weather conditions, it is expected that the solar radiation fluctuates in intervals of tens of seconds. So, data from an observed amount of global solar radiation are used, and the hydrogen-generating rate of FBSR is investigated under these realistic conditions. In this paper, data from the Japan Meteorological Business Support Center [13] is used as observational data of the amount of global solar radiation, and outside air temperature.
|
|
|
Figure 8. Flow rate of hydrogen production: (A) 273 K and (B) 308 K. |
Hydrogen-generating rate with fluctuating global solar radiation
Weather observation data
Figure 9 show the weather observation data (solar irradiance and outside air temperature) in 2007 August 23 and March 1 in Sapporo [13]. The hydrogen flow rate of FBSR is investigated using these data. In this section, proportion interpolation of solar irradiance and the outside air temperature is considered in relation to the analysis results of Figures 6-8, and the hydrogen flow rate in arbitrary weather conditions is obtained.
|
|
|
Figure 9. Weather observation at 1 min intervals in Sapporo, 2007. (A) Amount of solar radiation and (B) Outside air temperature. |
Energy balance of the FBSR
Figure 10 shows the analysis result of the power balance when introducing the FBSR into an individual house in Sapporo in Japan. Figure 11 shows the result of the purchase power of each day. The characteristics of hydrogen generation by the difference in the weather conditions shown in Figure 9 differ greatly. For that reason, the operation of FBSR is influenced greatly. By the difference in the weather conditions, the operation method of the electricity demand after 17:00 changes in particular. Accordingly, hydrogen storage is possible when there are large amounts of solar radiation in the daytime. Therefore, some of the electricity demand after 17:00 can be supplied using this stored hydrogen.
|
|
|
Figure 10. Power balance: (A) May 1, 2007 and (B) August 23, 2007. |
|
|
|
Figure 11. Amount of purchased powers: (A) May 1, 2007 and (B) August 23, 2007. |
The amount of hydrogen production, and CO2 emissions
Figure 12 shows the results of the amount of hydrogen production and CO2 emissions from the FBSR in each day. On the other hand, Figure 13 shows the results of the integration values. The hydrogen-generating rate fluctuates a lot when comparing August 23 to March 1. This is because the fluctuation characteristics of the solar insolation at 6:00 am–10:00 am differ greatly on each day as Figure 9A shows. Accordingly, it is thought that the solar insolation of this time zone on March 1 was stable. On the other hand, it is expected that much of the solar insolation on August 23 was blocked by clouds.
|
|
|
Figure 12. Amount of H2 production, and CO2 emisssions: (A) May 1, 2007 and (B) August 23, 2007. |
|
|
|
Figure 13. Total value of H2 production, and CO2 emisssions: (A) May 1, 2007 and (B) August 23, 2007. |
Performance of FBSR
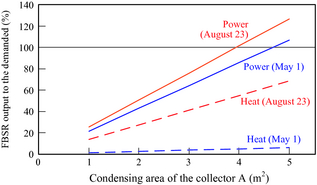
Figure 14 shows the results of the relation between the concentrated area of solar collector A, and the ratio of the output of electric power and heat from the FBSR to the amount energy demanded in the house in Sapporo. In order to cover the amount of electricity demand of the individual house. The ratios of the heat (except for boiler heating) of the FBSR to heat demand differ greatly on each day. This is because the heat demand in March is larger than in August.
|
|
|
Figure 14. FBSR output to the power or heat demanded of an individual house in Sapporo, 2007. |
Table 3 shows the results of the performance of the FBSR on March 1 and August 23. The difference in the amount of hydrogen production is small (1.17 times) when compared with the differences in the amount of global solar radiation (1.32 times). Moreover, the efficiency of the reformer on March 1 is larger than that on August 23. These results show that the fluctuation characteristics of solar irradiance have a big effect on the hydrogen-generating rate of FBSR. Accordingly, although the amount of production of hydrogen and the efficiency of the reformer change with fluctuation of solar irradiance, the efficiency of the reformer reduces if fluctuations of solar insolation occur frequently.
| March 1 | August 23 | |
|---|---|---|
| ||
| Amount of solar radiation per day by solar collectors A and B | 28.0 MJ | 37.0 MJ |
| Amount of hydrogen production per day | 100 g | 117 g |
| Efficiency of a reforming componenta | 47% | 42% |
| Amount of power demand per day | 11.2 kWh | 11.0 kWh |
| Amount of power generation per day | 2.39 kWh | 2.79 kWh |
| Amount of CO2 emissions per day | 732 g | 854 g |
| Rate of use of renewable energyb | ||
| Power | 30.7% | 27.1% |
| Heat | 16.7% | 14.8% |
| FBSR output to the power demanded | 21.4% | 25.3% |
| FBSR output to the heat demanded (except for the boiler) | 1.2% | 13.7% |
Conclusions
Power and heat are supplied by introducing FBSR with solar collectors into an individual house in Sapporo in Japan. In this study, the operation characteristics of this system were investigated by numerical analysis. As a result, the following conclusions were obtained.
- Fluctuation of solar radiation influences the hydrogen-generating rate of FBSR greatly. Accordingly, when solar irradiance is unstable, the efficiency of the reformer reduces. If fluctuations of the solar insolation are on the order of 10 sec, and they occur frequently under the same amount of global solar radiation, the amount of hydrogen production will reduce.
- The amount of hydrogen production of an FBSR was analyzed using the meteorological data of the cold district (Sapporo) on March 1 and August 23, 2007. The results showed that the efficiency of the reformer of both representative days exceeded 40%. This result shows that an FBSR can compete with the present commercial photovoltaic cells, even when taking into consideration the efficiency of a fuel cell, and power consumption of auxiliary machinery.
- When a concentrated area of solar collectors is increased, the energy power of FBSR to the energy demanded of the individual house will increase. In order to cover the total amount of power demand of the individual house in Sapporo with FBSR, a concentrated area of solar collector is 4 m2 or more. It is expected that development of the fuel supply system for fuel cells using sunlight will be investigated widely in the future.
Conflict of Interest
None declared.
References
- Kluczka, S., J. Eckstein, S. Alexopoulos, C. Vaeben, and M. Roeb. 2014. Process simulation for solar steam and dry reforming. Energy Procedia49:850–859.
- Wegeng, R., R. Diver, and P. Humble. 2014. Second law analysis of a solar methane reforming system. Energy Procedia49:1248–1258.
- Agrafiotis, C., H. Storch, M. Roeb, and C. Sattler. 2014. Solar thermal reforming of methane feedstocks for hydrogen and syngas production—a review. Renew. Sustain. Energy Rev.29:656–682.
- Gokon, N., S. Nakamura, T. Hatamachi, and T. Kodama. 2014. Steam reforming of methane using double-walled reformer tubes containing high-temperature thermal storage Na2CO3/MgO composites for solar fuel production. Energy68:773–782.
- Bianchini, A., M. Pellegrini, and C. Saccani. 2013. Solar steam reforming of natural gas integrated with a gas turbine power plant. Sol. Energy96:46–55.
- Wang, F., Y. Shuai, Z. Wang, Y. Leng, and H. Tan. 2014. Thermal and chemical reaction performance analyses of steam methane reforming in porous media solar thermochemical reactor. Int. J. Hydrogen Energy39:718–730.
- Sheu, E., and A. Mitsos. 2013. Optimization of a hybrid solar-fossil fuel plant: solar steam reforming of methane in a combined cycle. Energy51:193–202.
- Obara, S., and I. Tanno. 2007. Development of distributed energy system due to bio-ethanol PEM fuel cell with solar reforming part 1 – evaluation of basic performance. Transactions of the Society of Heating, Air-Conditioning and Sanitary Engineers of Japan123:23–32.
- Obara, S., and I. Tanno. 2008. Development of distributed energy system due to bio-ethanol PEM fuel cell with solar reforming, Part 2 – high-speed analysis of the operation plan using a neural network. Trans. Soc. Heating, Air-Conditioning Sanitary Eng. Japan130:33–42.
- Obara, S., and I. Tanno. 2007. Operation prediction of a bioethanol solar reforming system using a neural network. J. Therm. Sci. Technol.2:256–267.
- Usami, Y., S. Fukusako, and M. Yamada. 2000. Heat and mass transfer in a reforming catalyst bed (quantitative evaluation of the controlling factor by experiment). Trans. JSME Series B67:1801–1808.
- Akpan, E., A. Akande, A. Aboudheir, H. Ibrahim, and R. Idem. 2007. Experimental, kinetic and 2-D reactor modeling for simulation of the production of hydrogen by the catalytic reforming of concentrated crude ethanol (CRCCE) over a ni-based commercial catalyst in a packed-bed tubular reactor. Chem. Eng. Sci.62:3112–3126.
- Japan Meteorological Business Support Center. 2008Surface-weather-observation 1-minute data, 2007. Sapporo District Meteorological Observatory. Japan Meteorological Business Support Center, Tokyo.
Document information
Published on 01/06/17
Submitted on 01/06/17
Licence: Other
Share this document
Keywords
claim authorship
Are you one of the authors of this document?
