(Created page with "==Abstract== Hourly data of 42 rain gauges over South China during 1966–2005 were used to analyze the corresponding relation between precipitation extremes and surface air...") |
m (Scipediacontent moved page Draft Content 696499497 to Wei et al 2015a) |
(No difference)
| |
Revision as of 11:18, 15 May 2017
Abstract
Hourly data of 42 rain gauges over South China during 1966–2005 were used to analyze the corresponding relation between precipitation extremes and surface air temperature in the warm season (May to October). The results show that below 25°C, both daily and hourly precipitation extremes in South China increase with rising temperature. More extreme events transit to the two-time Clausius-Clapeyron (CC) relationship at lower temperatures. Daily as well as hourly precipitation extremes have a decreasing tendency nearly above 25°C, among which the decrease of hourly extremes is much more significant. In order to investigate the effects of rainfall durations, hourly precipitation extremes are presented by short duration and long duration precipitation, respectively. Results show that the dramatic decrease of hourly rainfall intensities above 25°C is mainly caused by short duration precipitation, and long duration precipitation extremes rarely occur in South China when surface air temperature surpasses 28°C.
Citation
Sun, W., J. Li, and R.-C. Yu, 2013: Corresponding relation between warm season precipitation extremes and surface air temperature in South China. Adv. Clim. Change Res. , 4 (3), doi: 10.3724/SP.J.1248.2013.160.
Keywords
precipitation extremes ; surface air temperature ; rainfall duration ; Clausius-Clapeyron relation
1. Introduction
Precipitation extremes, which have substantial impacts on floods, debris flow, and landslides, usually cause great personal injury and property loss. Many researches [ Allen and Ingram, 2002 ; Emori and Brown, 2005 ; Groisman et al ., 2005 ; Trenberth et al ., 2003 ] have shown that thermal conditions are closely related to the variation of precipitation extremes. Therefore, it is highly significant to study the corresponding relation between precipitation extremes and surface air temperature.
As the water-holding capacity of the atmosphere increases with temperature rising at a rate about 7% °C–1 [ Allen and Ingram, 2002 ; Trenberth et al ., 2003 , the Clausius-Clapeyron (CC) relation lays the physical foundation for the research on the relation between precipitation and temperature. Various studies [ Allen and Ingram, 2002 ; Pall et al ., 2007 ; Shaw et al ., 2011 ] have found a dependency of extreme daily precipitation on surface air temperature around the CC relation (7% °C–1 ). Using hourly rainfall data, the dependency of extreme hourly precipitation is found to be about twice as large as predicted by the CC relation at higher temperatures [ Lenderink and van Meijgaard , 2008 ]. Focusing on the applicability of the CC relation in precipitation extremes, a study found a peak-like structure where daily precipitation extremes increase with surface air temperature to a threshold temperature and then decrease with a further increase in surface air temperature [ Utsumi et al. , 2011 ].
Unlike other places in China, South China is accompanied with sufficient water vapor supply, which makes the specific humidity and relative humidity rarely change under global warming, and eventually gives both extreme rainfall amount and rainfall intensity a statistically significant increasing trend over the past 40 years [ Yu and Li , 2012 ]. Nevertheless, the corresponding relation between precipitation extremes and surface air temperature in South China is still unclear. Previous studies have mainly focused on the variation features of precipitation at different extreme levels or on the available extent of the CC equation, while few studies have analyzed the connection between rainfall duration and the above relation. Therefore, starting from extreme daily precipitation intensity and hourly precipitation intensity and combining these with rainfall duration, this paper analyzes the corresponding relation between warm season precipitation extremes and surface air temperature in South China.
2. Data and methodology
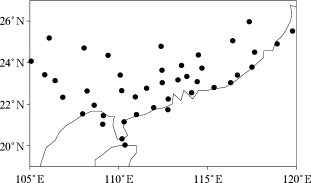
Since the interaction between precipitation and temperature is not an instant response, but an energy accumulating and system developing process, this study connects daily surface air temperature with daily precipitation and hourly precipitation in order to reflect the circulation background of rainfall events, as well as to depict its corresponding relation with temperature. According to previous partition results [ Yu and Li , 2012 ], this study selects 42 stations in South China (Fig. 1 ). The analysis is restricted to the period of 1966–2005 to acquire the mutual part of precipitation data and temperature data, and to avoid biases caused by missing data. All the data mentioned above are obtained from the National Meteorological Information Center of China Meteorological Administration.
|
|
|
Figure 1. Spatial distribution of the 42 rain gauge stations in South China used in this paper |
In previous studies on the corresponding relation between precipitation extremes and temperature, precipitation thresholds are generally computed in different bins that divided by daily surface air temperature on precipitation days. For the purpose of diminishing the uneven distribution of precipitation on its corresponding temperature, the total temperature range is divided into 15 bins. The sample size in each bin are roughly the same. Based on this method, the 90th percentile, 99th percentile, and 99.9th percentile of precipitation intensity are computed in each bin. Correspondingly, mean temperatures of each bin are used to reflect the thermodynamic condition. According to previous definition [ Yu et al. , 2007 ], rainfall duration is defined as the number of hours from the beginning to the end of the rainfall event, during which time there is no interruption or at most a 1-h interruption.
3. Results
3.1. Relation between temperature and precipitation extremes
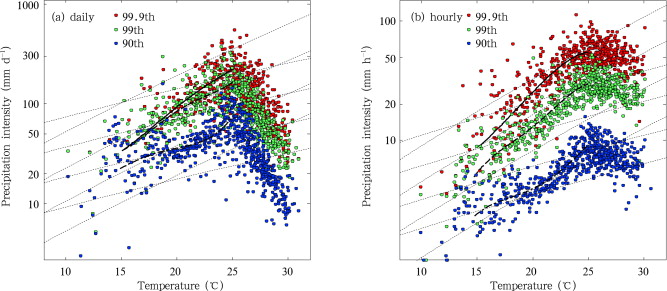
The dependencies of daily precipitation extremes and hourly precipitation extremes on daily surface air temperature at different percentiles are shown in Figure 2 . For daily precipitation extremes, there is an obvious peak-like structure, that is, along with the rise of temperature, precipitation extremes increase when temperature is below 25°C, while decrease when temperature is above 25°C. Comparing precipitation extremes at different percentiles, it is noticed that with the increase of percentiles, the dependency scaling of precipitation on temperature below 25°C enhances gradually, and the transition to the two-time CC scaling occurs at a lower temperature. For instance, roughly below 25°C, the lower (90th) percentile of daily precipitation intensity exhibits a temperature dependency between CC scaling and two-time CC scaling, and transits to the two-time CC scaling around 23°C; the higher (99th and 99.9th) percentiles of daily precipitation intensity possess a temperature dependency close to or even higher than the two-time CC scaling, and convert to the two-time CC scaling after 15°C. Similarly, for hourly precipitation extremes, the temperature dependency below 25°C is between CC scaling and two-time CC scaling for the 90th percentile, and is higher than the two-time CC scaling for the 99th and 99.9th percentiles. Meanwhile, the transition temperature for two-time CC scaling is about 21°C for the 90th percentile, and is close to 15°C for higher percentiles. Therefore, for both daily precipitation extremes and hourly precipitation extremes, more extreme events present an earlier transition to the twotime CC scaling than less extreme events. Similar results were found in the Netherlands [ Lenderink and van Meijgaard , 2008 ], which suggests that the explanation could be found in the physics of precipitating convective clouds.
|
|
|
Figure 2. Dependencies of different extreme percentiles (90th–99.9th) of daily (a) and hourly (b) precipitation on surface air temperature in South China. Scatter points are computed from certain percentiles in each temperature bin for each station (black curves are computed by 4th degree exponential polynomial-fitting of precipitations through 15°C to 25°C for 99.9th percentiles, 99th percentiles, and 90th percentiles; exponential relations of CC scaling and double CC scaling are given by grey dotted lines; note the logarithmic y-axis) |
Concretely speaking, firstly, more precipitation implies more condensation and therefore more latent heat release, which results in stronger updrafts feeding back to precipitation formation, and eventually makes the dependency of precipitation on temperature surpass the CC scaling. Secondly, convective intensities are averagely strong under adequate thermodynamic condition. Strong convections probably allow ordinary extreme precipitation to generate higher condensation than the amount restricted by local saturated vapor pressure at surface. On contrary, convective intensities are relatively limited under weaker thermodynamic conditions. Therefore, under weaker thermodynamic conditions, more extreme events, which possess stronger convections due to intensive positive feedback caused by abundant condensation, are able to transit to the two-time CC scaling by producing massive precipitation.
Comparing daily precipitation extremes and hourly precipitation extremes, it is shown that the increasing tendency of precipitation on temperature is higher in the latter ones. For instance, the temperature dependency for the 99th precipitation percentile is around two-time CC scaling in daily precipitation, while it is higher than two-time CC scaling in hourly precipitation. This phenomenon might be explained by the essential features of precipitation data. Firstly, hourly data are able to describe the precipitation intensity more accurately, while daily data are easily impacted by rainfall duration due to its relatively low time resolution. Secondly, in general, the number of short duration events increases greatly under higher temperature, which will inevitably carry many dry hours into daily data. These hours could make a negative contribution to daily rainfall intensity, and then finally weaken the increase tendency of daily precipitation on temperature. Therefore, the different increase tendency between daily precipitation and hourly precipitation not only implies that the actual intensity of rainfall events may follow a stronger response to temperature variation, but also demonstrates great importance of using highly resolution data in extreme precipitation research.
In addition, the decreasing tendency of temperature is much more obvious in daily precipitation than in hourly precipitation. It is found that the decrease of extreme daily precipitation could be well explained by the decrease in precipitation duration [ Utsumi et al. , 2011 ]. Thus, it is necessary to investigate whether the decrease of extreme hourly precipitation in South China is related to a further decrease in rainfall duration.
3.2. Reason for decreasing tendency of hourly precipitation extremes
In order to get a further comprehension of rainfall duration effects, the duration difference of precipitation events presented in Figure 2 will be contrasted in this section.
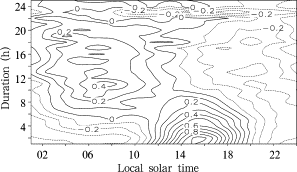
Starting from the partition of rainfall duration in South China, normalized diurnal variations of rainfall amount for events with different durations in the warm season (May–October) are shown in Figure 3 . For better comparisons among rainfall events with different duration, hourly rainfall is normalized with its daily mean. The results show that two diurnal peaks dominate the total rainfall, one is short duration rainfall, which mainly occurring in late afternoon (13:00–18:00 local solar time, LST) and lasting less than or equal to 8 h; the other is long duration rainfall, which mainly occurring in early morning (02:00–11:00 LST) and lasting longer than 8 h. These diurnal variations suggest that distinguished by rainfall duration, short duration precipitation and long duration precipitation are triggered by dissimilar physical mechanisms: short duration events, which are related to the convective instability during afternoon, are regulated by local thermal dynamic condition; while long duration events, which are involved with the nighttime cooling effect of clouds or the abrupt transition of circulation in early morning, are influenced by larger scale systems. Therefore, in the subsequent discussions, short duration precipitation is defined as rainfall lasting 1–8 h, and long duration precipitation as rainfall lasting more than 8 h.
|
|
|
Figure 3. Standardized diurnal feature of precipitation events with different duration |
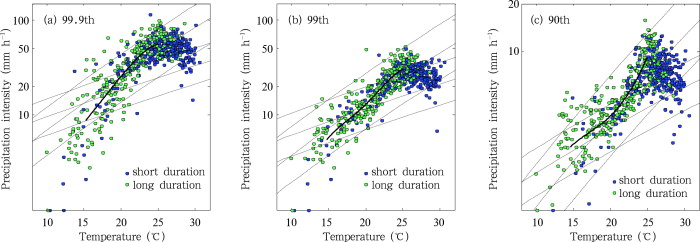
According to this criterion, hourly precipitation is marked by short duration or long duration depending on which duration-related rainfall events they belong to. The dependency of hourly precipitation on surface air temperature is presented by short duration and long duration respectively as shown in Figure 4 . The previous analysis has demonstrated that both daily precipitation extremes and hourly precipitation extremes decrease under higher temperatures. The results illustrated in Figure 4 further indicate that the decrease of hourly precipitation extremes above 25°C is mainly caused by short duration precipitation. Focusing on this character, we computed the ratios of short duration precipitation total to long duration precipitation total in varying temperature bins, that is, the ratios of the cyan point number to the blue point number in different temperature ranges. For temperature below 25°C, the above ratio is 0.36, 0.45 and 0.58 for 90th percentile, 99th percentile and 99.9th percentile, respectively. However, this ratio rises greatly to 2.74 (90th), 2.40 (99th) and 2.17 (99.9th) after 25°C, which indicates the number of short duration precipitations is two-time higher than the number of long duration precipitation. Meanwhile, as presented in Figure 4 , long duration precipitation rarely occurs when temperature surpassing 28°C. In addition, considering that short duration precipitation could represent convective precipitations on a great scale, it is reasonable to believe that the descending tendency of hourly precipitation extremes on surface air temperature after 25°C is primarily caused by convective precipitation.
|
|
|
Figure 4. Dependencies of hourly precipitation presented by short duration (blue dots) and long duration (cyan dots) precipitations individually on surface air temperature in South China for (a) 99.9th percentile, (b) 99th percentile, and (c) 90th percentile (scatter points are computed from certain percentiles in each temperature bin for each station; black curves are computed by 4th degree exponential polynomial-fitting of precipitations through 15°C to 25°C for 99.9th, 99th, and 90th percentiles; exponential relations of CC scaling and double CC scaling are given in grey dotted lines; note the logarithmic y-axis) |
4. Conclusions and discussion
Using hourly rain gauge data of 42 stations in South China during 1966–2005, the corresponding relationship between precipitation extremes and surface air temperature in warm season was analyzed. The major conclusions are summarized as below.
(1) For temperature below 25°C, both daily precipitation extremes and hourly precipitation extremes follow an increasing tendency with temperature increasing. During this process, precipitation of higher percentiles exhibit an earlier transition to the two-time CC scaling.
(2) For temperature above 25°C, a decreasing tendency with temperature increasing is detected in precipitation extremes, among which daily precipitation extremes decrease much more significantly.
(3) The decrease of hourly precipitation extremes above 25°C is mainly caused by short duration precipitations. Long duration precipitation extreme seldom occurs above 28°C.
The conclusions suggest that the corresponding relation between precipitation extremes and surface air temperature in South China is similar to that in the middle latitudes where a peak-like structure is explored in daily precipitation extremes [ Utsumi et al. , 2011 ]. Besides, up to the peak point temperature, the slope of hourly precipitation extremes in South China is generally higher than those in the Japanese regions. This difference could be explained by the annual analysis in the Japanese regions. Annual analysis includes cold season precipitations which contribute to the CC scaling below 10°C. Meanwhile, the different dependency under higher temperatures between South China and the Netherlands [ Lenderink and van Meijgaard , 2008 ] might be caused by their geographical locations. Due to the lower temperature in higher latitudes, there might only be a few precipitation extremes, whose duration is shorter than the time resolution of data. Therefore, the decrease of precipitation extremes under higher temperatures may not exist in the Netherlands.
The results show that the decrease tendency of hourly precipitation extremes above 25°C is mainly contributed by short duration precipitations. This conclusion is not in conflict with the explanation that attributes the decline of precipitation extremes to the decrease of rainfall duration. In addition, it provides a comprehensive understanding of the cause of precipitation decline, and gives a new inspiration to study the relation between temperature and duration-related precipitation extremes.
In the corresponding relation between hourly precipitation extremes and surface air temperature, short duration and long duration precipitations exhibit different features (Fig. 4 ). Since the two types of precipitation have individual physical backgrounds, it is necessary to explore the similarities and differences in the dependencies of different property-related precipitation extremes on surface air temperature. Moreover, extensive studies have focused on the variation trend of precipitation extremes under climate warming. In response to CO2 doubling, the increase of extreme precipitation is much greater than that of average precipitation [ Allen and Ingram , 2002 ]. Having noticed this phenomenon, the significant increase of extreme precipitation under climate warming is found to be mainly facilitated by the thermodynamic change [ Emori and Brown , 2005 ]. Comparing satellite observations with model simulations, the increase rate of extreme rainfall events to climate warming is weaker in the models than in observations [ Allan and Soden , 2008 ]. Consequently, it is highly significant to extend this study to other regions, and eventually finding a connection between precipitation extremes and large-scale climate warming in China. Furthermore, in the study of dependencies of precipitation extremes on temperature, one key issue is to find the trigger mechanism of precipitation scaling exceeding CC relation; the other is to interpret the decline tendency of precipitation extremes. These two issues are directly related to the notion that whether the temperature dependency derived from present climate are valid under climate change. Meanwhile, many studies pointed out that moisture condition usually plays an important role in the formation of precipitation extreme [ Brimelow and Reuter, 2005 ; Trenberth et al ., 2003 ]. Therefore, whether the issues mentioned above are related to water vapor features which are regulated by temperature, combining moisture analysis and model experiments might receive a further understanding.
Acknowledgements
The authors are grateful to the two anonymous reviewers for their helpful comments. This paper is supported by the project of National Natural Science Foundation of China (No. 41221064).
References
- Allan and Soden, 2008 R.P. Allan, B.J. Soden; Atmospheric warming and the amplification of precipitation extremes; Science, 321 (5895) (2008), pp. 1481–1484
- Allen and Ingram, 2002 M.R. Allen, W.J. Ingram; Constraints on future changes in climate and the hydrologic cycle; Nature, 419 (6903) (2002), pp. 224–232
- Brimelow and Reuter, 2005 J.C. Brimelow, G.W. Reuter; Transport of atmospheric moisture during three extreme rainfall events over the Mackenzie River Basin; Journal of Hydrometeorology, 6 (4) (2005), pp. 423–440
- Emori and Brown, 2005 S. Emori, S. Brown; Dynamic and thermodynamic changes in mean and extreme precipitation under changed climate; Geophys. Res. Lett., 32 (17) (2005) http://dx.doi.org/10.1029/2005GL023272 L17706
- Groisman et al., 2005 P.Y. Groisman, R.W. Knight, D.R. Easterling, et al.; Trends in intense precipitation in the climate record; J. Climate, 18 (9) (2005), pp. 1326–1350
- Lenderink and van Meijgaard, 2008 G. Lenderink, E. van Meijgaard; Increase in hourly precipitation extremes beyond expectations from temperature changes; Nature Geoscience, 1 (8) (2008), pp. 511–514
- Pall et al., 2007 P. Pall, M. Allen, D. Stone; Testing the Clausius–Clapeyron constraint on changes in extreme precipitation under CO2 warming ; Climate Dynamics, 28 (4) (2007), pp. 351–363
- Shaw et al., 2011 S.B. Shaw, A.A. Royem, S.J. Riha; The relationship between extreme hourly precipitation and surface temperature in different hydroclimatic regions of the United States; Journal of Hydrometeorology, 12 (2) (2011), pp. 319–325
- Trenberth et al., 2003 K.E. Trenberth, A. Dai, R.M. Rasmussen, et al.; The changing character of precipitation; Bull. Amer. Meteor. Soc., 84 (9) (2003), pp. 1205–1218
- Utsumi et al., 2011 N. Utsumi, S. Seto, S. Kanae, et al.; Does higher surface temperature intensify extreme precipitation?; Geophys. Res. Lett., 38 (16) (2011) http://dx.doi.org/10.1029/2011GL048426 L16708
- Yu and Li, 2012 R.-C. Yu, J. Li; Hourly rainfall changes in response to surface air temperature over eastern contiguous China; J. Climate, 25 (19) (2012), pp. 6851–6861
- Yu et al., 2007 R.-C. Yu, Y.-P. Xu, T.-J. Zhou, et al.; Relation between rainfall duration and diurnal variation in the warm season precipitation over central eastern China; Geophys. Res. Lett., 34 (2007) http://dx.doi.org/10.1029/2007GL030315 L13703
Document information
Published on 15/05/17
Submitted on 15/05/17
Licence: Other
Share this document
Keywords
claim authorship
Are you one of the authors of this document?


