(Created page with "==Abstract== Biogas, a renewable energy source, is primarily composed of methane and carbon dioxide and other gaseous species. Biogas upgrading for removing CO<sub>2</sub> fr...") |
m (Scipediacontent moved page Draft Content 202532511 to Yousef et al 2016a) |
(No difference)
| |
Latest revision as of 10:33, 12 April 2017
Abstract
Biogas, a renewable energy source, is primarily composed of methane and carbon dioxide and other gaseous species. Biogas upgrading for removing CO2 from raw biogas is a necessary step before the biogas to be used as vehicle fuel or injected into the natural gas grid. Therefore, the present work aimed to propose a low-temperature CO2 removal process as an alternative to the conventional biogas upgrading technologies (water scrubbing, chemical and physical scrubbing, membranes and Pressure swing adsorption). A typical model biogas mixture of 60 mol.% CH4 and 40 mol.% CO2 is considered. The present process showed that a product purity of 94.5 mol.% CH4 is obtained from compressed biogas by combining distillation, flash separation, auxiliary refrigeration and internal heat recovery with a potential specific energy consumption of 0.26 kW h/Nm3 raw biogas. The process has been simulated in Aspen HYSYS with avoiding the occurrence of CO2 freeze-out. The process delivers the captured CO2 in liquid form with a purity of 99.7 mol.% as a by-product for transport at 110 bar. It is concluded that the proposed upgrading process can serve as a new environmentally friendly approach to CO2 removal with an interesting energy-efficient alternative to the conventional upgrading techniques.
Keywords
Biogas upgrading; Carbon dioxide and methane separation; CO2 liquefaction and separation; Liquid CO2 from biogas; Low-temperature; Cryogenic energy
1. Introduction
The problem caused by the availability of fossil fuels and the presence of global warming due to carbon dioxide (CO2) released from burning fossil fuels attracts more public attention in development and utilization of alternative, non-petroleum-based renewable sources of energy. This problem can partially be circumvented by the production of biogas [1], [2] and [3]. Biogas, a renewable and sustainable energy source, is typically produced by the anaerobic decomposition of organic matters in the absence of oxygen. There are two sources for biogas production and these are landfills and digester chambers [4]. Biogas comprises mainly methane (typically 40–70 vol.%), carbon dioxide, smaller traces of acidic gases and impurities such as hydrogen sulfide, nitrogen, water vapor and traces of other volatile organic gases [5]. Biogas produced from organic materials can be used directly to generate power, but the large volume of CO2 reduces its heating value, and limiting economic feasibility to use. Therefore, depending on the end use, different biogas treatment steps are necessary. For some applications, such as vehicle fuel or grid injection, where it is important to have high energy content in the biogas, the biogas needs to be upgraded [6]. Upgrading biogas to fuel grade biomethane involves two major processes: cleaning and CH4 enrichment. The cleaning of the biogas consists of removal of acidic gases and impurities, while the enrichment process is for separation of CO2 from biogas [7], which is the main topic of interest in this work.
Biogas can be upgraded for removing CO2 by using six main technologies: cryogenic separation, membrane separation, organic physical scrubbing, chemical scrubbing, pressure swing adsorption, and high pressure water scrubbing. These technologies are based on four principle techniques: absorption, adsorption, membrane and cryogenic [8]. The detailed description of technologies mentioned above was presented in the SGC’s Report 270 [8]. In terms of cryogenic principle technique, SGC’s Report 270 [8] is reported that the cryogenic upgrading technology is still under development and demonstration and it would not be fair to use the data in a comparison with the other mature technologies (water scrubbing, organic physical scrubbing, amine wash, membranes and PSA).
The main objective of the paper was to propose a process of low temperature technique for separating carbon dioxide/methane mixtures with avoiding CO2 freeze-out in order to upgrade the biogas as an alternative to the conventional biogas upgrading technologies.
2. Process description
2.1. Process simulation model description
Biogas comprises mainly methane (CH4), carbon dioxide (CO2), smaller traces of acidic gases and impurities such as hydrogen sulfide (H2S), nitrogen (N2), water vapor (H2O) and traces of other volatile organic gases (VOCs) [5]. In this work, it is assumed that only CO2 removal is considered, and the feed gas consists of CH4 and CO2 only with a typical composition of 60 mol.% and 40 mol.%, respectively. The characteristics of the feed biogas in this work are listed in Table 1.
| Molar flow (Kmol/h) | Temperature (°C) | Pressure (kPa) | Composition (% Mole Base) | |
|---|---|---|---|---|
| CH4 | CO2 | |||
| 1000 | 35 | 120 | 60 | 40 |
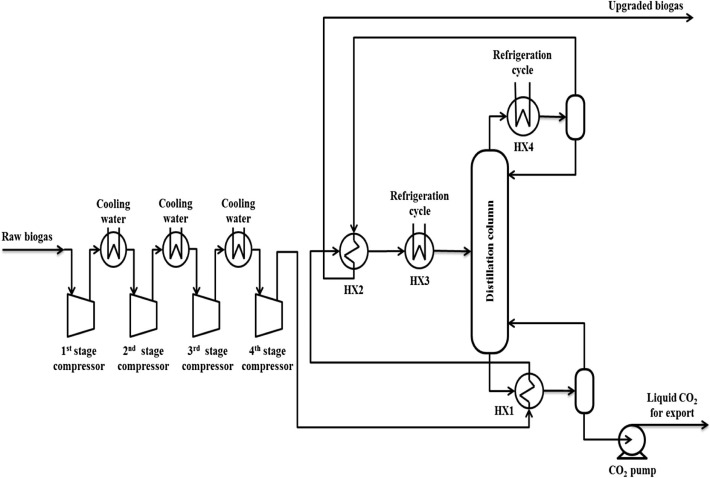
The process flow diagram in Fig. 1 shows the principal layout of the low-temperature CO2 removal process. The diagram includes main process streams only and auxiliary refrigeration cycle is not included. The feed raw biogas is first sent to the compression package (@ 35 °C and 120 kPa) to raise its pressure from 120 to 4983 kPa. The compression is made in four stages with intercooling (@ 35 °C) by cooling-water heat exchangers (inter-coolers). Subsequently, the raw biogas, after leaving the last stage of compression (@ 125.6 °C and 4983 kPa), is directed to the distillation column reboiler (HX1) to provide the reboiler with the required heat by taking the advantage of the high temperature produced from the compression (125.6 °C) and to be pre-cooled leaving the heat exchanger with a temperature of 15.6 °C. It is then entered another heat exchanger (HX2) to be cooled to – 32.9 °C by the top distillation column product stream (@ −75.7 °C) in order to take the advantage of its low temperature before leaving the process as a main product (upgraded biogas) at temperature 13.6 °C and pressure 4983 kPa. The raw biogas is then cooled further to −65 °C by the auxiliary refrigeration cycle in HX3 before entering the distillation column. In the distillation column the concentration of CO2 in the top product is reduced from 40 mol.% to 5.5 mol.% with a CH4 purity of 94.5 mol.%, and the purity of CO2 in the bottom product (liquid CO2) is obtained at 99.7 mol.% at temperature 13.6 °C and pressure 4983 kPa. The CO2-rich by-product leaving the reboiler is then pumped to 110 bar, which is the targeted export pressure for transport. This export pressure is considered similar to what was assumed by Berstad et al. [9]. It is worth mentioning that the cooling duty of the distillation column condenser (HX4) is provided by the auxiliary refrigeration cycle.
|
|
|
Figure 1. Principal process flow diagram for the low-temperature CO2 removal process. |
Data for the distillation column are listed in Table 2. For the distillation column at obtaining operating conditions, the freeze-out of CO2 is avoided in the column. The value of the top-product CH4 purity in the column (94.5 mol.%) is determined in the current configuration as a maximum purity that can be reached at the current operating conditions with avoiding CO2 freeze-out since any further increase in purity will increase the risk of CO2 freeze-out. However, increasing the top-product CH4 purity in the column further with avoiding CO2 freeze-out can be achieved by raising the reflux ratio in the column and thus increased refrigeration power consumption, and the current selected reflux ratio represents a trade-off with respect to power consumption.
| Number of stages | 11 |
| Feed stage no. (from top) | 4 |
| Pressure (kPa) | 4983 |
| Condenser temperature (°C) | −75.7 |
| Condenser duty (kW) | 684 |
| Reboiler temperature (°C) | 13.6 |
| Reboiler duty (kW) | 1371 |
| Reflux ratio | 2.8 |
Number of stages in the column is selected 11 (Table 2) because the column at this selected number of stages produces liquid CO2 with an acceptable purity (99.7 mol.%) for transport. In addition, the column feed stage number is assumed to be the fourth stage (from top) and has not been optimized. Regarding the feed column temperature which is selected at −65 °C, it is observed that lowering the feed column temperature results in increasing the top-product CH4 purity in the column further. However, the temperature below −65 °C leads to increase the risk of CO2 freeze-out in the column feed stream and therefore this temperature is selected as a lower limit.
Process simulations have been performed in steady state using Aspen Hysys version 8.6 with Peng-Robinson equation of state. The efficiency of the compressors and CO2 pump was assumed to be 0.8. Pressure drop in heat exchangers and distillation column is neglected for simplicity. However, this is compensated for by assuming conservative figures for compressor efficiencies. In addition, assumed cooling water in- and outlet temperatures in water cooled heat exchangers are set to be 25 °C and 30 °C, respectively. The lowest temperature difference of the low-temperature heat exchangers is set as 2 °C in general and 3 °C for HX1. In the low-temperature engineering, 2 °C is an acceptable choice of the pinch temperature for low-temperature heat exchangers, such as the main heat exchanger of Air Separation Unit (ASU) [10].
A relatively simple cascade refrigeration cycle with pure propane and ethane as refrigerants has been assumed to supply the low-temperature CO2 removal process with required cooling. The refrigeration utility system has not been optimized with respect to refrigerant selection, energy consumption, equipment size or cost. However, it is still assumed that the resulting energy consumption of this cascade process gives a reasonable estimate for the power requirement associated with distillation column feed pre-cooling (HX3) and condenser duty (HX4) for the specified ambient conditions.
2.2. Energy efficiency calculation of the upgrading process
Energy efficiency (η) of the current biogas upgrading technology is a key parameter to be calculated since it considers not only the energy consumed by the process but also the loss of CH4 in the entire upgrading process that affects the overall energy efficiency. The energy efficiency term is defined as
|
|
This equation is used for comparing the present upgrading process with the other conventional technologies in terms of energy efficiency (η) as used in the review article of Sun et al. to compare the different upgrading technologies [11].
3. Results and discussion
3.1. Product streams and energy requirement
The main properties and chemical compositions for the current process products (upgraded biogas and liquid CO2) are listed in Table 3. The first product is upgraded biogas has a CH4 purity of 94.5 mol.% with CO2 concentration of 5.5 mol.% that can be utilized for gas grid injection or for vehicles as a fuel. To use biogas for natural gas grid injection, the maximum CO2 concentration standard for gas quality required in Europe is 1–8 mol.% and in USA it is 2–3 mol.% [12]. Likewise, to use biogas as a vehicle fuel, the maximum CO2 concentration is 3 mol.% according to the gas specifications from E.ON which is a large energy company [13]. For lowering the CO2 concentration below 3 mol.% in the proposed process, additional distillation column is needed for further purification.
| Upgraded biogas | Liquid CO2 | |
|---|---|---|
| Main properties | ||
| Pressure (kPa) | 4983 | 11,000 |
| Temperature (°C) | 13.6 | 23.3 |
| Molar flow (Kmol/h) | 634 | 366 |
| Composition (mol. fraction) | ||
| CH4 | 0.945 | 0.003 |
| CO2 | 0.055 | 0.997 |
The second product (liquid CO2), which is considered as a valuable by-product, has a high CO2 purity of 99.7 mol.% with a low CH4 entertained in the stream of 0.3 mol.% (Table 3). This high-purity liquid CO2 produced, which is the main advantage of the present process, at the targeted export pressure 11,000 kPa (110 bar) makes the CO2 product suitable to be transported through pipeline as opposed to the conventional technologies which requires further processing on the CO2 if considering it as a by-product. Additionally, unlike conventional capture processes rejecting CO2 in gaseous form and thus requiring energy-intensive compression to transport pressure, an important feature of the low-temperature processes was the capture of the liquid CO2 which can be pressurized by pumping at considerably lower energy cost. Moreover, capturing CO2 and producing it in liquid form as a by-product instead of releasing it to the atmosphere as in the case of the conventional technologies make the proposed upgrading process more environmentally friendly.
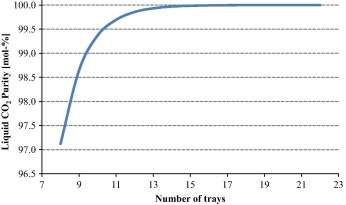
It can be noticed from Fig. 2 that increasing the liquid CO2 purity further for a specific application will require increasing the number of trays as well. As an illustration in Fig. 2, increasing the column number of trays from 11 to 15 increases the value of CO2 purity from 99.7 mol.% to 99.99 mol.%, respectively.
|
|
|
Figure 2. The results of liquid CO2 purity in the by-product as a function of distillation column number of trays. |
For heat exchangers HX1–HX4, duties and logarithmic mean temperature differences (LMTD) are listed in Table 4.
| HX1 | HX2 | HX3 | HX4 | |
|---|---|---|---|---|
| Duty (kW) | 1371 | 987 | 1628 | 684 |
| LMTD (°C) | 29.4 | 16.0 | 10.1 | 2.5 |
An overview of molar flowrates and LHV-based energy flow for product streams is given in Table 5. The methane-rich upgraded biogas product has energy content of 99.81% relative to that of the raw biogas feed stream, and 99.998% of the total methane fed into the process is retained in this product stream. On the other hand, the methane entertained in the liquid CO2 product stream accounts for a lower value of a potential energy loss equivalent to 0.19% relative to that of the feed.
| Molar flow (Kmol/h) | LHV energy flow (MW) | Percentage of energy in feed stream (%) | |
|---|---|---|---|
| Upgraded biogas stream | 634 | 133.6 | 99.81 |
| Liquid CO2 stream | 366 | 0.249 | 0.19 |
| CO2 capture (%) | 91.3 |
| Methane loss (%) | 0.19 |
| Energy efficiency (%) | 95.52 |
| Power consumption | |
| Auxiliary refrigeration cycle (kW) | 2510 |
| Raw biogas pre-compression (kW) | 3598 |
| Liquid CO2 pumping (kW) | 40 |
| Total power consumed (kW) | 6148 |
| Specific energy consumption (kW h/Nm3 raw biogas) | 0.26 |
| Specific energy consumption (kW h/Nm3 upgraded biogas) | 0.41 |
| Specific energy per unit of CO2 captured (MJ/ton CO2) | 1377 |
As shown in Table 5, the proposed CO2 capture process has a removal efficiency of 91.3% with a flowrate of 16.1 t/h for captured CO2 and the corresponding specific energy consumed per unit of CO2 captured calculates to 1377 MJ/ton CO2.
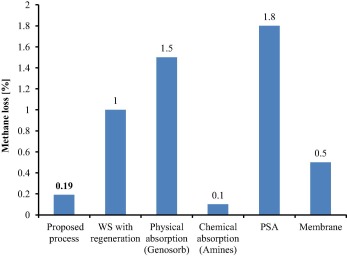
It can be seen from Table 5 that the methane loss (methane slip) of the proposed process calculated in this study is 0.19%, and the present methane loss shows a lower value compared to the other conventional upgrading technologies that are mentioned in SGC’s Report 270 [8] which reported that the methane slip in the Pressure swing adsorption (PSA) is 1.8% as mean value. The water scrubbing has a slip of about 1% in modern plants. The chemical absorption (using amine scrubbers) system has a much lower methane slip with 0.1% guaranteed. Physical absorption (using Genosorb scrubbers) has a higher slip than the other technologies about 1.5% since the methane recovery in a modern organic physical scrubber is about 98.5%. Membranes have a relatively low methane slip, about 0.5%. All of the considered technologies are illustrated in Fig. 3 together with the proposed process.
|
|
|
Figure 3. The comparison between the proposed process and the conventional technologies, namely water scrubbing with regeneration (WS with regeneration), physical absorption (using Genosorb), chemical absorption (using Amines), pressure swing adsorption (PSA), and membrane with respect to methane loss. Data for conventional technologies are adapted from [8]. |
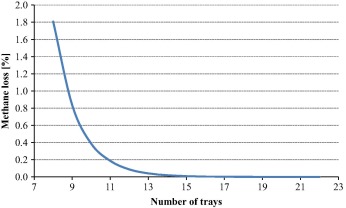
It is worth mentioning that the present value of methane loss (0.19%) can be further reduced by increasing the number of column stages as shown in Fig. 4. For example, in Fig. 4, a methane loss of 0.01% can be obtained by increasing the column number of stages to 15 stages.
|
|
|
Figure 4. The results of methane loss as a function of distillation column number of trays. |
Resulting power figures are shown in Table 5. The compression power makes up about 59% of the total consumed power as the proposed removal process operates at high pressure compared to approximately 41% in the refrigeration cycle which can be reduced by improving the performance of the cycle (COP) whereas the pressurization of captured CO2 is a minor contribution to the overall power requirement.
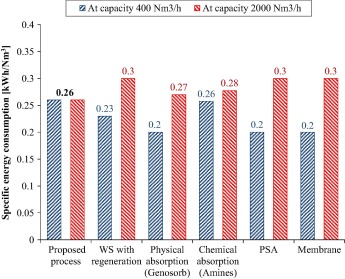
The specific energy consumed by the process is 0.26 kW h/Nm3 raw biogas (Table 5), and it is well in line with what is reported in SGC’s Report 270 by Bauer et al. [8] from the supplier information where it was found that the specific power consumption of the conventional technologies varies rather much with the scale of the upgrading unit as opposed to the proposed process in this study which shows a constant specific power consumption with different scales of upgrading units. From the SGC report [8], it was reported in the water scrubbing case that the specific power consumption is approximately 0.3 kW h/Nm3 at the lower end of the capacity spectrum (400 Nm3/h) but decreases toward 0.23 kW h/Nm3 with the throughput being increased toward 2000 Nm3/h. In the case of the chemical absorption (using amine scrubbers), it has an electric power requirement of 0.14 kW h/Nm3 when operating in the lower part of a plant capacity and 0.12 kW h/Nm3 when operating in the higher part of plant capacity together with a typical value for the heat demand is 0.55 kW h/Nm3. Physical absorption (using Genosorb scrubbers) has a specific power consumption of about 0.27 kW h/Nm3 at the lower end of the capacity compared to 0.2 kW h/Nm3 at the higher end of the capacity. The pressure swing adsorption span is rather large with a consumption of 0.2–0.3 kW h/Nm3, which is the same reported span as in the membrane case. All of the discussed technologies are depicted in Fig. 5 together with the proposed process. Since the chemical absorption technology consumes electric and heat energy, it is assumed that 1 kW h electricity is equivalent to 4 kW h heat to be comparable with the other technologies. Therefore, as shown in Fig. 5, the chemical absorption technology has an electric power requirement of 0.26 kW h/Nm3 at 400 Nm3/h and 0.28 kW h/Nm3 at 2000 Nm3/h. Moreover, it can be noticed from Fig. 5 that the proposed process has the lowest specific power consumption at the higher capacity (2000 Nm3/h) whereas it shows the highest at the lower capacity (400 Nm3/h). Therefore, using the proposed process at higher capacities would be preferable in terms of energy consumption alternative to conventional techniques.
|
|
|
Figure 5. The comparison between the proposed process and the conventional technologies, namely water scrubbing with regeneration (WS with regeneration), physical absorption (using Genosorb), chemical absorption (using Amines), pressure swing adsorption (PSA), and membrane with respect to the energy demand. Data for conventional technologies are adapted from [8]. |
It is worth mentioning that the previous comparison between the proposed process and the conventional technologies with respect to the energy consumption and methane loss should not be seen as the absolute truth but instead an indication because of the difference in several factors between the present process and the other technologies. To give an illustration, the difference in the chemical composition of the raw biogas feed and the difference in the percentage of CO2 removal between the proposed process and the other conventional techniques affect the upgrading specific energy consumption for accurate comparison.
Furthermore, the pressure levels of the upgraded gas streams in each upgrading technology are not equal and a higher inherent energy in the gas streams is available at higher pressures [8]. However, at higher pressures required for the upgraded biogas to be utilized or transported, the inherent energy in the upgraded gas stream of the proposed upgrading process will be lower than that of the other conventional technologies because the present technique operates at higher pressures (4983 kPa) compared to the other conventional technologies.
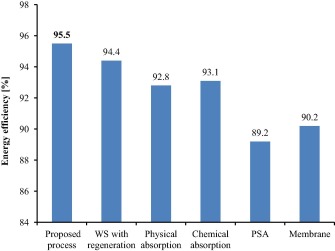
The energy efficiency of the present upgrading process is 95.52% (Table 5) compared to the results reported by Sun et al. [11] in his review article that generally the median energy efficiency of the water scrubbing (WS) with regeneration, physical absorption, chemical absorption, pressure swing adsorption (PSA) and membrane technology were 94.4%, 92.8%, 93.1%, 89.2% and 90.2%, respectively. All of the considered technologies are shown in Fig. 6 together with the proposed process. As seen in Fig. 6, the current energy efficiency of the proposed process shows a higher value compared to the other conventional technologies since the proposed process has lower values of methane loss and energy loss leading to higher energy efficiency.
|
|
|
Figure 6. The comparison between the proposed process and the conventional technologies, namely water scrubbing with regeneration (WS with regeneration), physical absorption, chemical absorption, pressure swing adsorption (PSA), and membrane with respect to energy efficiency. Data for conventional technologies are adapted from [11]. |
3.2. CO2 freeze-out avoidance in the distillation column
The process is performed and simulated with avoiding CO2 freeze-out, and it is considered in the simulation of the process that the minimum difference between the stream temperature and CO2 freeze-out temperature does not fall below 1.5 °C as mentioned by Berstad et al. [14].
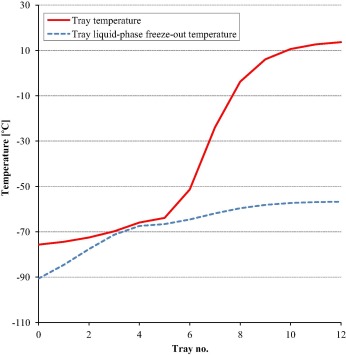
The distillation column is studied to avoid CO2 freeze-out by finding the suitable inlet conditions to the column. Fig. 7 illustrates the calculated tray temperatures for the distillation column together with the freeze-out temperatures for the respective liquid compositions of the different trays of the column. The trays are numbered from the top including condenser stage, which is considered as no. 0, and reboiler stage (no. 12).
|
|
|
Figure 7. Tray temperature and estimated CO2 freeze-out temperature for the distillation column. |
Although freeze-out estimation must be done with caution and results handled and interpreted with great care [15], estimates made in HYSYS indicate no temperature crossover between tray temperature and CO2 freeze-out temperature for liquid compositions of the trays of the column. Furthermore, it can be seen from Fig. 7 that the lowest temperature difference (minimum approach) is located from tray 3 to tray 5 with 1.5 °C approach between the tray temperature and the liquid-phase CO2 freeze-out temperature.
For wider temperature pinch between tray temperatures and corresponding CO2 freeze-out temperature, this can be obtained by lowering the current operating CH4 purity (94.5 mol.%) in the column. Moreover, as mentioned before, the current CH4 purity is the maximum purity that can be reached at the current operating conditions with avoiding CO2 freeze-out by 1.5 °C approach since any further increase in the purity will lower the approach below 1.5 °C that results in increasing the risk of CO2 freeze-out in the column. The model for freezing point prediction indicates that it can be avoided but further complementary experimental verification would be preferable.
3.3. Effect of changing column feed pressure on the occurrence of CO2 freeze-out in the distillation column
This case study shows the effect of variation feed pressure of the distillation column on the existent of CO2 freeze-out on column trays. The purpose of this case study was to find the safely operating ranges of pressure to avoid the CO2 freeze-out in the distillation column and subsequently in the all process streams to safely run the process without freezing.
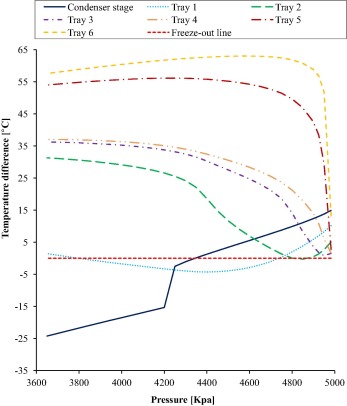
Unlike the trays close to the reboiler, it has been observed that the trays close to the condenser are the most vulnerable to the risk of CO2 freezing as a result of their low temperatures because the temperatures get lower while moving upward toward the condenser in the distillation column as shown in Fig. 8. Accordingly, only the upper trays that are close to the condenser (from tray 1 to 6 including the condenser stage) have been studied. In addition, the range of changing the feed pressure is taken from 3650 to 4983 kPa. Regarding the upper limit, the distillation column is not converged at a pressure larger than 4983 kPa.
|
|
|
Figure 8. The results of temperature difference, on distillation column trays (condenser stage and Tray 1 to 6) as a function of column feed pressure. Temperature difference is considered as a difference between the tray temperature and the tray CO2 freeze-out temperature. |
The results of the study are illustrated in Fig. 8 which shows the effect of changing column feed pressure on the trays’ temperature difference. Temperature difference term means the difference between the tray temperature and the tray CO2 freeze-out temperature so that if the temperature difference (the result of subtraction) is above zero with a positive value, freezing will not happen, and vice versa. Therefore, each tray temperature has been calculated together with the freeze-out temperature for the respective liquid composition of the tray of the column for calculating the difference between the two temperatures at different feed pressure.
As shown in Fig. 8, CO2 freeze-out occurs on one or two of these three trays, namely tray 1, tray 2 and tray 3 over almost all the ranges of changing pressure. However, there is a limited and narrow range of pressures where the column operates safely without freezing. As shown in the figure, pressures from about 4740 to 4800 kPa and from approximately 4880 to 4983 kPa are the most favorable ranges for the column to be operated safely without CO2 freeze-out where it has been detected that all the trays over these ranges are free from CO2 freeze-out. Accordingly, pressure 4983 kPa is selected as an operating pressure for the distillation column in the proposed process to avoid the risk of CO2 freeze-out. Moreover, as shown in the figure, regarding pressure 4983 kPa, the minimum temperature difference exists in tray 3 and tray 4 by about 1.5 C, which is an acceptable value to run the column avoiding the freeze-out.
4. Conclusion and further work
A low-temperature CO2 removal process from biogas has been presented. One low-temperature distillation column increases the CH4 concentration from 60 mol.% to 94.5 mol.% with avoiding CO2 freeze-out in the process. The simulation results show an interesting energy-efficient and promising energy penalty figures at higher capacities alternative to conventional upgrading technologies. Moreover, it is found that the most favorable pressure for the feed stream entered the distillation column is at 4983 kPa in order to operate the process safely for avoiding CO2 freeze-out. Additionally, the number of trays of the column is selected 11 since it shows acceptable values of methane loss and CO2 purity, and if it is required more CO2 purity for a certain use or less methane loss, it is recommended to increase the number of trays. An advantage of the proposed process is that upgraded biogas has high pressure compared to the other conventional technologies that makes the present upgrading process having lower additional energy consumption to be further compressed for transporting by pipeline or for vehicle fuel. In addition to the upgraded biogas product, there is also a liquid CO2 by-product with high CO2 concentration (99.7 mol.%) as a valuable by-product which can be pressurized by pumping at considerably lower energy cost as opposed to the other conventional technologies which rejects CO2 in gaseous form with relatively low CO2 concentration and thus requiring further processing an energy-intensive compression to transport pressure. Another feature is that capturing CO2 in liquid form instead of releasing it to the atmosphere makes the proposed upgrading process more environmentally friendly.
References
- [1] A. Schlütera, T. Bekel, N.D. Naryttza, D. Michael, E. Rudolf, K.H. Gartemannc, K. Irene, K. Lutz, K. Holger, K. Olaf, J.H. Mussgnugd, N. Heiko, N. Karsten, P. Alfred, J.R. Kai, S. Rafael, T. Andreas, T. Alexandra, V. Prisca, G. Alexander; The metagenome of a biogas-producing microbial community of a production-scale biogas plant fermenter analysed by the 454-pyrosequencing technology; J. Biotechnol., 136 (2008), pp. 77–90
- [2] I. Angelidaki, L. Ellegaard; Codigestion of manure and organic wastes in centralized biogas plants: status and future trends; Appl. Biochem. Biotechnol., 109 (2003), pp. 95–105
- [3] S. Yadvika, T.R. Sreekrishnan, S. Kohli, V. Rana; Enhancement of biogas production from solid substrates using different techniques—a review; Bioresour. Technol., 95 (2004), pp. 1–10
- [4] Johansson, N., 2008. Production of Liquid Biogas, LBG, with Cryogenic and Conventional Upgrading Technology-Description of Systems and Evaluation of Energy Balances. M.Sc. Thesis. Lund University, Lund, Sweden. p. 94.
- [5] A.G. Chmielewski, A. Urbaniak, K. Wawryniuk; Membrane enrichment of biogas from two-stage pilot plant using agricultural waste as a substrate; Biomass Bioenergy, 58 (2013), pp. 219–228
- [6] A. Petersson, A. Wellinger; Biogas Upgrading Technologies-Developments and Innovations, IEA Bioenergy, Task37 – Energy from Biogas and Landfill Gas; France, Paris (2009)
- [7] F. Ahmad, K.K. Lau, A.M. Shariff, G. Murshid; Process simulation and optimal design of membrane separation system for CO2 capture from natural gas; Comput. Chem. Eng., 36 (2012), pp. 119–128
- [8] F. Bauer, C. Hulteberg, T. Persson, D. Tamm; Biogas Upgrading – Review of Commercial Technologies; Swedish Gas Technology Centre, SGC, Malmö, Sweden (2013)
- [9] D. Berstad, P. Nekså, G.A. Gjøvåg; Low-temperature syngas separation and CO2 capture for enhanced efficiency of IGCC power plants; Energy Procedia, 4 (2011), pp. 1260–1267
- [10] H.Z. Li; Oxygen Production Technologies; (second ed.)Metallurgical Industry Press, Beijing (2009)
- [11] Q. Sun, H. Li, J. Yan, L. Liu, Z. Yu, X. Yu; Selection of appropriate biogas upgrading technology-a review of biogas cleaning, upgrading and utilisation; Renew. Sustain. Energy Rev., 51 (2015), pp. 521–532
- [12] L. Echterhoff, R. McKee, 1991. State of the art of natural gas processing technologies. Topical report to the Gas Research Institute (contract#GRI-91/0094), London, UK.
- [13] M.K. Amosa, I.A. Mohammed, S.A. Yaro; Sulphide scavengers in oil and gas industry – a review; N. Am. Free Trade Agreem., 61 (2010), pp. 85–92
- [14] D. Berstad, P. Nekså, R. Anantharaman; Low-temperature CO2 removal from natural gas; Energy Procedia, 26 (2012), pp. 41–48
- [15] T. Eggemann, S. Chafin; Beware the pitfalls of CO2 freezing prediction; Chem. Eng. Progress, 101 (2005), pp. 39–44
Document information
Published on 12/04/17
Licence: Other
Share this document
Keywords
claim authorship
Are you one of the authors of this document?
