| (5 intermediate revisions by 3 users not shown) | |||
| Line 370: | Line 370: | ||
{| class="wikitable" style="margin: 0em auto 0.1em auto;border-collapse: collapse;width:auto;" | {| class="wikitable" style="margin: 0em auto 0.1em auto;border-collapse: collapse;width:auto;" | ||
|-style="background:white;" | |-style="background:white;" | ||
| − | |style="text-align: center;padding:10px;"| [[ | + | |style="text-align: center;padding:10px;"| [[File:ZHENG_et_al_2024a_6339_9.png|330px]] |
|- | |- | ||
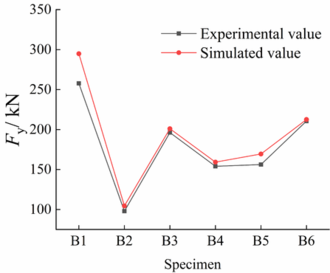
| style="background:#efefef;text-align:left;padding:10px;font-size: 85%;"| '''Figure 9'''. Comparison of experimental and simulated <math display="inline"> F_y </math> values | | style="background:#efefef;text-align:left;padding:10px;font-size: 85%;"| '''Figure 9'''. Comparison of experimental and simulated <math display="inline"> F_y </math> values | ||
|} | |} | ||
| − | + | <br/> | |
| − | + | ||
<div id='img-10'></div> | <div id='img-10'></div> | ||
{| class="wikitable" style="margin: 0em auto 0.1em auto;border-collapse: collapse;width:auto;" | {| class="wikitable" style="margin: 0em auto 0.1em auto;border-collapse: collapse;width:auto;" | ||
|-style="background:white;" | |-style="background:white;" | ||
| − | |style="text-align: center;padding:10px;"| [[ | + | |style="text-align: center;padding:10px;"| [[File:ZHENG_et_al_2024a_8763_10.png|330px]] |
|- | |- | ||
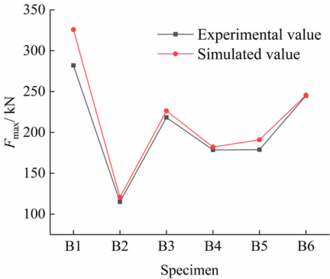
| − | | style="background:#efefef;text-align:left;padding:10px;font-size: 85%;"| '''Figure 10'''. Comparison of experimental and simulated <math display="inline"> F_{\max}</math> values | + | | style="background:#efefef;text-align:left;padding:10px;font-size: 85%;"|'''Figure 10'''. Comparison of experimental and simulated <math display="inline"> F_{\max}</math> values |
|} | |} | ||
| − | |||
Specimens B2, B3, and B6 (hereafter referred to as Group 1) had the same <math display="inline"> k </math> (0.29) and <math display="inline"> h_0/H </math> (0.5), but different <math display="inline"> l_0/h_0 </math> (4.0, 2.0, and 1.33, respectively) and different numbers of openings (3, 6, and 9, respectively). A comparison of <math display="inline"> F_y </math> and <math display="inline"> F_{\max}</math> of these three specimens revealed the following ([[#img-9|Figures 9]] and [[#img-10|10]]). 1): <math display="inline"> F_y </math> and <math display="inline"> F_{\max}</math> of the open-web beams decreased as <math display="inline"> l_0/h_0 </math> increased. <math display="inline"> l_0/h_0 </math> had a marked effect on the yield and ultimate loads. However, when <math display="inline"> l_0/h_0 </math> reached approximately 2, the yield and ultimate loads increased insignificantly as <math display="inline"> l_0/h_0 </math> was further decreased. 2) <math display="inline"> F_y </math> and <math display="inline"> F_{\max}</math> of the open-web beam increased with <math display="inline"> n </math>. More specifically, when <math display="inline"> n </math> increased from three to six, <math display="inline"> F_y </math> and <math display="inline"> F_{\max}</math> increased markedly. When <math display="inline"> n </math> increased from six to nine, <math display="inline"> F_y </math> and <math display="inline"> F_{\max}</math> did not increase markedly. 3) Group 1 specimens, i.e., B2, B3, and B6 had <math display="inline"> F_y </math> of 97.87, 196.25, and 210.61 kN, respectively, and <math display="inline"> F_{\max}</math> of 115, 218.22, and 244.94 kN, respectively. This indicates that for a given <math display="inline"> k </math>, decreasing <math display="inline"> l_0/h_0 </math> and increasing <math display="inline"> n </math> to achieve even opening distribution significantly increases the bearing capacity of the open-web beam. | Specimens B2, B3, and B6 (hereafter referred to as Group 1) had the same <math display="inline"> k </math> (0.29) and <math display="inline"> h_0/H </math> (0.5), but different <math display="inline"> l_0/h_0 </math> (4.0, 2.0, and 1.33, respectively) and different numbers of openings (3, 6, and 9, respectively). A comparison of <math display="inline"> F_y </math> and <math display="inline"> F_{\max}</math> of these three specimens revealed the following ([[#img-9|Figures 9]] and [[#img-10|10]]). 1): <math display="inline"> F_y </math> and <math display="inline"> F_{\max}</math> of the open-web beams decreased as <math display="inline"> l_0/h_0 </math> increased. <math display="inline"> l_0/h_0 </math> had a marked effect on the yield and ultimate loads. However, when <math display="inline"> l_0/h_0 </math> reached approximately 2, the yield and ultimate loads increased insignificantly as <math display="inline"> l_0/h_0 </math> was further decreased. 2) <math display="inline"> F_y </math> and <math display="inline"> F_{\max}</math> of the open-web beam increased with <math display="inline"> n </math>. More specifically, when <math display="inline"> n </math> increased from three to six, <math display="inline"> F_y </math> and <math display="inline"> F_{\max}</math> increased markedly. When <math display="inline"> n </math> increased from six to nine, <math display="inline"> F_y </math> and <math display="inline"> F_{\max}</math> did not increase markedly. 3) Group 1 specimens, i.e., B2, B3, and B6 had <math display="inline"> F_y </math> of 97.87, 196.25, and 210.61 kN, respectively, and <math display="inline"> F_{\max}</math> of 115, 218.22, and 244.94 kN, respectively. This indicates that for a given <math display="inline"> k </math>, decreasing <math display="inline"> l_0/h_0 </math> and increasing <math display="inline"> n </math> to achieve even opening distribution significantly increases the bearing capacity of the open-web beam. | ||
| Line 389: | Line 387: | ||
Specimens B3, B4, and B5 (hereafter referred to as Group 2) had the same <math display="inline"> n </math> (6) and were compared next. Specimen B3 had an <math display="inline"> h_0/H </math> of 0.5, <math display="inline"> l_0/h_0 </math> of 2.0, and <math display="inline"> k </math> of 0.29. <math display="inline"> h_0/H </math> of specimen B4 was increased to 0.6. Consequently, <math display="inline"> k </math> was increased from 0.29 to 0.35. Compared with specimen B3, <math display="inline"> l_0 </math> of specimen B5 was increased to 362.5 mm. Consequently, <math display="inline"> k </math> was increased from 0.29 to 0.35. | Specimens B3, B4, and B5 (hereafter referred to as Group 2) had the same <math display="inline"> n </math> (6) and were compared next. Specimen B3 had an <math display="inline"> h_0/H </math> of 0.5, <math display="inline"> l_0/h_0 </math> of 2.0, and <math display="inline"> k </math> of 0.29. <math display="inline"> h_0/H </math> of specimen B4 was increased to 0.6. Consequently, <math display="inline"> k </math> was increased from 0.29 to 0.35. Compared with specimen B3, <math display="inline"> l_0 </math> of specimen B5 was increased to 362.5 mm. Consequently, <math display="inline"> k </math> was increased from 0.29 to 0.35. | ||
| − | A comparison of Group 2 specimens revealed the following ([[#img-9|Figures 9]] and [[#img-10|10]]). 1) Compared with specimen B3, the yield and ultimate loads of specimen B4 decreased by 21.5% and 18.17%, respectively, due to the increased <math display="inline"> h_0</math>. This indicates that increasing <math display="inline"> k </math> by increasing <math display="inline"> h_0</math> decreases the bearing capacity of the open-web beam. 2) Compared with specimen B3, the yield and ultimate loads of specimen B5 decreased by 20.42%and 21.96%, respectively, due to the increased <math display="inline"> l_0 </math>. This indicates that increasing the opening aera ratio by increasing <math display="inline"> l_0 </math> decreases the bearing capacity of the open-web beam. 3) Compared with specimen B3, the yield and ultimate loads of specimens B4 and B5 decreased by similar magnitudes, which indicates that varying <math display="inline"> k </math> by varying either <math display="inline"> h_0</math> or length has similar effects on the bearing capacity. | + | A comparison of Group 2 specimens revealed the following ([[#img-9|Figures 9]] and [[#img-10|10]]). 1) Compared with specimen B3, the yield and ultimate loads of specimen B4 decreased by 21.5% and 18.17%, respectively, due to the increased <math display="inline"> h_0</math>. This indicates that increasing <math display="inline"> k </math> by increasing <math display="inline"> h_0</math> decreases the bearing capacity of the open-web beam. 2) Compared with specimen B3, the yield and ultimate loads of specimen B5 decreased by 20.42% and 21.96%, respectively, due to the increased <math display="inline"> l_0 </math>. This indicates that increasing the opening aera ratio by increasing <math display="inline"> l_0 </math> decreases the bearing capacity of the open-web beam. 3) Compared with specimen B3, the yield and ultimate loads of specimens B4 and B5 decreased by similar magnitudes, which indicates that varying <math display="inline"> k </math> by varying either <math display="inline"> h_0</math> or length has similar effects on the bearing capacity. |
===3.3 Analysis of load–deflection curve=== | ===3.3 Analysis of load–deflection curve=== | ||
| Line 402: | Line 400: | ||
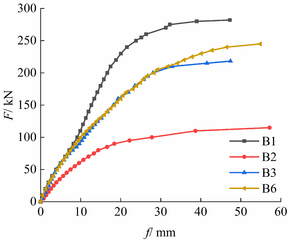
| style="background:#efefef;text-align:left;padding:10px;font-size: 85%;"| '''Figure 11'''. Load–deflection curves of Group 1 of specimens | | style="background:#efefef;text-align:left;padding:10px;font-size: 85%;"| '''Figure 11'''. Load–deflection curves of Group 1 of specimens | ||
|} | |} | ||
| − | + | <br> | |
| − | + | ||
| − | < | + | |
{| class="wikitable" style="margin: 0em auto 0.1em auto;border-collapse: collapse;width:auto;" | {| class="wikitable" style="margin: 0em auto 0.1em auto;border-collapse: collapse;width:auto;" | ||
|-style="background:white;" | |-style="background:white;" | ||
Latest revision as of 12:17, 25 June 2024
Abstract
The effects of opening parameters on the bending behavior of fixed open-web steel beams under static loading were experimentally investigated using six specimens of different opening length-to-height ratios, area ratios, and distributions. The experimentally obtained failure modes, bearing capacities, and load-displacement curves of the specimens were compared with those extracted from numerical simulations performed via Abaqus finite element analysis software. The results revealed the following: (i) The typical failure mode of the fixed open-web steel beams was plastic failure at the opening corners in the shear-bending sections, with compressive corners experiencing flexion and tensile corners experiencing tearing. (ii) For a given opening area ratio and opening height-to-beam height ratios, decreasing the opening length and increasing the number of openings significantly increased the bearing capacity of the open-web beam (by more than one-fold) when the openings were appropriately configured, compared with beams with a small number of large openings. (iii) Increasing the opening height and length had similar effects on the bending behavior of the open-web beam.
Keywords: Open-web beam, fixed support, bearing capacity, opening area ratio, opening length-to-height ratio
1. Introduction
Steel beams with web openings are widely used in large-span building structures as they reduce story height, use less steel, and facilitate the laying of pipelines. Chen et al. [1,2] performed a numerical analysis of open-web steel beams with shear connector joints of different rigidities to determine their effect on the static behavior of open-web beams. Liu et al. [3] analyzed stress state and deformation-resistance capacity of joints with respect to square steel tube wall thickness, stiffener plate dimension, and joint height. Sun et al. [4] derived a formula for calculating the shear rigidity of open-web steel sandwich plates using a continuous analysis method. Jiang et al. [5] proposed a simplified formula for calculating the deflection of T-section open-web steel beams. Yang et al. [6] investigated the deflection and stress distribution of open-web composite beams. Bai et al. [7] proposed a formula for calculating the strength of the control cross-sections of open-web steel beams. Su et al. [8] performed numerical simulations of fixed open-web beams with openings of different shapes (circular, hexagonal, and rectangular), and found that open-web beams with hexagonal openings performed the best, followed by those with circular and rectangular openings. Xu et al. [9-11] experimentally investigated the bearing capacity of simply supported open-web steel beams with different opening parameters to evaluate the effects of opening area ratio, distribution, and length-to-height ratio on the beam bending behavior. Previous studies mainly focused on simply supported open-web steel beams. However, the mechanical behavior of fixed open-web steel beams, which are more often used in engineering applications, remains to be further investigated.
In this study, the bending behavior of fixed open-web steel beams with chamfered-corner openings under monotonic static loading was experimentally investigated using six specimens of different opening parameters. The failure modes, bearing capacities, and deflections of the specimens were comparatively analyzed. Our results serve as a reference in engineering applications of open-web steel beams.
2. Experimental program
2.1 Experimental design
Six steel beam specimens were fabricated, as shown in Figure 1. Specimen B1 was a solid-web beam. Specimens B2 to B6 were open-web beams. Each of the six beams had a span of 3250 mm and a cross-sectional dimension of mm. The dimensions of the specimens are shown in Figure 1 (where the dashed lines indicate the axes of symmetry). The parameters of the openings of the specimens are presented in Table 1.
| ||||||||||||
| Figure 1. Dimensions of specimens (unit: mm) |
| Opening parameter | B1 | B2 | B3 | B4 | B5 | B6 |
|---|---|---|---|---|---|---|
| 0 | 3 | 6 | 6 | 6 | 9 | |
| (mm) | / | 600 | 300 | 300 | 362.5 | 200 |
| (mm) | / | 150 | 150 | 180 | 150 | 150 |
| / | 1.0 | 2.0 | 1.67 | 2.42 | 1.33 | |
| / | 0.5 | 0.5 | 0.6 | 0.5 | 0.5 | |
| 0 | 0.29 | 0.29 | 0.35 | 0.35 | 0.29 |
Note: Here, is the number of openings; is the length of openings; is the height of openings; is the cross-sectional height of the beam; is the opening length-to-height ratio; is the opening height-to-beam height ratio; and is the opening area ratio, i.e., the ratio of the area of the openings to that of the web of the solid-web beam.
2.2 Support design
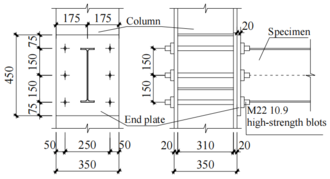
The two ends of the beam were each welded to a plate, which was bolted to a column of the test platform using high-strength bolts. Figure 2 shows an illustration of the support.
|
| Figure 2. Illustration of support (unit: mm) |
2.3 Test of material properties
The specimens were fabricated using Q235B steel. Tensile testing of the material was performed using eight specimens (four from the flange of the specimen and four from the web) according to specification GB/T 228.1-2021 [12]. Table 2 shows the results of the tensile testing.
| Material parameter | Yield strength (MPa) | Tensile strength (MPa) | Percentage elongation (%) |
|---|---|---|---|
| 6-mm web | 284.5 | 479.9 | 22.92 |
| 8-mm flange | 292.9 | 493.4 | 25.36 |
2.4 Loading setup and scheme
The strain of the specimens under loading was measured using strain gages (BX120-3AA and BX120-3CA, < Yiyang City Heshan district wide measurement electronics Co., Ltd>, <China>) and a static strain testing and analysis system (DH3816N, < Donghua Testing Technology Co., Ltd.>, <China>). The deflection of the specimen was measured using a dial gage, which was mounted at the bottom of the beam. Figure 3 shows the configuration of the dial gage, where is the total load.

|
| Figure 3. Configuration of displacement meters (unit: mm) |
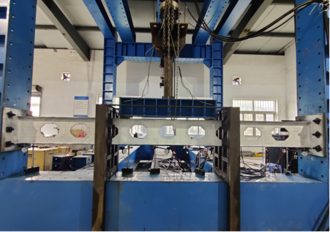
Each of the specimens was loaded at two symmetric points using an electro-hydraulic servo loading actuator (MAS-500/2Q, < Hangzhou Bangwei electromechanical control Engineering Co., Ltd>,<China>). A monotonic static step loading protocol was used. The loading was increased at a rate of 5 kN/min and held for 3 min after each 10-kN increment, and the morphology of the specimen was observed. When the loading could not be increased any further due to large local deformation or overall instability failure of the specimen, the specimen was considered to have reached its ultimate bearing capacity. Two lateral supports were mounted on each side of the beam, and the inner side of the supports was lubricated to ensure free deformation of the specimen in the vertical plane, and prevent it from capsizing in an untimely manner. Figure 4 shows the specimen loading setup.
|
| Figure 4. Photograph of loading setup |
3. Test results and discussion
3.1 Failure mode analysis
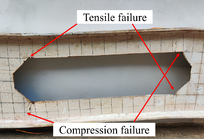
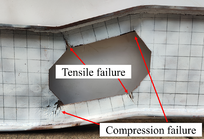
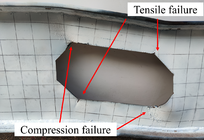
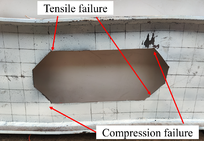
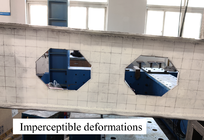
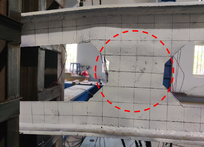
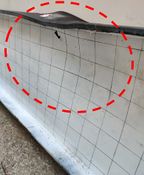
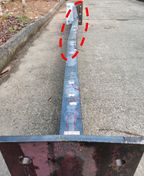
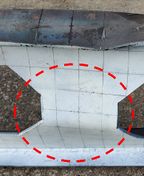
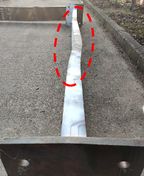
Figures 5 to 8 show the failure modes of the specimens. First, Figure 5 shows the failure modes at the opening corners. The open-web beams (specimens B2 to B6) exhibited similar failure modes at the opening corners. The section between the two loading points (i.e., the bending section) exhibited small strains and no evident failure at the opening corners. The sections between the supports and loading points (i.e., the bending-shear sections) first experienced flexural failure at the compressive corners and then tensile failure at the tensile corners, with the surface painting at the opening corners blistering and peeling off. Additionally, the strains at the opening corners, as measured by the strain gages increased abruptly, and four plastic hinges were formed. Specimen B6 exhibited imperceptible deformations at the opening corners. This was because of the small that reduced the secondary shear moment, and facilitated the transfer of shear force and bending moment at opening corners. The opening corners in the bending-shear sections were prone to plastic failure, because these areas experienced abruptly varying cross-sectional rigidity, bending and shear stresses, and stress concentration.
| ||||||||||||
| Figure 5. Failure modes at opening corners | ||||||||||||
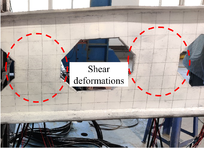
Figure 6 shows the deformations of the web between the openings. Specimens B2, B3, and B4 exhibited not so noticeable shear deformations of the web between openings due to the large spacing between the openings. By contrast, specimens B5 and B6 exhibited clearly evident shear deformations of the web between the openings due to the small and small spacing between the openings. This indicates that increasing the spacing between the openings contributes to higher shear strength of the web between the openings in the bending-shear sections.
| ||||
| Figure 6. Shear deformations of web between openings |
As shown in Figure 7, specimens B1 and B6 exhibited overall instability failure caused by flexural failure of the cross-sections at the loading points. This was because these specimens had a high bearing capacity, and toward the end of the loading process, a large concentrated load acted at the loading points, thereby causing compressive flexural failure of the web below the loading points. As the load increased further, the web experienced buckling deformation, which was a form of out-of-plane deformation, which in turn, finally led to an overall instability failure. This indicates that to prevent specimens with a high bearing capacity and evenly distributed openings from undergoing out-of-plane deformation, it is necessary to increase the structural strength of sections subjected to concentrated loads.
| ||||||||
| Figure 7. Deformations at loading points | ||||||||
Figure 8 shows the overall failure modes of the specimens.
| ||||||||||||
| Figure 8. Overall failure modes of specimens |
3.2 Analysis of bearing capacity
A numerical model of each test specimen was developed in the Abaqus finite element analysis environment (Dassault Systèmes) using the geometric dimensions and tested material strength of the specimens. In the modeling, a three-segment polygonal line constitutive model [13], the C3D8R element (eight-noded linear hexahedral element with reduced integration), and a cell size of 5 mm were employed. Table 3 shows a comparison of the experimentally obtained and simulated bearing capacities. The yield load was the load corresponding to the yield point, which was determined using the equal-energy method [14]. The failure load was equal to the peak load of the load–deflection curve.
| Parameter and error | Specimen | ||||||
|---|---|---|---|---|---|---|---|
| B1 | B2 | B3 | B4 | B5 | B6 | ||
| Yield load (kN) | Experiment | 257.68 | 97.87 | 196.25 | 153.96 | 156.17 | 210.61 |
| Simulation | 294.86 | 104.52 | 201.03 | 159.17 | 169.42 | 212.6 | |
| Error (%) | 14.43 | 6.79 | 2.44 | 3.38 | 8.48 | 0.94 | |
| Failure load (kN) | Experiment | 281.98 | 115 | 218.22 | 178.56 | 178.92 | 244.94 |
| Simulation | 325.77 | 93.53 | 226.34 | 182.14 | 190.93 | 245.57 | |
| Error (%) | 15.53 | 4.81 | 3.72 | 2.00 | 6.71 | 0.26 | |
As shown in Table 3, the differences between the experimental and simulation results for specimens B2 to B6 were small, while those for specimen B1 were large. This was because specimen B1 experienced a large load, compressive flexion in the cross-sections at the loading points, and finally instability failure.
Figures 9 and 10 show the variation trends of the tested and simulated yield and ultimate loads of the specimens. For all the specimens, the simulated and were larger than the experimental ones. This was because of the defects in the specimens, formed during the fabrication process. However, the experimental and simulation results exhibited similar trends. As increased, decreased, or distribution of the openings changed from concentrated to even, the experimental and simulated and values of the open-web beams increased.
|
| Figure 9. Comparison of experimental and simulated values |
|
| Figure 10. Comparison of experimental and simulated values |
Specimens B2, B3, and B6 (hereafter referred to as Group 1) had the same (0.29) and (0.5), but different (4.0, 2.0, and 1.33, respectively) and different numbers of openings (3, 6, and 9, respectively). A comparison of and of these three specimens revealed the following (Figures 9 and 10). 1): and of the open-web beams decreased as increased. had a marked effect on the yield and ultimate loads. However, when reached approximately 2, the yield and ultimate loads increased insignificantly as was further decreased. 2) and of the open-web beam increased with . More specifically, when increased from three to six, and increased markedly. When increased from six to nine, and did not increase markedly. 3) Group 1 specimens, i.e., B2, B3, and B6 had of 97.87, 196.25, and 210.61 kN, respectively, and of 115, 218.22, and 244.94 kN, respectively. This indicates that for a given , decreasing and increasing to achieve even opening distribution significantly increases the bearing capacity of the open-web beam.
Specimens B3, B4, and B5 (hereafter referred to as Group 2) had the same (6) and were compared next. Specimen B3 had an of 0.5, of 2.0, and of 0.29. of specimen B4 was increased to 0.6. Consequently, was increased from 0.29 to 0.35. Compared with specimen B3, of specimen B5 was increased to 362.5 mm. Consequently, was increased from 0.29 to 0.35.
A comparison of Group 2 specimens revealed the following (Figures 9 and 10). 1) Compared with specimen B3, the yield and ultimate loads of specimen B4 decreased by 21.5% and 18.17%, respectively, due to the increased . This indicates that increasing by increasing decreases the bearing capacity of the open-web beam. 2) Compared with specimen B3, the yield and ultimate loads of specimen B5 decreased by 20.42% and 21.96%, respectively, due to the increased . This indicates that increasing the opening aera ratio by increasing decreases the bearing capacity of the open-web beam. 3) Compared with specimen B3, the yield and ultimate loads of specimens B4 and B5 decreased by similar magnitudes, which indicates that varying by varying either or length has similar effects on the bearing capacity.
3.3 Analysis of load–deflection curve
Figures 11 and 12 show the load–deflection curves of specimen groups 1 and 2, respectively, along with that of B1 for comparison.
|
| Figure 11. Load–deflection curves of Group 1 of specimens |
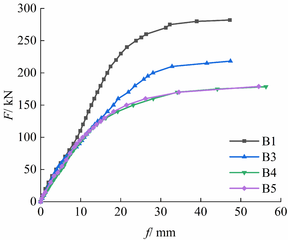
|
| Figure 12. Load–deflection curves of Group 2 of specimens |
As shown in Figure 11, Specimens of Group 1 (B2, B3, and B6) had the same and but different (3, 6, and 9, respectively). Specimen B2 had the most concentrated opening distribution, and its rigidity decreased most rapidly as the load increased. In contrast, the load–deflection curves of specimen B3 and B6 significantly overlapped that of specimen B1 during the early stage of the loading process. Toward the end of the loading process, the rigidity of specimen B6 decreased more slowly than that of specimen B3, which indicates that the evenness of the opening distribution is a major factor affecting the rigidity of the open-web beam, i.e., an even opening distribution markedly improves the rigidity.
As shown in Figures 12, the load–deflection curves of specimens B4 and B5 overlap each other, which indicates that varying by varying either or has similar effects on the rigidity.
4. Conclusions
The bending behavior of fixed open-web beams of different opening lengths, heights, and ratios under monotonic static loading was experimentally investigated and numerically verified. Our key findings are summarized as follows:
1) The failure of the fixed open beams started from the opening corners in the shear-bending sections, with the diagonal corners experiencing tension and compression, respectively. When the beam failed, four plastic hinges were formed along the opening circumference, with the compressive opening corners experiencing flexion and the tensile corners experiencing tearing.
2) For a given opening area ratio and opening height-to-beam height ratio, decreasing the opening length and increasing the number of openings to achieve more even and distributed opening distribution significantly increased the flexural bearing capacity of the open-web beam. When openings were appropriately configured, the bearing capacity was increased by more than one-fold.
3) Increasing the opening height or length decreased the rigidity and bearing capacity of the open-web beam, and for a given increase in the opening area ratio, had similar effects on the bending behavior.
References
[1] Chen Q., Xiao J.C., Qi S.Y. et al. Analysis on influence of rigid region in steel vierendeel girder. Journal of Guizhou University (Natural Sciences), 34(01):95-98, 2017.
[2] Chen Q., Xiao J.C., Ma K.J. et al. Effects of shear connector joints on static behavior in steel open-web sandwich plates. Journal of Guangxi University (Natural Science Edition), 43(01):41-49, 2018.
[3] Liu Z.G., Ma K.J., Xiao J.C. et al. Effects of stiffened plate on static behavior of shear connector joints in steel open-web sandwich plate. Progress in Steel Building Structures, 19(02):29-37, 2017.
[4] Sun T., Ma K.J., Liu X.Q. et al. Equivalent shear stiffness analysis of steel vierendeel sandwich plate structure. Spatial Structures, 23(02):54-59+69, 2017.
[5] Jiang L., Ma K.J., Zhang H.G. et al. Practical method for deflection calculation of t-section steel vierendeel beams with shear connector. Spatial Structures, 25(02):39-45, 2019.
[6] Yang Q.Z., Ma K.J., Jian L. et al. Static behavior and response regularity of square steel-concrete composite open-web beam. Building Structure, 48(24):79-84, 2018.
[7] Bai Z.Q., Wei Y.H., Chen J. et al. A design method of chords in steel open-web girders with square-tube connectors. Spatial Structures, 28(01):86-96, 2022.
[8] Su R.Q., Xu J.X., Dong W.N. Numerical analysis of mechanical properties of castellated beam. Journal of Gansu Sciences, 31(05):107-112, 2019.
[9] Xu H.G. Theoretical and experimental study on hollow steel beam. Hangzhou: Zhejiang University of Science and Technology, 2020.
[10] Xu H.G., Feng Q.X., Duanmu X.F. et al. Experimental study on influence of different chamfering forms on mechanical properties of hollow beams. Journal of Zhejiang University of Science and Technology, 32(03):222-231, 2020.
[11] Xu H.G., Feng Q.X., Duanmu X.F. et al. Experimental study on the effect of openings on the bearing capacity and deflection of hollow beam. Building Structure, 52(06):104-110, 2022.
[12] GB/T 228.1-2021. Metallic materials Tensile testing—prat 1: method of test at room temperature. Beijing: Standards Press of China, 2021.
[13] Li Q.R. Experimental study on static performance of h-section column end plate connection of castellated beam. Shenyang: Shenyang Jianzhu University, 2020.
[14] Feng P., Qiang H.L., Ye L.P. Discussion and definition on yield points of materials, members and structures. Engineering Mechanics, 34(03):36-46, 2017.Document information
Published on 29/05/24
Accepted on 12/05/24
Submitted on 20/03/24
Volume 40, Issue 2, 2024
DOI: 10.23967/j.rimni.2024.05.007
Licence: CC BY-NC-SA license
Share this document
Keywords
claim authorship
Are you one of the authors of this document?


