| (4 intermediate revisions by the same user not shown) | |||
| Line 141: | Line 141: | ||
where <math display="inline"> D </math> is the damage variable, <math display="inline"> E </math> is the elastic modulus of the non-damaged material, and <math display="inline"> {E}^{\ast }(n) </math> is the elastic modulus after damage. | where <math display="inline"> D </math> is the damage variable, <math display="inline"> E </math> is the elastic modulus of the non-damaged material, and <math display="inline"> {E}^{\ast }(n) </math> is the elastic modulus after damage. | ||
| − | Generally, it can be seen from | + | Generally, it can be seen from Eq. (5) that the value range of the damage variable <math display="inline"> D </math> is 0-1. Since the damage variable <math display="inline"> D </math> has a monotonically increasing relationship with the value <math display="inline"> n </math> of the elastic modulus reduction, <math display="inline"> n </math> (<math display="inline">0\leq n\leq 20</math>) is used to represent the damage degree of the element in the following in order to represent the damage state of the element in a more concise and intuitive way. |
In summary, the criterion of rock damage and failure based on the strain-energy-density theory is as follows: | In summary, the criterion of rock damage and failure based on the strain-energy-density theory is as follows: | ||
| Line 177: | Line 177: | ||
where <math display="inline">{\sigma }_{x}^{i}</math>, <math display="inline">{\sigma }_{y}^{i}</math>, <math display="inline">{\sigma }_{z}^{i}</math>, <math display="inline">{\tau }_{xy}^{i}</math>, <math display="inline">{\tau }_{xz}^{i}</math>, <math display="inline">{\tau }_{yz}^{i}</math> is the stress of the element at step <math display="inline"> i </math>, and <math display="inline">{\sigma }_{x}^{i-1}</math>, <math display="inline">{\sigma }_{y}^{i-1}</math>, <math display="inline">{\sigma }_{z}^{i-1}</math>, <math display="inline">{\tau }_{xy}^{i-1}</math>, <math display="inline">{\tau }_{xz}^{i-1}</math>, <math display="inline">{\tau }_{yz}^{i-1}</math> is the stress at the previous step. The strain is expressed in the same manner. If <math display="inline">i=0</math>, then the strain energy density of the element is <math display="inline">(dW/dV)=</math><math>0</math>. | where <math display="inline">{\sigma }_{x}^{i}</math>, <math display="inline">{\sigma }_{y}^{i}</math>, <math display="inline">{\sigma }_{z}^{i}</math>, <math display="inline">{\tau }_{xy}^{i}</math>, <math display="inline">{\tau }_{xz}^{i}</math>, <math display="inline">{\tau }_{yz}^{i}</math> is the stress of the element at step <math display="inline"> i </math>, and <math display="inline">{\sigma }_{x}^{i-1}</math>, <math display="inline">{\sigma }_{y}^{i-1}</math>, <math display="inline">{\sigma }_{z}^{i-1}</math>, <math display="inline">{\tau }_{xy}^{i-1}</math>, <math display="inline">{\tau }_{xz}^{i-1}</math>, <math display="inline">{\tau }_{yz}^{i-1}</math> is the stress at the previous step. The strain is expressed in the same manner. If <math display="inline">i=0</math>, then the strain energy density of the element is <math display="inline">(dW/dV)=</math><math>0</math>. | ||
| − | When the strain energy density of an element <math display="inline">(dW/dV)>(dW/dV{)}_{u}</math>, the element begins to damage, and the degree of damage <math display="inline"> n </math> is calculated | + | When the strain energy density of an element <math display="inline">(dW/dV)>(dW/dV{)}_{u}</math>, the element begins to damage, and the degree of damage <math display="inline"> n </math> is calculated as follows: |
{| class="formulaSCP" style="width: 100%; text-align: center;" | {| class="formulaSCP" style="width: 100%; text-align: center;" | ||
| Line 192: | Line 192: | ||
Where <math display="inline"> n </math> takes the integer part of the calculation result of Eq. (7), that is, the value range is <math display="inline">1, 2, \ldots , 20</math>. The effective elastic modulus <math display="inline">{E}^{\ast }</math> of the damage element is obtained from Eq. (4) based on the value of <math display="inline"> n </math>. | Where <math display="inline"> n </math> takes the integer part of the calculation result of Eq. (7), that is, the value range is <math display="inline">1, 2, \ldots , 20</math>. The effective elastic modulus <math display="inline">{E}^{\ast }</math> of the damage element is obtained from Eq. (4) based on the value of <math display="inline"> n </math>. | ||
| − | In the linear elastic state, the expression for the strain energy density of the element | + | In the linear elastic state, the expression for the strain energy density of the element is: |
{| class="formulaSCP" style="width: 100%; text-align: center;" | {| class="formulaSCP" style="width: 100%; text-align: center;" | ||
| Line 243: | Line 243: | ||
| style="background:#efefef;text-align:left;padding:10px;font-size: 85%;"| '''Figure 3'''. Calculation flow of numerical simulation | | style="background:#efefef;text-align:left;padding:10px;font-size: 85%;"| '''Figure 3'''. Calculation flow of numerical simulation | ||
|} | |} | ||
| − | |||
===3.2 Numerical simulation of Brazilian splitting=== | ===3.2 Numerical simulation of Brazilian splitting=== | ||
| Line 318: | Line 317: | ||
|} | |} | ||
| − | ==4. Numerical | + | ==4. Numerical simulation of damage and failure of tunnel surrounding rock== |
In this paper, the three-dimensional geo-mechanical model test of weak and broken surrounding rock of the tunnel in article [28] is taken as an example to simulate the overload failure test of the full-face excavation without support section. Based on the strain-energy-density theory, the numerical simulation of progressive damage and failure of tunnel surrounding rock is carried out. | In this paper, the three-dimensional geo-mechanical model test of weak and broken surrounding rock of the tunnel in article [28] is taken as an example to simulate the overload failure test of the full-face excavation without support section. Based on the strain-energy-density theory, the numerical simulation of progressive damage and failure of tunnel surrounding rock is carried out. | ||
| − | The geo-mechanical model test takes the Liangshui Tunnel on Lanzhou-Chongqing Railway as the engineering background. The model size is width | + | The geo-mechanical model test takes the Liangshui Tunnel on Lanzhou-Chongqing Railway as the engineering background. The model size is width <math>\times</math> height = 2.4m <math>\times</math> 2.4m, the geometric and stress similarity ratio is 1:50, and the actual size of the tunnel is taken to establish the numerical model. Set the horizontal direction of the tunnel cross section as <math display="inline"> x </math>-axis, the vertical direction as <math display="inline"> y </math>-axis, and the excavation direction as <math display="inline"> z </math>-axis. The calculation range of the model is <math display="inline">-60\leq x\leq 60m</math> and <math display="inline">-67.5\leq y\leq 52.5m</math>. The numerical model is shown in [[#img-9|Figure 9]], which is divided into 3246 elements with 6668 nodes. Vertical constraints are applied to the base of the model along the <math display="inline"> Y </math>-axis; horizontal constraints are applied to both sides of the model along the <math display="inline"> X </math>-axis; constraints are imposed on the front and back of the model along the <math display="inline"> Z </math>-axis. The upper part of the model is the surface, serving as a free surface and unconstrained. The gravity stress distribution is considered in the vertical direction of the model, and the horizontal tectonic stress distribution is considered in the horizontal direction. Additionally, in order to simulate the 200 m burial depth of the tunnel, vertical ground stresses at a depth of 147.5 m and corresponding horizontal ground stress loads were applied to the model. |
| − | <div class=" | + | <div id='img-9'></div> |
| + | {| class="wikitable" style="margin: 0em auto 0.1em auto;border-collapse: collapse;width:auto;" | ||
| + | |-style="background:white;" | ||
| + | |style="text-align: center;padding:10px;"| [[File:Draft_Sun_139268125-image12.png|centre|361x361px]] | ||
| + | |- | ||
| + | | style="background:#efefef;text-align:left;padding:10px;font-size: 85%;"| '''Figure 9'''. Numerical simulation model | ||
| + | |} | ||
| − | + | ||
| + | The parameters of the numerical calculation are taken according to the physical and mechanical parameters of the tunnel surrounding rock. The calculation parameters are as follows: the density <math display="inline">\rho =2500\mbox{kg/m}^{3}</math>, the modulus of elasticity <math display="inline">E=2G</math>Pa, the Poisson's ratio <math display="inline">v=0.35</math>, the cohesion <math display="inline">c=0.3</math>MPa, the angle of internal friction <math display="inline">\varphi =3{7}^{\circ }</math>, the ultimate stress of element <math display="inline">{\sigma }_{u}=3</math>MPa, the strain at ultimate stress <math display="inline">{\epsilon }_{u}=1\times 1{0}^{-3}</math>, and the strain in case of fracture <math display="inline">{\epsilon }_{f}=1\times 1{0}^{-2}</math>. | ||
The geo-mechanical model was subjected to an overload test after the full-face unsupported excavation, and the buried depth of the tunnel was increased step by step with a gradient of 50 m buried depth until the unsupported surrounding rock appeared obvious damage. In order to compare with the experimental phenomena, the full-face excavation was first carried out in the numerical model, then the vertical load of 50 m buried depth was added sequentially on the top of the model, and the gradient load of corresponding horizontal ground stress was added on both sides of the model. | The geo-mechanical model was subjected to an overload test after the full-face unsupported excavation, and the buried depth of the tunnel was increased step by step with a gradient of 50 m buried depth until the unsupported surrounding rock appeared obvious damage. In order to compare with the experimental phenomena, the full-face excavation was first carried out in the numerical model, then the vertical load of 50 m buried depth was added sequentially on the top of the model, and the gradient load of corresponding horizontal ground stress was added on both sides of the model. | ||
| Line 332: | Line 338: | ||
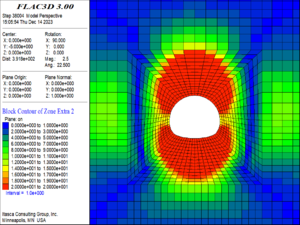
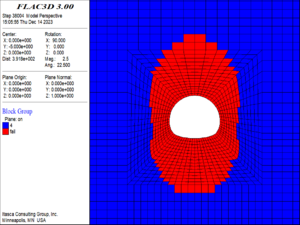
Based on the strain-energy-density theory, the numerical simulation results of the progressive damage and failure of the tunnel surrounding rock during the loading process are as follows: | Based on the strain-energy-density theory, the numerical simulation results of the progressive damage and failure of the tunnel surrounding rock during the loading process are as follows: | ||
| − | (1) When the buried depth increased to 250 m, the damage and failure of the surrounding rock are shown in [[# | + | (1) When the buried depth increased to 250 m, the damage and failure of the surrounding rock are shown in [[#img-10|Figure 10]]. At this time, the surrounding rock of the tunnel has not been failure, but the surrounding rock of the vault and the arch bottom within the range of about one times the diameter of the tunnel began to damage, and at the same time, a small number of the elements at the position of one time the diameter of the tunnel on the left and right sides of the arch waist are also damaged. The damage degree of the surrounding rock is small overall. The maximum damage degree of the element is 2, and the maximum damage position is at the vault and arch bottom. |
| − | <div class=" | + | <div id='img-10'></div> |
| − | + | {| class="wikitable" style="margin: 0em auto 0.1em auto;border-collapse: collapse;width:auto;" | |
| − | {| style=" | + | |-style="background:white;" |
| + | |align="center" | | ||
| + | {|style="margin: 0em auto 0.1em auto;width:auto;" | ||
| + | |+ | ||
|- | |- | ||
| − | | style="text-align: center;padding:10px;"| [[Image:Draft_Sun_139268125-image13.png|300px]] | + | |style="text-align: center;padding:10px;"| [[Image:Draft_Sun_139268125-image13.png|300px]] |
| − | | style="text-align: center;padding:10px;"| [[Image:Draft_Sun_139268125-image14.png|300px]] | + | |style="text-align: center;padding:10px;"| [[Image:Draft_Sun_139268125-image14.png|300px]] |
|- | |- | ||
| − | | style="text-align: center;font-size: 75%;"|(a) Contour of damage | + | |style="text-align: center;font-size: 75%;padding-bottom:10px;"|(a) Contour of damage |
| − | | style="text-align: center;font-size: 75%;"|(b) Failure status | + | |style="text-align: center;font-size: 75%;padding-bottom:10px;"|(b) Failure status |
| − | |- style="text-align: | + | |} |
| − | + | |- | |
| + | | style="background:#efefef;text-align:left;padding:10px;font-size: 85%;"| '''Figure 10'''. Damage and failure contour of the surrounding rock (250m buried depth) | ||
|} | |} | ||
| − | |||
| − | <div class=" | + | (2) When the buried depth increased to 300 m, as shown in [[#img-11|Figure 11]], the local elements of the tunnel vault and arch bottom began to fail, and the maximum damage value of the elements reached 16. The damage range of the surrounding rock of the vault and the arch bottom extended to twice the diameter of the tunnel. At this time, the side wall of the tunnel has not yet failed, but the elements within about 0.8 times the tunnel diameter outside the side wall have been damaged. |
| − | + | ||
| − | {| style=" | + | <div id='img-11'></div> |
| + | {| class="wikitable" style="margin: 0em auto 0.1em auto;border-collapse: collapse;width:auto;" | ||
| + | |-style="background:white;" | ||
| + | |align="center" | | ||
| + | {|style="margin: 0em auto 0.1em auto;width:auto;" | ||
| + | |+ | ||
|- | |- | ||
| − | | style="text-align: center;padding:10px;"| [[Image:Draft_Sun_139268125-image15.png|300px]] | + | |style="text-align: center;padding:10px;"| [[Image:Draft_Sun_139268125-image15.png|300px]] |
| − | | style="text-align: center;padding:10px;"| [[Image:Draft_Sun_139268125-image16.png|center|300px]] | + | |style="text-align: center;padding:10px;"| [[Image:Draft_Sun_139268125-image16.png|center|300px]] |
|- | |- | ||
| − | | style="text-align: center;font-size: 75%;"|(a) Contour of damage | + | |style="text-align: center;font-size: 75%;padding-bottom:10px;"|(a) Contour of damage |
| − | | style="text-align: center;font-size: 75%;"|(b) Failure status | + | |style="text-align: center;font-size: 75%;padding-bottom:10px;"|(b) Failure status |
| − | |- style="text-align: | + | |} |
| − | + | |- | |
| + | | style="background:#efefef;text-align:left;padding:10px;font-size: 85%;"| '''Figure 11'''. Damage and failure contour of the surrounding rock (300m buried depth) | ||
|} | |} | ||
| − | |||
| − | <div class=" | + | (3) When the buried depth increased to 600 m, as shown in [[#img-12|Figure 12]], the damage range of the tunnel surrounding rock continued to expand, extending from the damage area of the tunnel vault and arch bottom to the location of the sidewalls, in which the damage range of the vault increased significantly. From the sidewalls to the arch foot and arch tip, damage increased gradually. The damage of the elements at the top and bottom of the tunnel reached a maximum value of 20, which indicating that the elements were completely fractured and had lost their load-bearing capacity. |
| − | + | ||
| − | {| style=" | + | <div id='img-12'></div> |
| + | {| class="wikitable" style="margin: 0em auto 0.1em auto;border-collapse: collapse;width:auto;" | ||
| + | |-style="background:white;" | ||
| + | |align="center" | | ||
| + | {|style="margin: 0em auto 0.1em auto;width:auto;" | ||
| + | |+ | ||
|- | |- | ||
| − | | style="text-align: center;padding:10px;"| [[Image:Draft_Sun_139268125-image17.png|300px]] | + | |style="text-align: center;padding:10px;"| [[Image:Draft_Sun_139268125-image17.png|300px]] |
| − | | style="text-align: center;padding:10px;"| [[Image:Draft_Sun_139268125-image18.png|center|300px]] | + | |style="text-align: center;padding:10px;"| [[Image:Draft_Sun_139268125-image18.png|center|300px]] |
|- | |- | ||
| − | | style="text-align: center;font-size: 75%;"|(a) Contour of damage | + | |style="text-align: center;font-size: 75%;padding-bottom:10px;"|(a) Contour of damage |
| − | | style="text-align: center;font-size: 75%;"|(b) Failure status | + | |style="text-align: center;font-size: 75%;padding-bottom:10px;"|(b) Failure status |
| − | |- style="text-align: | + | |} |
| − | + | |- | |
| + | | style="background:#efefef;text-align:left;padding:10px;font-size: 85%;"| '''Figure 12'''. Damage and failure contour of the surrounding rock (600m buried depth) | ||
|} | |} | ||
| − | |||
| − | <div class=" | + | (4) When the buried depth increased to 900 m, as shown in [[#img-13|Figure 13]], the failure occurred over a large area around the tunnel, and this included contiguous areas of failure at the top of the arch, the sidewalls, and the bottom of the arch, which tended to collapse as a whole. The damage reached a maximum value of 20 in most of the elements around the tunnel. |
| − | + | ||
| − | {| style=" | + | <div id='img-13'></div> |
| + | {| class="wikitable" style="margin: 0em auto 0.1em auto;border-collapse: collapse;width:auto;" | ||
| + | |-style="background:white;" | ||
| + | |align="center" | | ||
| + | {|style="margin: 0em auto 0.1em auto;width:auto;" | ||
| + | |+ | ||
|- | |- | ||
| − | | style="text-align: center;padding:10px;"| [[Image:Draft_Sun_139268125-image19.png|300px]] | + | |style="text-align: center;padding:10px;"| [[Image:Draft_Sun_139268125-image19.png|300px]] |
| − | | style="text-align: center;padding:10px;"| [[Image:Draft_Sun_139268125-image20.png|center|300px]] | + | |style="text-align: center;padding:10px;"| [[Image:Draft_Sun_139268125-image20.png|center|300px]] |
|- | |- | ||
| − | | style="text-align: center;font-size: 75%;"|(a) Contour of damage | + | |style="text-align: center;font-size: 75%;padding-bottom:10px;"|(a) Contour of damage |
| − | | style="text-align: center;font-size: 75%;"|(b) Failure status | + | |style="text-align: center;font-size: 75%;padding-bottom:10px;"|(b) Failure status |
| − | |- style="text-align: | + | |} |
| − | + | |- | |
| + | | style="background:#efefef;text-align:left;padding:10px;font-size: 85%;"| '''Figure 13'''. Damage and failure contour of the surrounding rock (900m buried depth) | ||
|} | |} | ||
| − | |||
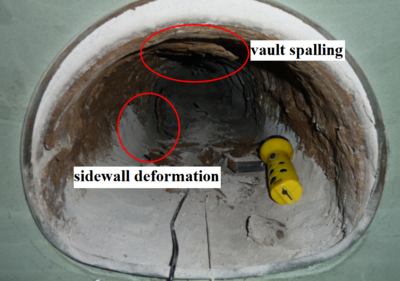
| − | + | The results of the overloading test of the geo-mechanical model are as follows [28]: when the burial depth was increased to 300 m, the surrounding rock of the tunnel began to appear localized failure, while the side wall had not yet exhibited obvious failure; when the burial depth was increased to 600 m, the tunnel vault and the side wall both appeared large-scale failure; when the loading reached a burial depth equivalent to 900 m, the surrounding rock appeared to have a large area of significant failure, and the overall signs of collapse also appeared. In the process of overloading, the failure area of surrounding rock gradually expanded, and the failure area was mainly concentrated in the area above the vault. There were also local failure areas on both sides of the side wall, and the failure was gradually aggravated from the side wall to the arch foot and the arch tip. The on-site failure of the model overload test is shown in [[#img-14|Figure 14]]. | |
| − | In the process of tunnel overload, the variation curve of vault settlement with buried depth in numerical calculation and overload test is shown in [[# | + | <div id='img-14'></div> |
| + | {| class="wikitable" style="margin: 0em auto 0.1em auto;border-collapse: collapse;width:auto;" | ||
| + | |-style="background:white;" | ||
| + | |style="text-align: center;padding:10px;"| [[File:Draft Sun 139268125-image21..png|centre|400x400px]] | ||
| + | |- | ||
| + | | style="background:#efefef;text-align:left;padding:10px;font-size: 85%;"| '''Figure 14'''. Image of overload failure in overload test | ||
| + | |} | ||
| + | |||
| + | |||
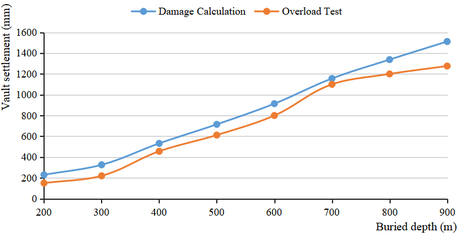
| + | In the process of tunnel overload, the variation curve of vault settlement with buried depth in numerical calculation and overload test is shown in [[#img-15|Figure 15]]. | ||
| + | |||
| + | <div id='img-15'></div> | ||
| + | {| class="wikitable" style="margin: 0em auto 0.1em auto;border-collapse: collapse;width:auto;" | ||
| + | |-style="background:white;" | ||
| + | |style="text-align: center;padding:10px;"| [[File:Draft_Sun_139268125-image22.png|centre|460x460px]] | ||
| + | |- | ||
| + | | style="background:#efefef;text-align:left;padding:10px;font-size: 85%;"| '''Figure 15'''. Settlement curves of tunnel vault with burial depth | ||
| + | |} | ||
| − | |||
Comparison between the numerical simulation results and the overload test results reveals that the progressive failure law of tunnel surrounding rock with the increase of buried depth by numerical simulation is largely consistent with the test, and the specific failure process also aligns well. The vault settlement calculated by numerical calculation is basically consistent with the test results, and the change trend is consistent. This indicates that the model is accurate and feasible for simulating the progressive damage and failure process of tunnel surrounding rock. | Comparison between the numerical simulation results and the overload test results reveals that the progressive failure law of tunnel surrounding rock with the increase of buried depth by numerical simulation is largely consistent with the test, and the specific failure process also aligns well. The vault settlement calculated by numerical calculation is basically consistent with the test results, and the change trend is consistent. This indicates that the model is accurate and feasible for simulating the progressive damage and failure process of tunnel surrounding rock. | ||
| Line 417: | Line 457: | ||
==References== | ==References== | ||
| + | <div class="auto" style="text-align: left;width: auto; margin-left: auto; margin-right: auto;font-size: 85%;"> | ||
| − | <span id='_Ref153799061'></span>[1] Chen X.S., Xu Z.H., Bao X.H., Wang X.T., Fu Y.B. Challenges and technological breakthroughs in tunnel construction in China. China Journal of Highway and Transport, 33(12): 1-14, 2020. | + | <span id='_Ref153799061'></span>[1] Chen X.S., Xu Z.H., Bao X.H., Wang X.T., Fu Y.B. Challenges and technological breakthroughs in tunnel construction in China. China Journal of Highway and Transport, 33(12):1-14, 2020. |
| − | <span id='_Ref158140073'></span>[2] Editorial Department of China Journal of Highway and Transport. Review on China’s traffic tunnel engineering (2022). China Journal of Highway and Transport, 35(4): 1-40, 2022. | + | <span id='_Ref158140073'></span>[2] Editorial Department of China Journal of Highway and Transport. Review on China’s traffic tunnel engineering (2022). China Journal of Highway and Transport, 35(4):1-40, 2022. |
| − | <span id='_Ref153806612'></span>[3] Mandal S.K., Singh M.M. Evaluating extent and causes of overbreak in tunnels. Tunnelling and Underground Space Technology, 24(1): 22-36, 2009. | + | <span id='_Ref153806612'></span>[3] Mandal S.K., Singh M.M. Evaluating extent and causes of overbreak in tunnels. Tunnelling and Underground Space Technology, 24(1):22-36, 2009. |
| − | [4] Zhou X.P., Qian Q.H., Zhang B.H. Zonal disintegration mechanism of deep crack-weakened rock masses under dynamic unloading. Acta Mechanica Solida Sinica, 22(3): 240-250, 2009. | + | [4] Zhou X.P., Qian Q.H., Zhang B.H. Zonal disintegration mechanism of deep crack-weakened rock masses under dynamic unloading. Acta Mechanica Solida Sinica, 22(3):240-250, 2009. |
| − | [5] Golshani A., Oda M., Okui Y., Takemura T., Munkhtogoo E. Numerical simulation of the excavation damaged zone around an opening in brittle rock. International Journal of Rock Mechanics & Mining Sciences, 44(6): 835-845, 2007. | + | [5] Golshani A., Oda M., Okui Y., Takemura T., Munkhtogoo E. Numerical simulation of the excavation damaged zone around an opening in brittle rock. International Journal of Rock Mechanics & Mining Sciences, 44(6):835-845, 2007. |
| − | <span id='_Ref29352'></span>[6] Zhu H.H., Huang F., Xu Q.W. Model test and numerical simulation for progressive failure of weak and fractured tunnel surrounding rock under different overburden depths. Chinese Journal of Rock Mechanics and Engineering, 29(6): 1113-1122, 2010. | + | <span id='_Ref29352'></span>[6] Zhu H.H., Huang F., Xu Q.W. Model test and numerical simulation for progressive failure of weak and fractured tunnel surrounding rock under different overburden depths. Chinese Journal of Rock Mechanics and Engineering, 29(6):1113-1122, 2010. |
| − | <span id='_Ref158140153'></span>[7] Guo C.X., Fan L.F., Han K., Han K.H., Li P.F., Zhang M.J. Progressive failure analysis of shallow circular tunnel based on the functional catastrophe | + | <span id='_Ref158140153'></span>[7] Guo C.X., Fan L.F., Han K., Han K.H., Li P.F., Zhang M.J. Progressive failure analysis of shallow circular tunnel based on the functional catastrophe theory considering strain softening of surrounding rock mass. Tunnelling and Underground Space Technology, 131, 104799, 2023. |
| − | <span id='_Ref153806677'></span>[8] Xie H.P., Peng R.D., Ju Y. Energy dissipation of rock deformation and fracture. Chinese Journal of Rock Mechanics and Engineering, 23(21): 3565-3570, 2004. | + | <span id='_Ref153806677'></span>[8] Xie H.P., Peng R.D., Ju Y. Energy dissipation of rock deformation and fracture. Chinese Journal of Rock Mechanics and Engineering, 23(21):3565-3570, 2004. |
| − | [9] Sujatha V., Kishen J.M.C., ASCE A.M. Energy release rate due to friction at bimaterial interface in dams. Journal of Engineering Mechanics, 129(7): 793-800, 2003. | + | [9] Sujatha V., Kishen J.M.C., ASCE A.M. Energy release rate due to friction at bimaterial interface in dams. Journal of Engineering Mechanics, 129(7):793-800, 2003. |
| − | <span id='_Ref158140397'></span>[10] He M.M., Huang B.Q., Zhu C.H., Chen Y.S., Li N. Energy dissipation-based method for fatigue life prediction of rock salt. Rock Mechanics and Rock Engineering, 51(5): 1447-1455, 2018. | + | <span id='_Ref158140397'></span>[10] He M.M., Huang B.Q., Zhu C.H., Chen Y.S., Li N. Energy dissipation-based method for fatigue life prediction of rock salt. Rock Mechanics and Rock Engineering, 51(5):1447-1455, 2018. |
| − | <span id='_Ref153806744'></span>[11] Xie H.P., Ju Y., Li L.Y. Criteria for strength and structural failure of rocks based on energy dissipation and energy release principles. Chinese Journal of Rock Mechanics and Engineering, 24(17): 3003-3010, 2005. | + | <span id='_Ref153806744'></span>[11] Xie H.P., Ju Y., Li L.Y. Criteria for strength and structural failure of rocks based on energy dissipation and energy release principles. Chinese Journal of Rock Mechanics and Engineering, 24(17):3003-3010, 2005. |
| − | <span id='_Ref153806851'></span>[12] Xie H.P., Ju Y., Li L.Y., Peng R.D. Energy mechanism of deformation and failure of rock masses. Chinese Journal of Rock Mechanics and Engineering, 9: 1729-1740, 2008. | + | <span id='_Ref153806851'></span>[12] Xie H.P., Ju Y., Li L.Y., Peng R.D. Energy mechanism of deformation and failure of rock masses. Chinese Journal of Rock Mechanics and Engineering, 9:1729-1740, 2008. |
| − | <span id='_Ref153806887'></span><span id='_Ref153808699'></span>[13] Wen T., Tang H., Wang Y. Brittleness evaluation based on the energy evolution throughout the failure process of rocks. Journal of Petroleum Science and Engineering, 194 | + | <span id='_Ref153806887'></span><span id='_Ref153808699'></span>[13] Wen T., Tang H., Wang Y. Brittleness evaluation based on the energy evolution throughout the failure process of rocks. Journal of Petroleum Science and Engineering, 194, 107361, 2020. |
| − | [14] Liu X.S., Ning J.G., Tan Y.L., Gu Q.H. Damage constitutive model based on energy dissipation for intact rock subjected to cyclic loading. International Journal of Rock Mechanics and Mining Sciences, 85: 27-32. 2016. | + | [14] Liu X.S., Ning J.G., Tan Y.L., Gu Q.H. Damage constitutive model based on energy dissipation for intact rock subjected to cyclic loading. International Journal of Rock Mechanics and Mining Sciences, 85:27-32. 2016. |
| − | [15] Li T., Pei X., Guo J., et al. An energy-based fatigue damage model for sandstone subjected to cyclic loading. Rock Mechanics and Rock Engineering, 53: 5069-5079, 2020. | + | [15] Li T., Pei X., Guo J., et al. An energy-based fatigue damage model for sandstone subjected to cyclic loading. Rock Mechanics and Rock Engineering, 53:5069-5079, 2020. |
| − | <span id='_Ref153808706'></span><span id='_Ref158810508'></span>[16] Zhao Z.H., Ma W.P., Fu X.Y., Yuan J.H. Energy theory and application of rocks. Arabian Journal of Geosciences, 12 | + | <span id='_Ref153808706'></span><span id='_Ref158810508'></span>[16] Zhao Z.H., Ma W.P., Fu X.Y., Yuan J.H. Energy theory and application of rocks. Arabian Journal of Geosciences, 12, 474, 2019. |
| − | <span id='_Ref158810520'></span>[17] Huang D., Tan Q., Huang R.Q. Mechanism of strain energy conversion process for marble damage and fracture under high stress and rapid unloading. | + | <span id='_Ref158810520'></span>[17] Huang D., Tan Q., Huang R.Q. Mechanism of strain energy conversion process for marble damage and fracture under high stress and rapid unloading. Chinese Journal of Rock Mechanics and Engineering, 31(12):2483-2493, 2012. |
| − | [18] Dehkordi M.S., Shahriar K., Moarefvand P., Nik M.G. Application of the strain energy to estimate the rock load in squeezing ground condition of Eamzade Hashem tunnel in Iran. Arabian Journal of Geosciences, 6: 1241-1248, 2013. | + | [18] Dehkordi M.S., Shahriar K., Moarefvand P., Nik M.G. Application of the strain energy to estimate the rock load in squeezing ground condition of Eamzade Hashem tunnel in Iran. Arabian Journal of Geosciences, 6:1241-1248, 2013. |
| − | <span id='_Ref158810532'></span>[19] Luo S., Yan P., Lu W., Dong Z., Zhou C., Yang Z., Hu Y. Stability index of surrounding rock during deep rock excavation considering energy release speed. Applied Sciences, 13(5) | + | <span id='_Ref158810532'></span>[19] Luo S., Yan P., Lu W., Dong Z., Zhou C., Yang Z., Hu Y. Stability index of surrounding rock during deep rock excavation considering energy release speed. Applied Sciences, 13(5), 3000, 2023. |
| − | <span id='_Ref153808757'></span>[20] Sih G.C. Some basic problems in fracture mechanics and new concepts. Engineering Fracture Mechanics, 5(2) | + | <span id='_Ref153808757'></span>[20] Sih G.C. Some basic problems in fracture mechanics and new concepts. Engineering Fracture Mechanics, 5(2):365-377, 1973. |
| − | <span id='_Ref153808763'></span>[21] Gdoutos E.E. Strain energy density failure criterion: | + | <span id='_Ref153808763'></span>[21] Gdoutos E.E. Strain energy density failure criterion: Mixed-mode crack growth. Fracture Mechanics, 14:195-238. 1993. |
| − | <span id='_Ref153808924'></span>[22] Lachowicz C.T. Calculation of the elastic-plastic strain energy density under cyclic and random loading. International Journal of Fatigue, 23(7) | + | <span id='_Ref153808924'></span>[22] Lachowicz C.T. Calculation of the elastic-plastic strain energy density under cyclic and random loading. International Journal of Fatigue, 23(7):643-652, 2001. |
| − | <span id='_Ref153808977'></span><span id='_Ref153809017'></span>[23] Zacharopoulos D.A. Stability analysis of crack path using the strain energy density theory. Theoretical and Applied Fracture Mechanics, 41(1-3): 327-337, 2004. | + | <span id='_Ref153808977'></span><span id='_Ref153809017'></span>[23] Zacharopoulos D.A. Stability analysis of crack path using the strain energy density theory. Theoretical and Applied Fracture Mechanics, 41(1-3):327-337, 2004. |
| − | [24] Liu D.Q., Wang Z., Zhang X.Y. Characteristics of Strain Softening of Rocks and its Damage Constitutive Model. Rock and Soil Mechanics, 38(10): 2901-2908, 2017. | + | [24] Liu D.Q., Wang Z., Zhang X.Y. Characteristics of Strain Softening of Rocks and its Damage Constitutive Model. Rock and Soil Mechanics, 38(10):2901-2908, 2017. |
| − | <span id='_Ref153809024'></span>[25] Wang X.B., Hai L., Huang M. Inhomogeneity analysis of damage under uniaxial tension (I) - Basic theory. Chinese Journal of Rock Mechanics and Engineering, 23(9): 1446-1449, 2004. | + | <span id='_Ref153809024'></span>[25] Wang X.B., Hai L., Huang M. Inhomogeneity analysis of damage under uniaxial tension (I) - Basic theory. Chinese Journal of Rock Mechanics and Engineering, 23(9):1446-1449, 2004. |
| − | <span id='_Ref158487919'></span><span id='_Hlk158484002'></span>[26] Li Q.M. Strain energy density failure criterion. International Journal of Solids and Structures, 38(38-39): 6997-7013, 2001. | + | <span id='_Ref158487919'></span><span id='_Hlk158484002'></span>[26] Li Q.M. Strain energy density failure criterion. International Journal of Solids and Structures, 38(38-39):6997-7013, 2001. |
| − | <span id='_Ref153809068'></span>[27] Lemaitre J. A Continuous damage mechanics model for ductile fracture. Transactions of the Asme Journal of Engineering Materials and Technology 107(1): 83-89, 1985. | + | <span id='_Ref153809068'></span>[27] Lemaitre J. A Continuous damage mechanics model for ductile fracture. Transactions of the Asme Journal of Engineering Materials and Technology, 107(1):83-89, 1985. |
| − | <span id='_Ref153809203'></span>[28] Li L.P., Li S.C., Zhao Y. et al. 3D geomechanical model for progressive failure progress of weak broken surrounding rock in super large section tunnel. Chinese Journal of Rock Mechanics and Engineering, 31(3): 550-560, 2012. | + | <span id='_Ref153809203'></span>[28] Li L.P., Li S.C., Zhao Y. et al. 3D geomechanical model for progressive failure progress of weak broken surrounding rock in super large section tunnel. Chinese Journal of Rock Mechanics and Engineering, 31(3):550-560, 2012. |
Latest revision as of 15:13, 19 June 2024
Abstract
Exploring the rock failure mechanism from an energy perspective is crucial for ensuring the safe construction of tunnels under complex geological conditions. In this study, a progressive damage and failure model of rock elements is established using the strain-energy-density theory based on the thermodynamic theory. Specifically, the rock elements are considered to have failed when the strain energy density absorbed by the element is greater than the critical strain energy density. Besides, the damage evolution of rock elements is reflected through the reduction of elastic modulus, until the element only has a certain residual strength. Based on the above theory, the calculation program of rock damage and failure is developed in FLAC3D using the FISH language. The validity of the method for simulating the process of rock damage and failure is verified through the numerical simulation of Brazilian splitting tests. Finally, the model was applied to the overload test of the geo-mechanical model of the Liangshui Tunnel on Lanzhou-Chongqing Railway. The comparison between the numerical simulation and the test results has not only confirmed that the feasibility and accuracy of the model in simulating the progressive failure process of tunnel surrounding rock under high ground stress, but also its ability to visually display the damage degree, failure scope and evolution process of the surrounding rock. The research findings are of great significance in ensuring the safe construction of tunnel and will promote the efficient development of the underground engineering construction.
Keywords: Strain-energy-density theory, rock failure, tunnel surrounding rock, progressive damage and failure, numerical simulation
1. Introduction
In recent years, with the continuous development of tunnel engineering construction in China, the complexity of tunnels crossing the stratum has increased, and a large number of tunnel projects with remarkable characteristics, such as "ultra-deep burial, large cross-section, and long tunnel line" have emerged. The construction process is not only challenging, but also vulnerable to significant deformation, intrusion, collapse, and other geological disasters [1,2].
Essentially, the failure of the tunnel surrounding rock is a process of progressive failure [3-7], that is, the stress of the surrounding rock is redistributed under the effect of excavation unloading, the quality of the rock mass continues to deteriorate, and the surrounding rock develops from local failure to overall failure. The research on the progressive damage process and failure mechanism of the surrounding rock of a deep buried tunnel under high ground stress has important engineering significance for the prevention and treatment of tunnel collapse accidents.
According to the laws of thermodynamics, energy conversion is the essential feature of the physical process of matter. The deformation and failure of rock is essentially a damage evolution process with energy dissipation [8-10]. Therefore, studying the law of energy change during rock damage and the relationship between strength and overall failure from an energy perspective will better reflect the mechanical response characteristics of rock [11]. Around this idea, many scholars have conducted research. Xie et al. [12] conducted a thorough analysis of the energy dissipation and damage evolution process during the deformation and destruction of rocks, as well as the correlation between energy release and overall damage. Wen et al. [13] established the brittleness indexes based on the energy evolution and revealed the energy evolution laws of shales under different confinements. Liu et al. [14] and Li et al. [15] proposed a damage evolution equation for rocks under cyclic loading based on energy dissipation. Zhao et al. [16] summarized the relationship between energy accumulation and release during the deformation and damage processes of rocks, based on a substantial number of tests on mechanical properties of rocks, and they proposed a rock energy strength criterion. Huang et al. [17] revealed the mechanism of strain energy conversion process for damage and fracture of marble specimens based on the marble test of unloading confining pressure before peak strength under high stress and the energy theory. Dehkordi et al. [18] proposed a new empirical method to estimate the rock load in squeezing ground condition based on the residual strain energy after destruction and dissipation characteristics of stored strain energy before failure. Luo et al. [19] evaluated the stability of surrounding rock during Deep Rock Excavation based on the local energy release rate while considering the influence of the energy release speed.
The research of various scholars demonstrates that the deterioration of rock materials is primarily due to irreversible energy loss. Furthermore, the energy criterion holds important theoretical significance in evaluating rock damage. However, the current research predominantly analyses the correlation between energy dissipation, energy release and the overall failure of rock via theory or experiment. From the perspective of micromechanics, the research on the damage and failure law of rock micro-element based on energy dissipation and energy criterion is still insufficient. Some studies on rock failure have considered strain energy, but applications of the strain energy density theory (SED) as a criterion for the progressive failure analysis of surrounding rock are still relatively rare.
The strain-energy-density theory was first proposed by Sih [20] in 1973 while studying crack propagation. It takes the sum of volume deformation energy density and shape change energy density, namely strain energy density, as the criterion of material failure. This criterion comprehensively considers the action of six stress components near the crack tip and analyzes the strain energy density stored in a unit volume of material at each moment. Therefore, as a failure criterion, the strain-energy-density theory has the advantage that it can be well applied in complex geometry structures, mixed-mode loading conditions, and mixed crack development [21]. The strain energy density serves as a useful failure criterion and has successfully been applied in the solution of a host of engineering problems of major interest. These include: two- and three-dimensional crack problems; ductile fracture involving the prediction of crack initiation; slow stable crack growth and final separation, etc. [21]. In summary, the strain-energy-density theory serves as an effective failure criterion for forecasting nonlinear failure phenomena. For the tunnel surrounding rock under complex stress-strain state, the strain-energy-density criterion has obvious advantages compared with the conventional strength criterion.
Based on the above analysis, this paper starts from the perspective of energy and establishes the energy criterion of damage and failure of rock elements based on the strain-energy-density theory. When the strain energy density absorbed in a certain element exceeds the limit value, the element enters the damage state. At the same time, the damage variable is defined according to the value of strain energy density, and the damage degree of the rock is determined. The greater the strain energy density absorbed by a rock element, the more energy it dissipates, and the greater the degree of damage. When the strain energy density of a rock element is greater than the critical strain energy density, it is judged that the element is failed. The damage evolution of the rock element is reflected by the reduction of elastic modulus, until the element only has a certain residual strength, which avoids the singularity of the numerical calculations when the element fractures. Based on the above theory, the calculation program of rock damage and failure was developed in FLAC3D using the FISH language, and applied to the overload test of the geo-mechanical structure of Liangshui Tunnel on Lanzhou-Chongqing Railway. The program simulates the progressive damage and failure process of the surrounding rock of the deep-buried tunnel under the action of high ground stress. It analyzes the damage degree, failure range and evolution process of the surrounding rock. The relevant research results can provide guidance for the safe construction of deep buried tunnels.
2. Rock damage-failure model based on the strain-energy-density theory
The strain-energy-density theory is able to comprehensively consider the effects of loading history, geometric structure, material mechanical parameters, and other factors on the damage and failure of rocks. This theory proposes that the strain energy density is the primary factor leading to material failure. That is, regardless of the stress state of the material element, once its strain energy density exceeds a critical threshold, the element begins to fail [21,22].
2.1 Strain-energy-density equation considering strain-softening
Based on the strain-energy-density theory, it is assumed that rocks are composed of many tiny material elements and can store a finite amount of energy at a given instant of time. The energy per unit volume of material will be referred to as the strain energy density, . When the temperature and humidity are essentially constant, the strain energy density of the rock element can be expressed as [23]:
|
|
(1) |
Eq. (1) shows that the strain energy density stored in a rock element is determined by the deformation history of stress and strain increment .
Before the global failure of the rock structure under load, local damage and crack propagation have already occurred, which seriously affects the macroscopic failure process of the rock structure. In other words, rock failure is a process of progressive damage until final failure. The strain energy density is closely related to the damage and failure process of rocks.
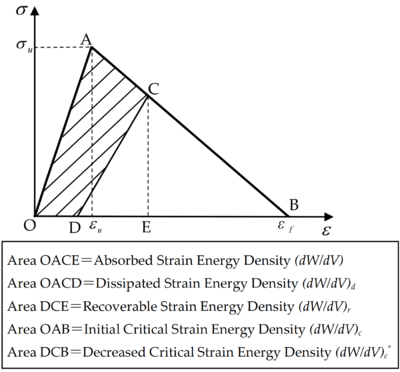
Numerous rock mechanics tests indicate that after reaching peak strength, the strength of the rock decreases with increased deformation, which is known as strain softening [24]. The stress-strain curve of strain softening for rock material is simplified, and the bilinear strain softening constitutive model of rocks from Reference [25] is adopted, as shown in Figure 1.
| Figure 1. Bilinear softening stress-strain curve |
As shown in Figure 1, the rock element firstly undergoes elastic deformation under the action of external force. When the stress increases to the limit point A, it enters into strain softening, and the stress decreases with the increase of strain until it is zero at point B. If the stress is in the elastic segment OA, the unloading path will return along the loading path without damage or plastic deformation. If the stress exceeds point A and unloading occurs at point C, the unloading path will return along the straight line CD under certain conditions. If it is loaded again, a new loading path DCB will be obtained, and the material produces damage and irrecoverable plastic deformation OD.
When the material element is at point C, the absorbed strain energy density, is the area OACE enclosed by the stress-strain curve, and the recoverable strain energy density after unloading, , is the area DCE. Thus the strain energy density absorbed by the material element consists of the following two parts:
|
|
(2) |
where is the dissipated strain energy density OACD, and is the recoverable strain energy density DCE.
When the material element is within the OA section and undamaged, the critical value of the strain energy density, , is equal to the area OAB. And when the material element is damaged (at point C), due to energy dissipation, the decreased value of the critical strain energy density, , is the strain energy density (area DCB) that can be recovered after unloading, which can be expressed as:
|
|
(3) |
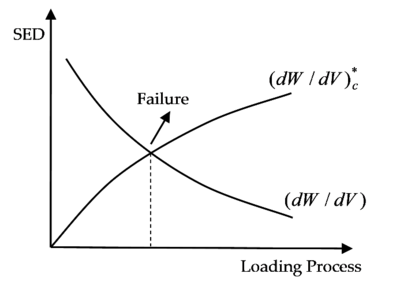
From the above analysis, it can be seen that the greater the damage of a material element under external forces, the greater the strain energy density absorbed, and the corresponding critical strain energy density, , is smaller. When the absorbed strain energy density reaches the critical strain energy density, , cracks begin to form, and the initial failure of the material element occurs [26], as shown in Figure 2. When the absorbed strain energy density reaches the element's initial critical strain energy density, , the element breaks completely and can no longer endure any load.
| Figure 2. Strain-energy-density theory and element failure |
The above bilinear constitutive behavior of rock elements can be easily obtained by uniaxial tests. However, rocks are generally under complex external forces, and the internal rock elements are simultaneously subjected to tension, pressure, and shear stress. The strain energy density obtained from the stress history of the rock element can comprehensively reflect the stress state of the element. Comparing its value with the strain energy density at different stages under uniaxial load can determine the damage and failure of the rock element under complex stress conditions.
2.2 Damage-failure criterion based on the strain-energy-density theory
In the process of rock material elements from initial damage to failure, and finally to complete fracture, the damage of the element is defined as the reduction of elastic modulus E, and the reduced strength of the element is expressed by the effective elastic modulus . To simplify the calculations, the change of the effective elastic modulus is discretized. Considering the calculation accuracy and efficiency, the reduction of the elastic modulus is discretized into 20 different values by trial calculations. Therefore, the value of the effective elastic modulus can be expressed as:
|
|
(4) |
where .
Defining the damage variable by the loss of stiffness is a widely used method [27], and is expressed as:
|
|
(5) |
where is the damage variable, is the elastic modulus of the non-damaged material, and is the elastic modulus after damage.
Generally, it can be seen from Eq. (5) that the value range of the damage variable is 0-1. Since the damage variable has a monotonically increasing relationship with the value of the elastic modulus reduction, () is used to represent the damage degree of the element in the following in order to represent the damage state of the element in a more concise and intuitive way.
In summary, the criterion of rock damage and failure based on the strain-energy-density theory is as follows:
(1) When , the element is in the elastic phase, no damage occurs and the effective elastic modulus ;
(2) When , the element starts to damage, the effective elastic modulus, , is calculated from Eq. (4), and the value of the damage degree n is determined by the strain energy density;
(3) When , it indicates that the element begins to fail;
(4) When , the damage degree of the material element reaches its maximum, causing it to break completely and lose its load-bearing capacity. To ensure the integrity of the entire calculation model and the continuity of the element, a small residual elastic modulus is assigned to the entirely fractured material element. According to Eq. (4), when the damage degree is the maximum, that is, , the effective elastic modulus , so when the element is completely failed, the residual elastic modulus is taken.
3. Numerical simulation of rock damage and failure
3.1 Program implementation
Based on the aforementioned theory, the FLAC3D finite-difference numerical software was utilized to develop a calculation program for rock damage and failure using the software’s built-in programming language, FISH. FLAC3D software uses explicit finite-difference method, which can solve many complex geotechnical engineering problems that cannot be simulated by finite element programs.
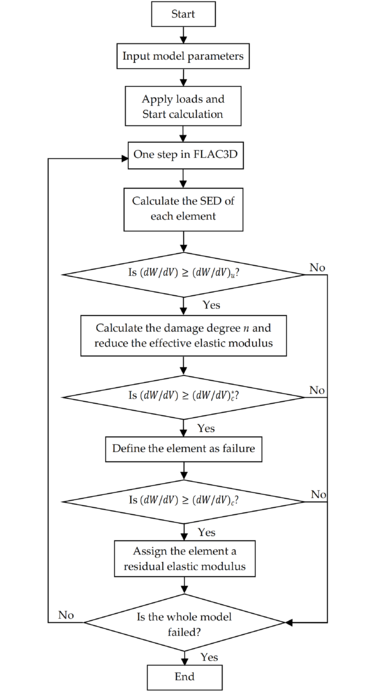
Due to the fact that the calculation process of FLAC3D consists of numerous time steps, the strain energy density of the element is dynamically obtained in terms of time steps. The damage of the element is judged by the damage failure criterion of the strain-energy-density theory, and the corresponding modulus reduction is performed at the same time. When the element completely fractures and loses its load-bearing capacity, the residual modulus of the element is assigned. If large-scale failure is found in the rock structure model, or the failure elements completely penetrate, the calculation is stopped.
Before the start of the calculation, the strain energy density of each element is zero. After the start of the calculation, the stress and strain of each element begin to change under the action of loading or excavation, causing an increase in energy. At the end of each step, the rock element's strain energy density is the sum of the strain energy density at the previous step and the increased strain energy density at the current step. The increased strain energy density at each step is approximated by the corresponding trapezoidal area in the stress-strain curve. Therefore, up to step (), the strain energy density of the element is calculated by:
|
|
(6) |
where , , , , , is the stress of the element at step , and , , , , , is the stress at the previous step. The strain is expressed in the same manner. If , then the strain energy density of the element is .
When the strain energy density of an element , the element begins to damage, and the degree of damage is calculated as follows:
|
|
(7) |
Where takes the integer part of the calculation result of Eq. (7), that is, the value range is . The effective elastic modulus of the damage element is obtained from Eq. (4) based on the value of .
In the linear elastic state, the expression for the strain energy density of the element is:
|
|
(8) |
Therefore, the dissipated strain energy density of the element can be obtained according to Eqs. (2) and (8):
|
|
(9) |
The decreased value of the critical strain energy density is:
|
|
(10) |
According to the criterion of rock damage and failure based on the strain-energy-density theory, when , the element fails, and the failed element is defined as a new group "fail". In the FLAC3D program, additional parameters are defined to save the values of the strain energy density and damage degree of each element, and it is specified that z_extra1 represents the absorbed strain energy density of the element, z_extra2 is the damage degree of the element, and z_extra3 is the critical strain energy density of the element.
The calculation process of rock damage and failure based on the strain-energy-density theory is shown in Figure 3.
| Figure 3. Calculation flow of numerical simulation |
3.2 Numerical simulation of Brazilian splitting
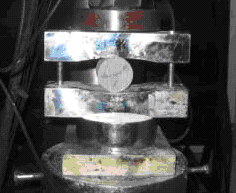
This calculation example simulates the indoor Brazilian splitting test. As shown in Figure 4, the specimen is carbonaceous phyllite, which is grayish black, dense, and has no cracks. The disc diameter mm, and thickness mm. The loading speed is 0.002mm/s until the specimen is destroyed.
|
| Figure 4. Brazilian splitting test |
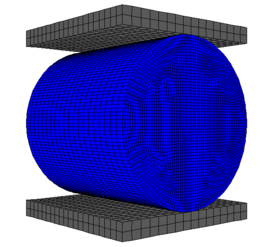
The calculation model size is the same as the test size, as shown in Figure 5, which is divided into 60880 elements. The Brazilian disc is loaded at both ends with steel plates without load-bearing strip.
| Figure 5. Numerical model |
The Mohr-Coulomb constitutive model in FLAC3D software is used for numerical calculation. The physical and mechanical characteristics of the model are as follow: the modulus of elasticity GPa, the Poisson's ratio , the cohesion MPa, the friction angle , the density , the ultimate stress MPa, the ultimate strain , and the strain in case of fracture .
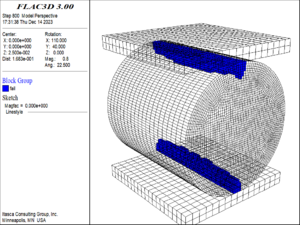
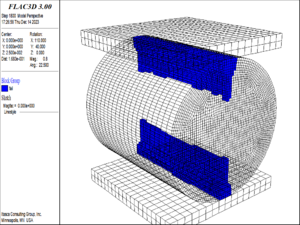
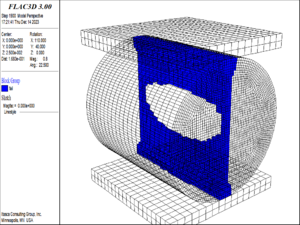
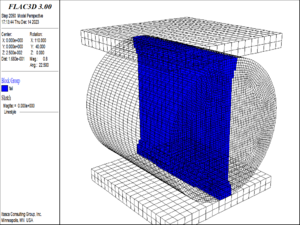
The failure process of Brazilian splitting numerical simulation is shown in Figure 6. Under the influence of the load, the two ends of the disc began to fail due to stress concentration, then the failure range continued to extend inside the specimen. Ultimately, hole-through fracture occurred along the axis of the disc.
| ||||||||
| Figure 6. Failure process of Brazilian splitting tes |
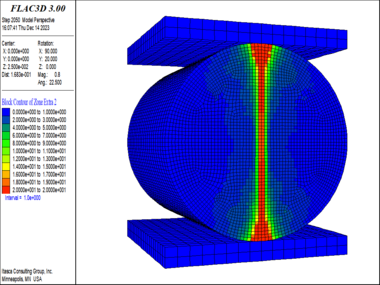
When the specimen fractured, the damage of each element in the model is shown in Figure 7. The damage value of the rock elements in the middle axis of the disc reached the maximum value of 20, indicating that the crack in the middle of the disc was completely penetrated, and the rock elements around the failure position also produced different degrees of damage. The failure area at both ends of the disk was triangular.
| Figure 7. Element damage distribution in the model |
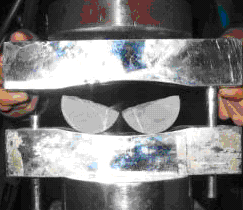
The results of the Brazilian splitting test are as follows: during the loading process of the rock, the failure initially occurred at the loading position at both ends of the disc, and with the continuous increase of the load, the through failure finally occurred along the middle of the disc, as shown in Figure 8. Owing to the loading method without load-bearing strip, local triangular-shaped failure zones developed at the loading positions at both ends of the disc. The numerical simulation of the disc failure process and the final failure state are in good agreement with the test results, indicating that the proposed model is feasible and correct for the simulation of rock damage and failure.
|
| Figure 8. Test results of Brazilian splitting |
4. Numerical simulation of damage and failure of tunnel surrounding rock
In this paper, the three-dimensional geo-mechanical model test of weak and broken surrounding rock of the tunnel in article [28] is taken as an example to simulate the overload failure test of the full-face excavation without support section. Based on the strain-energy-density theory, the numerical simulation of progressive damage and failure of tunnel surrounding rock is carried out.
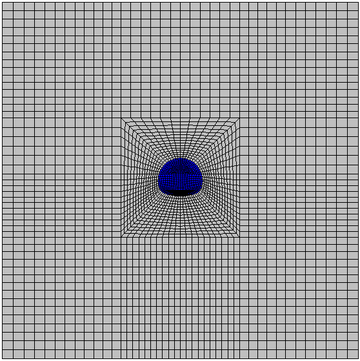
The geo-mechanical model test takes the Liangshui Tunnel on Lanzhou-Chongqing Railway as the engineering background. The model size is width height = 2.4m 2.4m, the geometric and stress similarity ratio is 1:50, and the actual size of the tunnel is taken to establish the numerical model. Set the horizontal direction of the tunnel cross section as -axis, the vertical direction as -axis, and the excavation direction as -axis. The calculation range of the model is and . The numerical model is shown in Figure 9, which is divided into 3246 elements with 6668 nodes. Vertical constraints are applied to the base of the model along the -axis; horizontal constraints are applied to both sides of the model along the -axis; constraints are imposed on the front and back of the model along the -axis. The upper part of the model is the surface, serving as a free surface and unconstrained. The gravity stress distribution is considered in the vertical direction of the model, and the horizontal tectonic stress distribution is considered in the horizontal direction. Additionally, in order to simulate the 200 m burial depth of the tunnel, vertical ground stresses at a depth of 147.5 m and corresponding horizontal ground stress loads were applied to the model.
| Figure 9. Numerical simulation model |
The parameters of the numerical calculation are taken according to the physical and mechanical parameters of the tunnel surrounding rock. The calculation parameters are as follows: the density , the modulus of elasticity Pa, the Poisson's ratio , the cohesion MPa, the angle of internal friction , the ultimate stress of element MPa, the strain at ultimate stress , and the strain in case of fracture .
The geo-mechanical model was subjected to an overload test after the full-face unsupported excavation, and the buried depth of the tunnel was increased step by step with a gradient of 50 m buried depth until the unsupported surrounding rock appeared obvious damage. In order to compare with the experimental phenomena, the full-face excavation was first carried out in the numerical model, then the vertical load of 50 m buried depth was added sequentially on the top of the model, and the gradient load of corresponding horizontal ground stress was added on both sides of the model.
Based on the strain-energy-density theory, the numerical simulation results of the progressive damage and failure of the tunnel surrounding rock during the loading process are as follows:
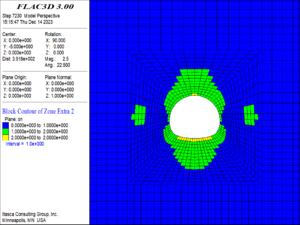
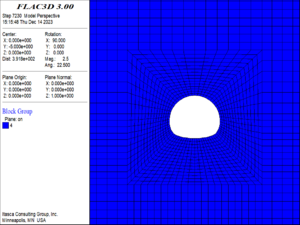
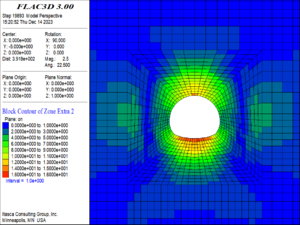
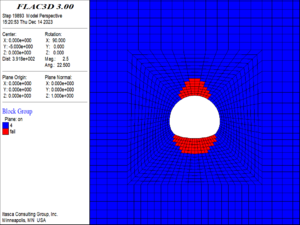
(1) When the buried depth increased to 250 m, the damage and failure of the surrounding rock are shown in Figure 10. At this time, the surrounding rock of the tunnel has not been failure, but the surrounding rock of the vault and the arch bottom within the range of about one times the diameter of the tunnel began to damage, and at the same time, a small number of the elements at the position of one time the diameter of the tunnel on the left and right sides of the arch waist are also damaged. The damage degree of the surrounding rock is small overall. The maximum damage degree of the element is 2, and the maximum damage position is at the vault and arch bottom.
| ||||
| Figure 10. Damage and failure contour of the surrounding rock (250m buried depth) |
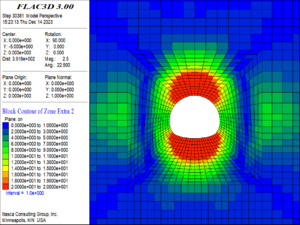
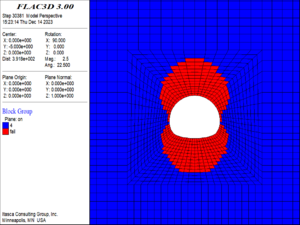
(2) When the buried depth increased to 300 m, as shown in Figure 11, the local elements of the tunnel vault and arch bottom began to fail, and the maximum damage value of the elements reached 16. The damage range of the surrounding rock of the vault and the arch bottom extended to twice the diameter of the tunnel. At this time, the side wall of the tunnel has not yet failed, but the elements within about 0.8 times the tunnel diameter outside the side wall have been damaged.
| ||||
| Figure 11. Damage and failure contour of the surrounding rock (300m buried depth) |
(3) When the buried depth increased to 600 m, as shown in Figure 12, the damage range of the tunnel surrounding rock continued to expand, extending from the damage area of the tunnel vault and arch bottom to the location of the sidewalls, in which the damage range of the vault increased significantly. From the sidewalls to the arch foot and arch tip, damage increased gradually. The damage of the elements at the top and bottom of the tunnel reached a maximum value of 20, which indicating that the elements were completely fractured and had lost their load-bearing capacity.
| ||||
| Figure 12. Damage and failure contour of the surrounding rock (600m buried depth) |
(4) When the buried depth increased to 900 m, as shown in Figure 13, the failure occurred over a large area around the tunnel, and this included contiguous areas of failure at the top of the arch, the sidewalls, and the bottom of the arch, which tended to collapse as a whole. The damage reached a maximum value of 20 in most of the elements around the tunnel.
| ||||
| Figure 13. Damage and failure contour of the surrounding rock (900m buried depth) |
The results of the overloading test of the geo-mechanical model are as follows [28]: when the burial depth was increased to 300 m, the surrounding rock of the tunnel began to appear localized failure, while the side wall had not yet exhibited obvious failure; when the burial depth was increased to 600 m, the tunnel vault and the side wall both appeared large-scale failure; when the loading reached a burial depth equivalent to 900 m, the surrounding rock appeared to have a large area of significant failure, and the overall signs of collapse also appeared. In the process of overloading, the failure area of surrounding rock gradually expanded, and the failure area was mainly concentrated in the area above the vault. There were also local failure areas on both sides of the side wall, and the failure was gradually aggravated from the side wall to the arch foot and the arch tip. The on-site failure of the model overload test is shown in Figure 14.
| Figure 14. Image of overload failure in overload test |
In the process of tunnel overload, the variation curve of vault settlement with buried depth in numerical calculation and overload test is shown in Figure 15.
| Figure 15. Settlement curves of tunnel vault with burial depth |
Comparison between the numerical simulation results and the overload test results reveals that the progressive failure law of tunnel surrounding rock with the increase of buried depth by numerical simulation is largely consistent with the test, and the specific failure process also aligns well. The vault settlement calculated by numerical calculation is basically consistent with the test results, and the change trend is consistent. This indicates that the model is accurate and feasible for simulating the progressive damage and failure process of tunnel surrounding rock.
5. Conclusions
(1) From an energy perspective, the bilinear constitutive model is used to establish the damage and failure criterion of rock element based on the strain-energy-density theory. This method can effectively simulate the progressive damage and failure process of rock.
(2) According to the above model and criteria, the calculation program of rock damage and failure is developed by using FLAC3D software. The correctness and feasibility of the method are verified by the numerical simulation of Brazilian splitting test.
(3) The calculation program is applied to the overload test simulation of the geo-mechanical model of Liangshui tunnel, and the simulation results are in good agreement with the test results. The numerical simulation results show that the failure area of tunnel surrounding rock is gradually expanding with the increase of buried depth; The tunnel vault and arch bottom are failed first, and then extend to the side wall. The failure gradually intensifies from the side wall to the arch foot and the arch tip. Attention should be paid to the deformation and failure of these areas during on-site construction.
(4) Compared with theoretical and analytical methods, numerical simulation can more intuitively show the damage degree, failure range and evolution process of surrounding rock, and can directly solve various tunnel excavation and surrounding rock failure problems, so it has a wide range of engineering application prospects.
Acknowledgement
This research was supported by National Natural Science Foundation of China (grant number: 52379114).
References
[1] Chen X.S., Xu Z.H., Bao X.H., Wang X.T., Fu Y.B. Challenges and technological breakthroughs in tunnel construction in China. China Journal of Highway and Transport, 33(12):1-14, 2020.
[2] Editorial Department of China Journal of Highway and Transport. Review on China’s traffic tunnel engineering (2022). China Journal of Highway and Transport, 35(4):1-40, 2022.
[3] Mandal S.K., Singh M.M. Evaluating extent and causes of overbreak in tunnels. Tunnelling and Underground Space Technology, 24(1):22-36, 2009.
[4] Zhou X.P., Qian Q.H., Zhang B.H. Zonal disintegration mechanism of deep crack-weakened rock masses under dynamic unloading. Acta Mechanica Solida Sinica, 22(3):240-250, 2009.
[5] Golshani A., Oda M., Okui Y., Takemura T., Munkhtogoo E. Numerical simulation of the excavation damaged zone around an opening in brittle rock. International Journal of Rock Mechanics & Mining Sciences, 44(6):835-845, 2007.
[6] Zhu H.H., Huang F., Xu Q.W. Model test and numerical simulation for progressive failure of weak and fractured tunnel surrounding rock under different overburden depths. Chinese Journal of Rock Mechanics and Engineering, 29(6):1113-1122, 2010.
[7] Guo C.X., Fan L.F., Han K., Han K.H., Li P.F., Zhang M.J. Progressive failure analysis of shallow circular tunnel based on the functional catastrophe theory considering strain softening of surrounding rock mass. Tunnelling and Underground Space Technology, 131, 104799, 2023.
[8] Xie H.P., Peng R.D., Ju Y. Energy dissipation of rock deformation and fracture. Chinese Journal of Rock Mechanics and Engineering, 23(21):3565-3570, 2004.
[9] Sujatha V., Kishen J.M.C., ASCE A.M. Energy release rate due to friction at bimaterial interface in dams. Journal of Engineering Mechanics, 129(7):793-800, 2003.
[10] He M.M., Huang B.Q., Zhu C.H., Chen Y.S., Li N. Energy dissipation-based method for fatigue life prediction of rock salt. Rock Mechanics and Rock Engineering, 51(5):1447-1455, 2018.
[11] Xie H.P., Ju Y., Li L.Y. Criteria for strength and structural failure of rocks based on energy dissipation and energy release principles. Chinese Journal of Rock Mechanics and Engineering, 24(17):3003-3010, 2005.
[12] Xie H.P., Ju Y., Li L.Y., Peng R.D. Energy mechanism of deformation and failure of rock masses. Chinese Journal of Rock Mechanics and Engineering, 9:1729-1740, 2008.
[13] Wen T., Tang H., Wang Y. Brittleness evaluation based on the energy evolution throughout the failure process of rocks. Journal of Petroleum Science and Engineering, 194, 107361, 2020.
[14] Liu X.S., Ning J.G., Tan Y.L., Gu Q.H. Damage constitutive model based on energy dissipation for intact rock subjected to cyclic loading. International Journal of Rock Mechanics and Mining Sciences, 85:27-32. 2016.
[15] Li T., Pei X., Guo J., et al. An energy-based fatigue damage model for sandstone subjected to cyclic loading. Rock Mechanics and Rock Engineering, 53:5069-5079, 2020.
[16] Zhao Z.H., Ma W.P., Fu X.Y., Yuan J.H. Energy theory and application of rocks. Arabian Journal of Geosciences, 12, 474, 2019.
[17] Huang D., Tan Q., Huang R.Q. Mechanism of strain energy conversion process for marble damage and fracture under high stress and rapid unloading. Chinese Journal of Rock Mechanics and Engineering, 31(12):2483-2493, 2012.
[18] Dehkordi M.S., Shahriar K., Moarefvand P., Nik M.G. Application of the strain energy to estimate the rock load in squeezing ground condition of Eamzade Hashem tunnel in Iran. Arabian Journal of Geosciences, 6:1241-1248, 2013.
[19] Luo S., Yan P., Lu W., Dong Z., Zhou C., Yang Z., Hu Y. Stability index of surrounding rock during deep rock excavation considering energy release speed. Applied Sciences, 13(5), 3000, 2023.
[20] Sih G.C. Some basic problems in fracture mechanics and new concepts. Engineering Fracture Mechanics, 5(2):365-377, 1973.
[21] Gdoutos E.E. Strain energy density failure criterion: Mixed-mode crack growth. Fracture Mechanics, 14:195-238. 1993.
[22] Lachowicz C.T. Calculation of the elastic-plastic strain energy density under cyclic and random loading. International Journal of Fatigue, 23(7):643-652, 2001.
[23] Zacharopoulos D.A. Stability analysis of crack path using the strain energy density theory. Theoretical and Applied Fracture Mechanics, 41(1-3):327-337, 2004.
[24] Liu D.Q., Wang Z., Zhang X.Y. Characteristics of Strain Softening of Rocks and its Damage Constitutive Model. Rock and Soil Mechanics, 38(10):2901-2908, 2017.
[25] Wang X.B., Hai L., Huang M. Inhomogeneity analysis of damage under uniaxial tension (I) - Basic theory. Chinese Journal of Rock Mechanics and Engineering, 23(9):1446-1449, 2004.
[26] Li Q.M. Strain energy density failure criterion. International Journal of Solids and Structures, 38(38-39):6997-7013, 2001.
[27] Lemaitre J. A Continuous damage mechanics model for ductile fracture. Transactions of the Asme Journal of Engineering Materials and Technology, 107(1):83-89, 1985.
[28] Li L.P., Li S.C., Zhao Y. et al. 3D geomechanical model for progressive failure progress of weak broken surrounding rock in super large section tunnel. Chinese Journal of Rock Mechanics and Engineering, 31(3):550-560, 2012.Document information
Published on 19/06/24
Accepted on 10/06/24
Submitted on 25/03/24
Volume 40, Issue 2, 2024
DOI: 10.23967/j.rimni.2024.06.001
Licence: CC BY-NC-SA license
Share this document
Keywords
claim authorship
Are you one of the authors of this document?
