| (26 intermediate revisions by the same user not shown) | |||
| Line 28: | Line 28: | ||
The most direct and effective approach to enhance energy absorption characteristics is to improve the structure and dimensions of thin-walled metallic straight tubes. It is recognized that the plastic deformation during energy absorption in straight tubes typically happens in the edge area [2]. Consequently, polygonal cross-section and polygonal edge cross-section thin-walled tubes were developed to increase the plastic deformation in the cross-section of thin-walled tubes [3-7]. However, when a conical tube structure has more than 11 sides, the potential improvement of energy absorption by increasing the number of angular edges is restricted [8]. To address this limitation, there are two possible solutions: a concave cross-section, for example, a star [9] and cross-section tubes [10-12]; or the insertion of a web inside the tube [2]. To avoid the limitation of the number of corner edges added to the web, a variety of cross-sectional shapes of thin-walled tubes with multicellular structures have been developed, including triangular [13], square [14-20], hexagonal [21], octagonal [22], conical [23] and circular [2,24,25]. The shapes of these multicellular tube structures significantly enhance energy absorption [17,26-28]. Increasing the number of edge arrangements in a cross-section leads to a higher stiffness in tubes, resulting in a significant rise in the initial peak load. As a result, reducing the initial peak load while ensuring the energy absorption capacity of buffer structures is essential during the design process. | The most direct and effective approach to enhance energy absorption characteristics is to improve the structure and dimensions of thin-walled metallic straight tubes. It is recognized that the plastic deformation during energy absorption in straight tubes typically happens in the edge area [2]. Consequently, polygonal cross-section and polygonal edge cross-section thin-walled tubes were developed to increase the plastic deformation in the cross-section of thin-walled tubes [3-7]. However, when a conical tube structure has more than 11 sides, the potential improvement of energy absorption by increasing the number of angular edges is restricted [8]. To address this limitation, there are two possible solutions: a concave cross-section, for example, a star [9] and cross-section tubes [10-12]; or the insertion of a web inside the tube [2]. To avoid the limitation of the number of corner edges added to the web, a variety of cross-sectional shapes of thin-walled tubes with multicellular structures have been developed, including triangular [13], square [14-20], hexagonal [21], octagonal [22], conical [23] and circular [2,24,25]. The shapes of these multicellular tube structures significantly enhance energy absorption [17,26-28]. Increasing the number of edge arrangements in a cross-section leads to a higher stiffness in tubes, resulting in a significant rise in the initial peak load. As a result, reducing the initial peak load while ensuring the energy absorption capacity of buffer structures is essential during the design process. | ||
| − | The most prevalent technique for decreasing the initial peak load is to introduce triggers, stress concentrators, or defects into the buffer structure. Grooving [29-33], corrugation [34,35], and gouging [36,37] are among the approaches that can effectively reduce the initial peak load. The grooved triggering method has a broad range of applications. Hosseinipour | + | The most prevalent technique for decreasing the initial peak load is to introduce triggers, stress concentrators, or defects into the buffer structure. Grooving [29-33], corrugation [34,35], and gouging [36,37] are among the approaches that can effectively reduce the initial peak load. The grooved triggering method has a broad range of applications. Hosseinipour et al. proposed the use of annularly grooved thin-walled circular tubes with inner and outer walls to enhance energy absorption. The energy absorption mechanism was systematically investigated [29-33]. Under quasi-static axial loading, a theoretical model for the initial peak and average loads of the first flexural cycle of a thin-walled cylinder was developed [29,30]. This study discovered that the use of alternating internal and external grooves can result in smoother load-displacement curves [30,31], thus affecting the deformation pattern of thin-walled tubes [32,33]. To achieve a practical range of groove length-to-thickness ratios, Darvizeh et al. employed orthogonal experiments to examine the impact of geometrical parameters on thin-walled tube deformation through orthogonal experimental methods. They put forward a mathematical model for energy absorption, taking into account strain hardening. Subsequent analysis confirmed that externally grooved thin-walled tubes pre-positioned in advance exhibit stronger energy absorption properties [38]. Montazeri et al. conducted a study comparing the energy absorption characteristics of a dug-hole tube and a grooved tube. Their numerical simulations and experiments revealed that the internally and externally interleaved grooved thin-walled circular tube exhibited lower initial peak loads when compared to the dug-hole tube. This finding has been substantiated by previous works [39]. Using Alexander's static crushing model and Cowper-Symonds' intrinsic model, Zheng et al. created a load prediction model for round tubes subjected to impact loads, taking strain rate effects into account. The model also includes simple expressions for predicting initial peak crushing force for medium-sized thin-walled welded tubes [40]. Wei et al. investigated the average load modelling of round tubes with gradient depth notches by SLM printing of thin-walled round tubes with closed circumferential rectangular slots and gradient thickness defects. The results indicated that changes in groove depth gradient could improve the crush deformation stability [41,42]. Niknejad et al. provided initial peak load expressions for hollow foam tubes and polyurethane foam tubes during the initial fold formation under quasi-static axial loading [43]. Furthermore, Abedi et al. conducted a study on the energy absorption properties of tubes grooved internally and externally and filled with polyurethane foam. Their findings indicated that the energy absorption indexes of the structures with filled foam were enhanced. Additionally, the researchers derived semi-empirical expressions for the initial peak load under quasi-static axial loading [44]. To summarise, staggering the internal and external grooves in thin-walled circular tubes can effectively manage compression and collapse deformation, leading to improved energy absorption. Additionally, the theoretical model for average load during quasi-static axial load can achieve more precise predictions. Nevertheless, predicting initial peak loads is challenging, particularly under dynamic impact conditions, and determining the derivation of the theoretical model becomes more difficult. Currently, there are no reports addressing the prediction model for the initial peak load of grooved thin-walled tubes under axial impact loading. |
The study's main objective is to develop an initial peak load prediction model for thin-walled circular tubes with internal and external grooves made of A6061, which are subjected to low-velocity impact. We initially construct nine sample sets incorporating predetermined grooved structural parameters (including groove depth, width and number) applied to thin-walled circular tubes. The energy absorption properties of specimens subjected to impact loading are evaluated via finite element simulation. The initial peak load model incorporates the dimensional parameter of the groove and accounts for strain rate. Bringing validity to the mathematical model of the initial peak load under impact loads, the drop weight testing machine and high-speed camera are used to analyse the crushing deformation of the specimens. The initial model for initial peak load is acquired by enlarging numerous models. The adequacy of the initial peak load mathematical model is confirmed. The multi-group extended module also verifies the applicability of the expression. | The study's main objective is to develop an initial peak load prediction model for thin-walled circular tubes with internal and external grooves made of A6061, which are subjected to low-velocity impact. We initially construct nine sample sets incorporating predetermined grooved structural parameters (including groove depth, width and number) applied to thin-walled circular tubes. The energy absorption properties of specimens subjected to impact loading are evaluated via finite element simulation. The initial peak load model incorporates the dimensional parameter of the groove and accounts for strain rate. Bringing validity to the mathematical model of the initial peak load under impact loads, the drop weight testing machine and high-speed camera are used to analyse the crushing deformation of the specimens. The initial model for initial peak load is acquired by enlarging numerous models. The adequacy of the initial peak load mathematical model is confirmed. The multi-group extended module also verifies the applicability of the expression. | ||
| Line 111: | Line 111: | ||
Based on Eq. (1), it becomes clear that the four variables are not entirely independent of each other. Accordingly, the investigations were evaluated for the number of grooves <math display="inline">N</math>, width <math display="inline">b</math>, and depth <math display="inline">h</math> individually. A summary of the research schedule is presented in [[#tab-2|Table 2]] and the specimens A1-A10 are as shown in [[#img-5|Figure 5]]: | Based on Eq. (1), it becomes clear that the four variables are not entirely independent of each other. Accordingly, the investigations were evaluated for the number of grooves <math display="inline">N</math>, width <math display="inline">b</math>, and depth <math display="inline">h</math> individually. A summary of the research schedule is presented in [[#tab-2|Table 2]] and the specimens A1-A10 are as shown in [[#img-5|Figure 5]]: | ||
| − | (I) To study the effect of the number of grooves <math display="inline">N</math>: make the width of the grooves <math display="inline">b=2</math>mm, the depth of the grooves <math display="inline">h=1</math>mm, choose the number of grooves <math display="inline">N=5, 6, 7, 8</math>. Equation (1) reveals the corresponding groove spacing to be 14. | + | (I) To study the effect of the number of grooves <math display="inline">N</math>: make the width of the grooves <math display="inline">b=2</math>mm, the depth of the grooves <math display="inline">h=1</math>mm, choose the number of grooves <math display="inline">N=5, 6, 7, 8</math>. Equation (1) reveals the corresponding groove spacing to be 14.67mm, 12.29mm, 10.5mm, and 9.11mm, while the experimental program in [[#tab-2|Table 2]] is A1, A2, A3, and A4. |
(II) In order to study the effect of groove width <math display="inline">b</math>, the number of grooves is set to <math display="inline">N=6</math>, and groove depth <math display="inline">h=1</math>mm. Width <math display="inline">b</math> is then chosen at 1.5mm, 2mm, 2.5mm, and 5mm. Using Eq. (1), the corresponding groove spacing is found to be 12.79mm, 12.29mm, 11.79mm, and 9.29mm, and the corresponding experimental program is noted in [[#tab-2|Table 2]] as A5, A2, A6, and A7. | (II) In order to study the effect of groove width <math display="inline">b</math>, the number of grooves is set to <math display="inline">N=6</math>, and groove depth <math display="inline">h=1</math>mm. Width <math display="inline">b</math> is then chosen at 1.5mm, 2mm, 2.5mm, and 5mm. Using Eq. (1), the corresponding groove spacing is found to be 12.79mm, 12.29mm, 11.79mm, and 9.29mm, and the corresponding experimental program is noted in [[#tab-2|Table 2]] as A5, A2, A6, and A7. | ||
| Line 122: | Line 122: | ||
{| class="wikitable" style="margin: 1em auto 0.1em auto;border-collapse: collapse;font-size:85%;width:auto;" | {| class="wikitable" style="margin: 1em auto 0.1em auto;border-collapse: collapse;font-size:85%;width:auto;" | ||
|-style="text-align:center" | |-style="text-align:center" | ||
| − | ! Variables Number !! <math display="inline">N</math> !! <math display="inline">a</math> | + | ! Variables Number !! <math display="inline">N</math> !! <math display="inline">a</math> (mm) !! <math display="inline">b</math> (mm) !! <math display="inline">h</math> (mm) |
|- | |- | ||
| style="text-align: center;vertical-align: top;"|A1 | | style="text-align: center;vertical-align: top;"|A1 | ||
| Line 226: | Line 226: | ||
===4.1 Effect of the groove size parameters=== | ===4.1 Effect of the groove size parameters=== | ||
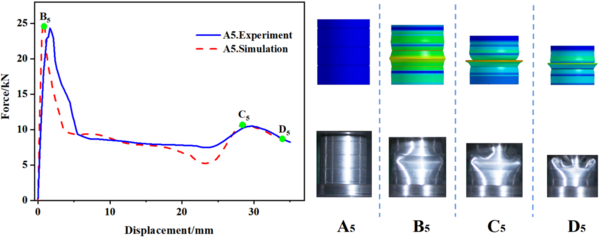
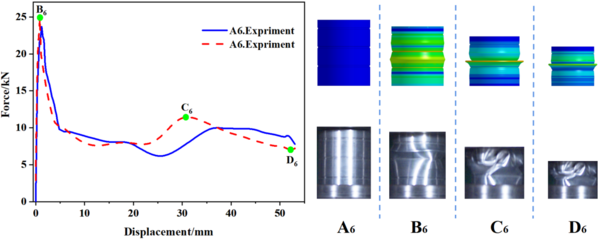
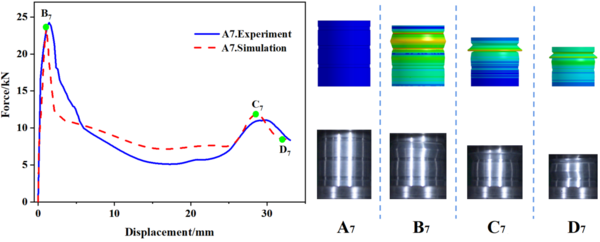
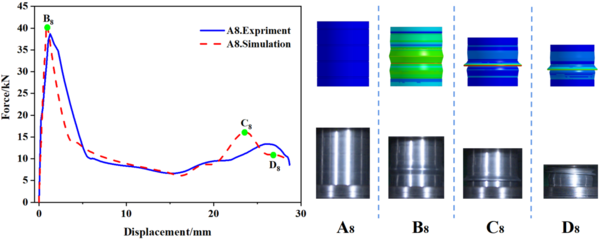
| − | [[#tab-3| | + | [[#tab-3|Tables 3]] to [[#tab-5|5]] provide a summary of both simulated and experimental results of the initial peak load of the specimens with different number of grooves, width and depth. The data shows that the maximal error value between the experimental and simulation results is only -5.13%, which confirms the reliability of the research results. Incorporating Eq. (1), [[#tab-3|Table 3]] reveals that for a constant notch width <math display="inline"> b</math>, the spacing <math display="inline"> a</math> between notches gradually decreases as the number of grooves <math display="inline"> N</math> increases, and the initial peak load also gradually decreases. Meanwhile, [[#tab-4|Table 4]] indicates that when the number of grooves <math display="inline"> N</math> is fixed, the spacing between grooves decreases with an increase in groove width <math display="inline"> b</math>, resulting in a progressive decrease in the initial peak load. From the data presented in [[#tab-5|Table 5]], it is apparent that the maximum load decreases as the depth of the groove <math display="inline"> h</math> increases. It is worth noting that the number and width of the grooves have a minimal impact on the initial peak load, whereas the depth of the grooves has the most significant effect. |
<div class="center" style="font-size: 85%;">'''Table 3'''. Effect of groove number <math display="inline"> N</math> on the initial peak load</div> | <div class="center" style="font-size: 85%;">'''Table 3'''. Effect of groove number <math display="inline"> N</math> on the initial peak load</div> | ||
| Line 235: | Line 235: | ||
! rowspan='2' style="text-align: center;vertical-align:bottom;"| Number !! rowspan='2' style="text-align: center;"|Groove number (<math display="inline"> N</math>) !! colspan='2' style="text-align: center;"|Initial peak load (kN) !! rowspan='2' style="text-align: center;"|Error (%) | ! rowspan='2' style="text-align: center;vertical-align:bottom;"| Number !! rowspan='2' style="text-align: center;"|Groove number (<math display="inline"> N</math>) !! colspan='2' style="text-align: center;"|Initial peak load (kN) !! rowspan='2' style="text-align: center;"|Error (%) | ||
|- | |- | ||
| − | + | ! style="text-align: center;"|Experiment | |
| − | + | ! style="text-align: center;"|Simulation | |
|- | |- | ||
| style="text-align: center;"|A1 | | style="text-align: center;"|A1 | ||
| Line 271: | Line 271: | ||
! rowspan='2' style="text-align: center;vertical-align:bottom;"| Number !! rowspan='2' style="text-align: center;"|Width <math display="inline"> b</math> (mm) !! colspan='2' style="text-align: center;"|Initial peak load (kN) !! rowspan='2' style="text-align: center;"|Error (%) | ! rowspan='2' style="text-align: center;vertical-align:bottom;"| Number !! rowspan='2' style="text-align: center;"|Width <math display="inline"> b</math> (mm) !! colspan='2' style="text-align: center;"|Initial peak load (kN) !! rowspan='2' style="text-align: center;"|Error (%) | ||
|- | |- | ||
| − | + | ! style="text-align: center;"|Experiment | |
| − | + | ! style="text-align: center;"|Simulation | |
|- | |- | ||
| style="text-align: center;"|A5 | | style="text-align: center;"|A5 | ||
| Line 307: | Line 307: | ||
! rowspan='2' style="text-align: center;vertical-align:bottom;"| Number !! rowspan='2' style="text-align: center;"|Depth <math display="inline"> h</math> (mm) !! colspan='2' style="text-align: center;"|Initial peak load (kN) !! rowspan='2' style="text-align: center;"|Error (%) | ! rowspan='2' style="text-align: center;vertical-align:bottom;"| Number !! rowspan='2' style="text-align: center;"|Depth <math display="inline"> h</math> (mm) !! colspan='2' style="text-align: center;"|Initial peak load (kN) !! rowspan='2' style="text-align: center;"|Error (%) | ||
|- | |- | ||
| − | + | ! style="text-align: center;"|Experiment | |
| − | + | ! style="text-align: center;"|Simulation | |
|- | |- | ||
| style="text-align: center;"|A8 | | style="text-align: center;"|A8 | ||
| Line 337: | Line 337: | ||
===4.2 Experimental verification=== | ===4.2 Experimental verification=== | ||
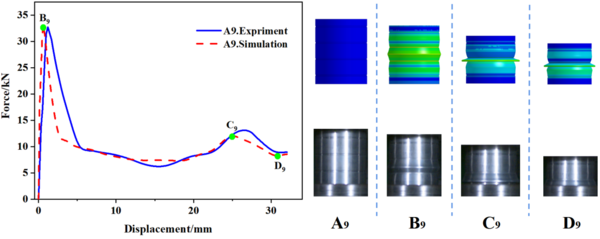
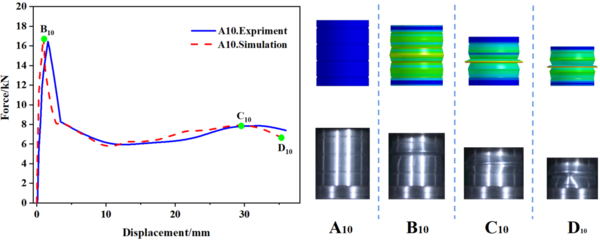
| − | In this study, 10 specimens (A1-A10) with the same structural dimensions as those calculated by simulation were selected for testing, and the test results were then compared with the simulation results, as shown in [[#img-8|Figure 8]]. Overall, the trend of the load-displacement characteristics of each specimen test corresponded well with the simulation predictions. Additionally, [[#tab-3| | + | In this study, 10 specimens (A1-A10) with the same structural dimensions as those calculated by simulation were selected for testing, and the test results were then compared with the simulation results, as shown in [[#img-8|Figure 8]]. Overall, the trend of the load-displacement characteristics of each specimen test corresponded well with the simulation predictions. Additionally, [[#tab-3|Tables 3]] to [[#tab-5|5]] present the comparable experimental and simulated values of the initial peak load for each specimen. Furthermore, there are variations in folding positions apart from the first position, which is essentially in line with the simulation results. Moreover, the deformation patterns of a few specimens, such as A1, A2, A5, and A6, significantly vary from the simulation calculations, possibly owing to the accuracy of specimen machining and the stability of the impact testing apparatus. However, based on the load-displacement curve, it is apparent that the test findings and simulation outcomes correspond substantially. |
<div id='img-8'></div> | <div id='img-8'></div> | ||
| Line 404: | Line 404: | ||
{| style="text-align: center; margin:auto;width: 100%;" | {| style="text-align: center; margin:auto;width: 100%;" | ||
|- | |- | ||
| − | | style="text-align: center;" | <math> F_{\max}^c={\sigma}'_sA=\sigma_s A[1+\biggl(\frac{\dot{\varepsilon}}{c}\biggr)^ \frac{1}{p}] </math> | + | | style="text-align: center;" | <math> F_{\max}^c={\sigma}'_sA=\sigma_s A \left[1+\biggl(\frac{\dot{\varepsilon}}{c}\biggr)^ \frac{1}{p}\right] </math> |
|} | |} | ||
| style="width: 5px;text-align: right;white-space: nowrap;" |(2) | | style="width: 5px;text-align: right;white-space: nowrap;" |(2) | ||
| Line 422: | Line 422: | ||
| style="width: 5px;text-align: right;white-space: nowrap;" |(3) | | style="width: 5px;text-align: right;white-space: nowrap;" |(3) | ||
|} | |} | ||
| − | |||
===5.2 Expression derivation and verification=== | ===5.2 Expression derivation and verification=== | ||
| Line 428: | Line 427: | ||
Thin-walled circular tubes with internal and external staggered grooves exhibit a more stable deformation pattern and require lower compression loads for collapse when compared to the tubes without grooves. The efficiency of engineering design can be improved if the initial peak load can be predicted. | Thin-walled circular tubes with internal and external staggered grooves exhibit a more stable deformation pattern and require lower compression loads for collapse when compared to the tubes without grooves. The efficiency of engineering design can be improved if the initial peak load can be predicted. | ||
| − | The correlation between | + | The correlation between <math>\left[1/N,\, \lg\left(a/H\right),\, \lg\left(F_{\max}^g\right)\right]</math> is plotted from [[#tab-3|Table 3]], as shown in [[#img-9|Figure 9]]. From [[#tab-4|Table 4]], it can be seen that the maximum load <math>F_{\max}^g</math> of the thin-walled circular tube with internal and external staggered grooves decreases linearly with the groove width <math display="inline"> b </math>. The maximum load <math>F_{\max}^g</math> of the thin-walled circular tube with internal and external staggered grooves decreases linearly with the groove depth <math display="inline"> h </math>. |
| − | + | ||
<math display="inline"> H </math> is the half wavelength (half of the fold length) of the thin-walled straight tube, which can be expressed as: | <math display="inline"> H </math> is the half wavelength (half of the fold length) of the thin-walled straight tube, which can be expressed as: | ||
| Line 447: | Line 445: | ||
{| style="text-align: center; margin:auto;width: 100%;" | {| style="text-align: center; margin:auto;width: 100%;" | ||
|- | |- | ||
| − | | style="text-align: center;" | <math>\begin{cases} z=lg(F_{\max}^g) \\ x=\frac{1}{N} \\ y=lg(\frac{a}{H}) \end{cases}</math> | + | | style="text-align: center;" | <math>\begin{cases} z=\lg(F_{\max}^g) \\ x=\displaystyle\frac{1}{N} \\ y=\lg \left(\displaystyle\frac{a}{H}\right) \end{cases}</math> |
|} | |} | ||
| style="width: 5px;text-align: right;white-space: nowrap;" |(5) | | style="width: 5px;text-align: right;white-space: nowrap;" |(5) | ||
| Line 457: | Line 455: | ||
{| style="text-align: center; margin:auto;width: 100%;" | {| style="text-align: center; margin:auto;width: 100%;" | ||
|- | |- | ||
| − | | style="text-align: center;" | <math> \begin{cases} z=xy \\ x=\frac{1}{N} \\ y=lg(\frac{a}{H}) \end{cases} </math> | + | | style="text-align: center;" | <math> \begin{cases} z=xy \\ x=\displaystyle\frac{1}{N} \\ y=\lg \left(\displaystyle\frac{a}{H}\right) \end{cases} </math> |
|} | |} | ||
| style="width: 5px;text-align: right;white-space: nowrap;" |(6) | | style="width: 5px;text-align: right;white-space: nowrap;" |(6) | ||
| Line 470: | Line 468: | ||
{| style="text-align: center; margin:auto;width: 100%;" | {| style="text-align: center; margin:auto;width: 100%;" | ||
|- | |- | ||
| − | | style="text-align: center;" | <math> lg(F_{max}^g)=\frac{1}{N}lg(\frac{a}{H})+k </math> | + | | style="text-align: center;" | <math> \lg(F_{\max}^g)=\frac{1}{N}\lg \left(\frac{a}{H}\right)+k </math> |
|} | |} | ||
| style="width: 5px;text-align: right;white-space: nowrap;" |(7) | | style="width: 5px;text-align: right;white-space: nowrap;" |(7) | ||
| Line 519: | Line 517: | ||
{| style="text-align: center; margin:auto;width: 100%;" | {| style="text-align: center; margin:auto;width: 100%;" | ||
|- | |- | ||
| − | | style="text-align: center;" | <math>\begin{cases} f_{c}^g(N,a,b)=(\frac{a}{H})^ \frac{1}{N}\\ g_{c}^g(h)=\frac{t-h}{t} \\ a=\frac{L}{N+1} -b\\ H=\sqrt{\ | + | | style="text-align: center;" | <math>\begin{cases} f_{c}^g(N,a,b)=\left(\displaystyle\frac{a}{H}\right)^\frac{1}{N}\\ g_{c}^g(h)=\displaystyle\frac{t-h}{t} \\ a=\displaystyle\frac{L}{N+1} -b\\ H=\sqrt{\pi Dt/2\sqrt{3}}\end{cases}</math> |
|} | |} | ||
| style="width: 5px;text-align: right;white-space: nowrap;" |(10) | | style="width: 5px;text-align: right;white-space: nowrap;" |(10) | ||
| Line 532: | Line 530: | ||
{| style="text-align: center; margin:auto;width: 100%;" | {| style="text-align: center; margin:auto;width: 100%;" | ||
|- | |- | ||
| − | | style="text-align: center;" | <math> F_{\max}^g=\ | + | | style="text-align: center;" | <math> F_{\max}^g=\left(\frac{\frac{L}{N+1} -b}{\sqrt{\pi Dt/2\sqrt{3}}}\right)^ \frac{1}{N}\left(\frac{t-h}{t}\right)\sigma_sA \left[1+\left(\frac{v_x}{L_c}\right)^ \frac{1}{p}\right] </math> |
|} | |} | ||
| style="width: 5px;text-align: right;white-space: nowrap;" |(11) | | style="width: 5px;text-align: right;white-space: nowrap;" |(11) | ||
| Line 538: | Line 536: | ||
| − | The initial peak load of the different grooved thin-walled circular tubes under impact are calculated by | + | The initial peak load of the different grooved thin-walled circular tubes under impact are calculated by Eq. (11), and the results are shown in [[#tab-6|Table 6]]. The theoretical calculation results are basically consistent with the experimental and numerical values, and the maximum error is only -7.64%. This demonstrates the accuracy and reliability of the initial peak load expression after the introduction of geometric parameters <math>K_c^g</math>. |
<div class="center" style="font-size: 85%;">'''Table 6'''. Comparison of the initial peak load between simulation, experiment and theory</div> | <div class="center" style="font-size: 85%;">'''Table 6'''. Comparison of the initial peak load between simulation, experiment and theory</div> | ||
| Line 686: | Line 684: | ||
! rowspan='2' style="text-align: center;vertical-align:bottom;"| Number !! rowspan='2' style="text-align: center;"|<math display="inline"> N</math> !! colspan='2' style="text-align: center;"|Initial peak load (kN) !! rowspan='2' style="text-align: center;"|Error (%) | ! rowspan='2' style="text-align: center;vertical-align:bottom;"| Number !! rowspan='2' style="text-align: center;"|<math display="inline"> N</math> !! colspan='2' style="text-align: center;"|Initial peak load (kN) !! rowspan='2' style="text-align: center;"|Error (%) | ||
|- | |- | ||
| − | + | ! style="text-align: center;"|Theory | |
| − | + | ! style="text-align: center;"|Simulation | |
|- | |- | ||
| style="text-align: center;"|A11 | | style="text-align: center;"|A11 | ||
| Line 741: | Line 739: | ||
[[#tab-8|Table 8]] shows that the predicted results are in good agreement with the experimental results found in the literature. This again confirms the applicability of Eq. (11). | [[#tab-8|Table 8]] shows that the predicted results are in good agreement with the experimental results found in the literature. This again confirms the applicability of Eq. (11). | ||
| − | However, Table 8 reveals that the excessive number of grooves in test A14 produces a significant discrepancy between the simulation results and the predicted results. When a thin-walled circular tube with staggered internal and external grooves is subjected to axial compression, as the number of grooves <math display="inline"> N</math> increases, the thin-walled circular tube is rapidly destabilized and the initial peak load decreases sharply. At this point, the Eq. (11) is no longer applicable. | + | However, [[#tab-8|Table 8]] reveals that the excessive number of grooves in test A14 produces a significant discrepancy between the simulation results and the predicted results. When a thin-walled circular tube with staggered internal and external grooves is subjected to axial compression, as the number of grooves <math display="inline"> N</math> increases, the thin-walled circular tube is rapidly destabilized and the initial peak load decreases sharply. At this point, the Eq. (11) is no longer applicable. |
In this scenario, one can adjust the parameters of Eq. (11) as per the available experimental data to attain anticipated outcomes, thereby aiding in the selection of thin-walled circular tubes, predicting the initial peak load and advancing the project progress. | In this scenario, one can adjust the parameters of Eq. (11) as per the available experimental data to attain anticipated outcomes, thereby aiding in the selection of thin-walled circular tubes, predicting the initial peak load and advancing the project progress. | ||
| − | =6 Conclusions= | + | ==6. Conclusions== |
In this research, the axial buckling modes and crashworthiness of circular tube with external linear gradient grooves are investigated theoretically, experimentally and numerically. The following conclusions may be drawn: | In this research, the axial buckling modes and crashworthiness of circular tube with external linear gradient grooves are investigated theoretically, experimentally and numerically. The following conclusions may be drawn: | ||
| Line 753: | Line 751: | ||
(2) Through the comparison of experimental data and finite element simulation analyses of the internal and external grooved thin-walled circular tubes, it is found that the load-displacement curves are in good agreement, and the wrinkles produced on the thin-walled circular tubes are approximately similar at the same moment. Furthermore, the deformation from the beginning to the end of compression can correspond to each other. The maximal error value of the initial peak load is only -5.13%, and the experimental result is basically the same as that of the simulation result. | (2) Through the comparison of experimental data and finite element simulation analyses of the internal and external grooved thin-walled circular tubes, it is found that the load-displacement curves are in good agreement, and the wrinkles produced on the thin-walled circular tubes are approximately similar at the same moment. Furthermore, the deformation from the beginning to the end of compression can correspond to each other. The maximal error value of the initial peak load is only -5.13%, and the experimental result is basically the same as that of the simulation result. | ||
| − | (3) The impact of groove dimensions (including the number of grooves | + | (3) The impact of groove dimensions (including the number of grooves <math display="inline">N</math>, the width of grooves <math display="inline">b</math>, and the depth of grooves <math display="inline">h</math>) on the initial peak load is analyzed via both experimental and simulation data. The two-dimensional relationship graph clearly indicates that the initial peak load reduces as groove width <math display="inline">b</math>, groove depth <math display="inline">h</math>, and the number of grooves <math display="inline">N</math> increase. Finally, the geometric parameter <math>K_c^g</math> is introduced to derive a initial peak load prediction expression for thin-walled circular tubes with internal/external staggered grooves. By comparing the predicted results of this expression with previous experimental data, it was observed that the initial peak load of the grooved thin-walled tubes is mostly consistent with the predicted results within a certain dimensional interval. This confirms the reliability of the initial peak load prediction expression. |
==References== | ==References== | ||
| + | <div class="auto" style="text-align: left;width: auto; margin-left: auto; margin-right: auto;font-size: 85%;"> | ||
| − | [1] Du | + | [1] Du X. Impact dynamics and crashworthiness design of cylindrical shell. Science Press, 2004. |
| − | [2] Tang Z, Liu S, Zhang Z. Analysis of energy absorption characteristics of cylindrical multi-cell columns | + | [2] Tang Z., Liu S., Zhang Z. Analysis of energy absorption characteristics of cylindrical multi-cell columns. Thin-Walled Structures, 62:75-84, 2013. |
| − | [3] Mamalis A G, Manolakos D E, Ioannidis M B, et al. Finite element simulation of the axial collapse of metallic thin-walled tubes with octagonal cross-section | + | [3] Mamalis A.G., Manolakos D.E., Ioannidis M.B., et al. Finite element simulation of the axial collapse of metallic thin-walled tubes with octagonal cross-section. Thin-Walled Structures, 41(10):891-900, 2003. |
| − | [4] Rossi A, Fawaz Z, Behdinan K. Numerical simulation of the axial collapse of thin-walled polygonal section tubes | + | [4] Rossi A., Fawaz Z., Behdinan K. Numerical simulation of the axial collapse of thin-walled polygonal section tubes. Thin-Walled Structures, 43(10):1646-1661, 2005. |
| − | [5] Liu Y C, Day M L. Simplified modelling of thin-walled box section beam | + | [5] Liu Y.C., Day M.L. Simplified modelling of thin-walled box section beam. International Journal of Crashworthiness, 11(3):263-272, 2006. |
| − | [6] Zhang X, Huh H. Crushing analysis of polygonal columns and angle elements | + | [6] Zhang X., Huh H. Crushing analysis of polygonal columns and angle elements. International Journal of Impact Engineering, 37(4):441-451, 2010. |
| − | [7] Liu W, Lin Z, Wang N, et al. Dynamic performances of thin-walled tubes with star-shaped cross section under axial impact | + | [7] Liu W., Lin Z., Wang N., et al. Dynamic performances of thin-walled tubes with star-shaped cross section under axial impact. Thin-Walled Structures, 100:25-37, 2016. |
| − | [8] Yamashita M, Gotoh M, Sawairi Y. Axial crush of hollow cylindrical structures with various polygonal cross-sections: Numerical simulation and experiment | + | [8] Yamashita M., Gotoh M., Sawairi Y. Axial crush of hollow cylindrical structures with various polygonal cross-sections: Numerical simulation and experiment. Journal of Materials Processing Technology, 140(1–3):59-64, 2003. |
| − | [9] | + | [9] Fan Z., Lu G., Liu K. Quasi-static axial compression of thin-walled tubes with different cross-sectional shapes. Engineering Structures, 55(4):80-89, 2013. |
| − | [10] Tang Z, Liu S, Zhang Z. Energy absorption properties of non-convex multi-corner thin-walled columns | + | [10] Tang Z., Liu S., Zhang Z. Energy absorption properties of non-convex multi-corner thin-walled columns. Thin-Walled Structures, 51:112-120, 2012. |
| − | [11] Reddy S, Abbasi M, Fard M. Multi-cornered thin-walled sheet metal members for enhanced crashworthiness and occupant protection | + | [11] Reddy S., Abbasi M., Fard M. Multi-cornered thin-walled sheet metal members for enhanced crashworthiness and occupant protection. Thin-Walled Structures, 94:56-66, 2015. |
| − | [12] Abbasi M, Reddy S, Ghafari-Nazari A, et al. Multiobjective crashworthiness optimization of multi-cornered thin-walled sheet metal members | + | [12] Abbasi M., Reddy S., Ghafari-Nazari A., et al. Multiobjective crashworthiness optimization of multi-cornered thin-walled sheet metal members. Thin-Walled Structures, 89:31-41, 2015. |
| − | [13] Tran T N, Hou S, Han X, et al. Theoretical prediction and crashworthiness optimization of multi-cell triangular tubes | + | [13] Tran T.N., Hou S., Han X., et al. Theoretical prediction and crashworthiness optimization of multi-cell triangular tubes. Thin-Walled Structures, 82:183–195, 2014. |
| − | [14] | + | [14] Chen W., Wierzbicki T. Relative merits of single-cell, multi-cell and foam-filled thin-walled structures in energy absorption. Thin-Walled Structures, 39(4):287-306, 2001. |
| − | [15] Zhang X, Cheng G, Zhang H. Theoretical prediction and numerical simulation of multi-cell square thin-walled structures | + | [15] Zhang X., Cheng G., Zhang H. Theoretical prediction and numerical simulation of multi-cell square thin-walled structures. Thin-Walled Structures, 44(11):1185-1191, 2006. |
| − | [16] Najafi A, Rais-Rohani M. Mechanics of axial plastic collapse in multi-cell, multi-corner crush tubes | + | [16] Najafi A., Rais-Rohani M. Mechanics of axial plastic collapse in multi-cell, multi-corner crush tubes. Thin-Walled Structures, 49(1):1-12, 2011. |
| − | [17] Zhang X, Zhang H. Energy absorption of multi-cell stub columns under axial compression | + | [17] Zhang X., Zhang H. Energy absorption of multi-cell stub columns under axial compression. Thin-Walled Structures, 68:156-163, 2013. |
| − | [18] Nia A A, Parsapour M. An investigation on the energy absorption characteristics of multi-cell square tubes | + | [18] Nia A.A., Parsapour M. An investigation on the energy absorption characteristics of multi-cell square tubes. Thin-Walled Structures, 68:26-34, 2013. |
| − | [19] Fang J, Gao Y, Sun G, et al. On design of multi-cell tubes under axial and oblique impact loads | + | [19] Fang J., Gao Y., Sun G., et al. On design of multi-cell tubes under axial and oblique impact loads. Thin-Walled Structures, 95:115-126, 2015. |
| − | [20] Tran T N, Hou S, Han X, et al. Theoretical prediction and crashworthiness optimization of multi-cell square tubes under oblique impact loading | + | [20] Tran T.N., Hou S., Han X., et al. Theoretical prediction and crashworthiness optimization of multi-cell square tubes under oblique impact loading. International Journal of Mechanical Sciences, 89:177-193 , 2014. |
| − | [21] Qiu N, Gao Y, Fang J, et al. Crashworthiness analysis and design of multi-cell hexagonal columns under multiple loading cases | + | [21] Qiu N., Gao Y., Fang J., et al. Crashworthiness analysis and design of multi-cell hexagonal columns under multiple loading cases. Finite Elements in Analysis & Design, 104:89-101, 2015. |
| − | [22] Nia A A, Parsapour M. Comparative analysis of energy absorption capacity of simple and multi-cell thin-walled tubes with triangular, square, hexagonal and octagonal sections | + | [22] Nia A.A., Parsapour M. Comparative analysis of energy absorption capacity of simple and multi-cell thin-walled tubes with triangular, square, hexagonal and octagonal sections. Thin-Walled Structures, 74:155-165, 2014. |
| − | [23] Mahmoodi A, Shojaeefard M H, Googarchin H S, et al. Theoretical development and numerical investigation on energy absorption behavior of tapered multi-cell tubes | + | [23] Mahmoodi A., Shojaeefard M.H., Googarchin H.S., et al. Theoretical development and numerical investigation on energy absorption behavior of tapered multi-cell tubes. Thin-Walled Structures, 102(102):98-110, 2016. |
| − | [24] Zhang X, Zhang H. Axial crushing of circular multi-cell columns | + | [24] Zhang X., Zhang H. Axial crushing of circular multi-cell columns. International Journal of Impact Engineering, 65:110-125, 2014. |
| − | [25] Tabacu S. Axial crushing of circular structures with rectangular multi-cell insert | + | [25] Tabacu S. Axial crushing of circular structures with rectangular multi-cell insert. Thin-Walled Structures, 95:297-309, 2015. |
| − | [26] Kim H S. New extruded multi-cell aluminum profile for maximum crash energy absorption and weight efficiency | + | [26] Kim H.S. New extruded multi-cell aluminum profile for maximum crash energy absorption and weight efficiency. Thin-Walled Structures, 40(4):311-327, 2002. |
| − | [27] Zhang X, Cheng G. A comparative study of energy absorption characteristics of foam-filled and multi-cell square columns | + | [27] Zhang X., Cheng G. A comparative study of energy absorption characteristics of foam-filled and multi-cell square columns. International Journal of Impact Engineering, 34(11):1739-1752, 2007. |
| − | [28] Zhang X, Wen Z, Zhang H. Axial crushing and optimal design of square tubes with graded thickness | + | [28] Zhang X., Wen Z., Zhang H. Axial crushing and optimal design of square tubes with graded thickness. Thin-Walled Structures, 84:263-274, 2014. |
| − | [29] Daneshi G H, Hosseinipour S J. Grooves effect on crashworthiness characteristics of thin-walled tubes under axial compression | + | [29] Daneshi G.H., Hosseinipour S.J. Grooves effect on crashworthiness characteristics of thin-walled tubes under axial compression. Materials & Design, 23(7):611-617, 2002. |
| − | [30] G.H | + | [30] Daneshi G.H., Hosseinipour S.J. Elastic–plastic theory for initial buckling load of thin-walled grooved tubes under axial compression. Journal of materials processing technology, 125-126(36):826-832, 2003. |
| − | [31] Hosseinipour S J , Daneshi G H . Energy absorbtion and mean crushing load of thin-walled grooved tubes under axial compression | + | [31] Hosseinipour S.J., Daneshi G.H. Energy absorbtion and mean crushing load of thin-walled grooved tubes under axial compression. Thin-Walled Structures, 41(1):31-46, 2003. |
| − | [32] Hosseinipour S J, Daneshi G H. Experimental studies on thin-walled grooved tubes under axial compression | + | [32] Hosseinipour S.J., Daneshi G.H. Experimental studies on thin-walled grooved tubes under axial compression. Experimental Mechanics, 44(1):101-108, 2004. |
| − | [33] Mirmohammadsadeghi S E, Khalili K, Ahmadi S Y, Hosseinipour S. J. Experimental and finite element simulation investigation of axial crushing of grooved thin-walled tubes | + | [33] Mirmohammadsadeghi S.E., Khalili K., Ahmadi S.Y., Hosseinipour S.J. Experimental and finite element simulation investigation of axial crushing of grooved thin-walled tubes. International Journal of Advanced Manufacturing Technology, 77(9-12):1627-1643, 2015. |
| − | [34] Liu Z, Hao W, Xie J, et al. Axial-impact buckling modes and energy absorption properties of thin-walled corrugated tubes with sinusoidal patterns | + | [34] Liu Z., Hao W., Xie J., et al. Axial-impact buckling modes and energy absorption properties of thin-walled corrugated tubes with sinusoidal patterns. Thin-Walled Structures, 94(94):410-423, 2015. |
| − | [35] Alkhatib S E, Tarlochan F, Eyvazian A. Collapse behavior of thin-walled corrugated tapered tubes | + | [35] Alkhatib S.E., Tarlochan F., Eyvazian A. Collapse behavior of thin-walled corrugated tapered tubes. Engineering Structures, 150:674-692, 2017. |
| − | [36] | + | [36] Moradpour A., Elyasi M., Montazeri S., et al. Developing a new thin-walled tube structure and analyzing its crushing performance for AA 60601 and mild steel under axial loading. Transactions of The Indian Institute of Metals, 69(5):1107-1117, 2016. |
| − | [37] | + | [37] Yuen S.C.K., Nurick G.N. The energy-absorbing characteristics of tubular structures with geometric and material modifications: An overview. Applied Mechanics Reviews, 61(2):020802, 2008. |
| − | [38] Darvizeh A, Darvizeh M, Ansari R, et al. Analytical and experimental investigations into the controlled energy absorption characteristics of thick-walled tubes with circumferential grooves | + | [38] Darvizeh A., Darvizeh M., Ansari R., et al. Analytical and experimental investigations into the controlled energy absorption characteristics of thick-walled tubes with circumferential grooves. Journal of Mechanical Science and Technology, 28(10):4199-4212, 2014. |
| − | [39] Montazeri S , Elyasi M, Moradpour A. Investigating the energy absorption, SEA and crushing performance of holed and grooved thin-walled tubes under axial loading with different materials | + | [39] Montazeri S., Elyasi M., Moradpour A. Investigating the energy absorption, SEA and crushing performance of holed and grooved thin-walled tubes under axial loading with different materials. Thin-Walled Structures, 131:646-653, 2018. |
| − | [40] Zheng Y Q, Zhu X C, Dong X Q, et al. Theoretical and | + | [40] Zheng Y.Q., Zhu X.C., Dong X.Q., et al. Theoretical and experimental studies on the axial impact behavior of Q235B longitudinally welded tubes. Journal of Vibration and Shock, 35(20):98-103, 2016. |
| − | [41] Niknejad A, Abedi M M, Liaghat G, et al. Foam- | + | [41] Niknejad A., Abedi M.M., Liaghat G., et al. Foam-filled grooved tubes with circular cross-section under axial compression: a theoretical analysis. Iranian Journal of Science and Technology-Transactions of Mechanical Engineering, 40(3):155-167, 2016. |
| − | [42] Wei Y, Yang Z, Yan H, et al. Proactive regulation of axial crushing behavior of thin-walled circular tube by gradient grooves | + | [42] Wei Y., Yang Z., Yan H., et al. Proactive regulation of axial crushing behavior of thin-walled circular tube by gradient grooves. International Journal of Mechanical Sciences, 108:49-60, 2016. |
| − | [43] Yang Z, Yu Y, Wei Y, et al. Crushing behavior of a thin-walled circular tube with internal gradient grooves fabricated by SLM 3D printing | + | [43] Yang Z., Yu Y., Wei Y., et al. Crushing behavior of a thin-walled circular tube with internal gradient grooves fabricated by SLM 3D printing. Thin-Walled Structures, 111:1-8, 2017. |
| − | [44] Abedi M M, Niknejad A, Liaghat G H, et al. Foam-filled grooved tubes with circular cross section under axial compression: an experimental study | + | [44] Abedi M.M., Niknejad A., Liaghat G.H., et al. Foam-filled grooved tubes with circular cross section under axial compression: an experimental study. Iranian Journal of Science and Technology, Transactions of Mechanical Engineering, 42:401-413, 2018. |
Latest revision as of 11:57, 24 May 2024
Abstract
Thin-walled cylindrical tube structures with particular defects exhibit more stable energy absorption characteristics and lower initial peak loads when subjected to axial impact. The present study systematically investigates the effect of the depth, width, and number of grooves in both internal and external groove structures on the energy absorption characteristics of thin-walled cylindrical tubes made of A6061 under axial impact loading. An expression for predicting the initial peak load is formulated, and its validity is confirmed through experimentation and extrapolation. The results indicate that augmenting the depth, width and quantity of grooves can lower the initial peak load, and the depth of grooves bears the most pronounced impact. The initial load hypothesis is congruent with both experiments and simulations, with a initial peak error of just -7.64%. To affirm the generality of the theoretical computations, eight distinct groups of elongated structural simulations were compared, and the initial peak load's error was scarcely above 10%. This study serves as a point of reference for designing energy-absorbing structures with internal and external grooves when subjected to low-velocity axial impact.
Keywords: Thin-walled circular tube, internal and external groove, expression for initial peak load, drop-weight test, finite element analysis
1. Introduction
Vehicle driving safety, transportation of weapons, spacecraft landing softness, and protection of complex equipment all necessitate structural crashworthiness. In unexpected or expected collisions, the modes of damage such as buckling and fracturing of a specific structure are utilized to absorb impact loads and dissipate impact energy during the collision [1]. Circular straight metal tubes are among the most effective structures for absorbing energy and are widely used in energy-absorbing systems because of their stable compression mode and structural adaptability.
The most direct and effective approach to enhance energy absorption characteristics is to improve the structure and dimensions of thin-walled metallic straight tubes. It is recognized that the plastic deformation during energy absorption in straight tubes typically happens in the edge area [2]. Consequently, polygonal cross-section and polygonal edge cross-section thin-walled tubes were developed to increase the plastic deformation in the cross-section of thin-walled tubes [3-7]. However, when a conical tube structure has more than 11 sides, the potential improvement of energy absorption by increasing the number of angular edges is restricted [8]. To address this limitation, there are two possible solutions: a concave cross-section, for example, a star [9] and cross-section tubes [10-12]; or the insertion of a web inside the tube [2]. To avoid the limitation of the number of corner edges added to the web, a variety of cross-sectional shapes of thin-walled tubes with multicellular structures have been developed, including triangular [13], square [14-20], hexagonal [21], octagonal [22], conical [23] and circular [2,24,25]. The shapes of these multicellular tube structures significantly enhance energy absorption [17,26-28]. Increasing the number of edge arrangements in a cross-section leads to a higher stiffness in tubes, resulting in a significant rise in the initial peak load. As a result, reducing the initial peak load while ensuring the energy absorption capacity of buffer structures is essential during the design process.
The most prevalent technique for decreasing the initial peak load is to introduce triggers, stress concentrators, or defects into the buffer structure. Grooving [29-33], corrugation [34,35], and gouging [36,37] are among the approaches that can effectively reduce the initial peak load. The grooved triggering method has a broad range of applications. Hosseinipour et al. proposed the use of annularly grooved thin-walled circular tubes with inner and outer walls to enhance energy absorption. The energy absorption mechanism was systematically investigated [29-33]. Under quasi-static axial loading, a theoretical model for the initial peak and average loads of the first flexural cycle of a thin-walled cylinder was developed [29,30]. This study discovered that the use of alternating internal and external grooves can result in smoother load-displacement curves [30,31], thus affecting the deformation pattern of thin-walled tubes [32,33]. To achieve a practical range of groove length-to-thickness ratios, Darvizeh et al. employed orthogonal experiments to examine the impact of geometrical parameters on thin-walled tube deformation through orthogonal experimental methods. They put forward a mathematical model for energy absorption, taking into account strain hardening. Subsequent analysis confirmed that externally grooved thin-walled tubes pre-positioned in advance exhibit stronger energy absorption properties [38]. Montazeri et al. conducted a study comparing the energy absorption characteristics of a dug-hole tube and a grooved tube. Their numerical simulations and experiments revealed that the internally and externally interleaved grooved thin-walled circular tube exhibited lower initial peak loads when compared to the dug-hole tube. This finding has been substantiated by previous works [39]. Using Alexander's static crushing model and Cowper-Symonds' intrinsic model, Zheng et al. created a load prediction model for round tubes subjected to impact loads, taking strain rate effects into account. The model also includes simple expressions for predicting initial peak crushing force for medium-sized thin-walled welded tubes [40]. Wei et al. investigated the average load modelling of round tubes with gradient depth notches by SLM printing of thin-walled round tubes with closed circumferential rectangular slots and gradient thickness defects. The results indicated that changes in groove depth gradient could improve the crush deformation stability [41,42]. Niknejad et al. provided initial peak load expressions for hollow foam tubes and polyurethane foam tubes during the initial fold formation under quasi-static axial loading [43]. Furthermore, Abedi et al. conducted a study on the energy absorption properties of tubes grooved internally and externally and filled with polyurethane foam. Their findings indicated that the energy absorption indexes of the structures with filled foam were enhanced. Additionally, the researchers derived semi-empirical expressions for the initial peak load under quasi-static axial loading [44]. To summarise, staggering the internal and external grooves in thin-walled circular tubes can effectively manage compression and collapse deformation, leading to improved energy absorption. Additionally, the theoretical model for average load during quasi-static axial load can achieve more precise predictions. Nevertheless, predicting initial peak loads is challenging, particularly under dynamic impact conditions, and determining the derivation of the theoretical model becomes more difficult. Currently, there are no reports addressing the prediction model for the initial peak load of grooved thin-walled tubes under axial impact loading.
The study's main objective is to develop an initial peak load prediction model for thin-walled circular tubes with internal and external grooves made of A6061, which are subjected to low-velocity impact. We initially construct nine sample sets incorporating predetermined grooved structural parameters (including groove depth, width and number) applied to thin-walled circular tubes. The energy absorption properties of specimens subjected to impact loading are evaluated via finite element simulation. The initial peak load model incorporates the dimensional parameter of the groove and accounts for strain rate. Bringing validity to the mathematical model of the initial peak load under impact loads, the drop weight testing machine and high-speed camera are used to analyse the crushing deformation of the specimens. The initial model for initial peak load is acquired by enlarging numerous models. The adequacy of the initial peak load mathematical model is confirmed. The multi-group extended module also verifies the applicability of the expression.
2 Materials testing and design of experiments
2.1 Material parameters
Figure 1 illustrates the performance of a uniaxial tensile examination on a sample of A6061 substance according to the GB/T 228-2010 and GB/T 2975-1998 standards. The stress-strain curve and material property parameters are shown in Figure 2 and Table 1, respectively.
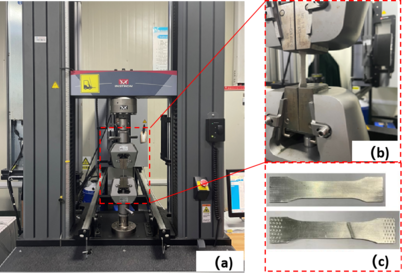
|
| Figure 1. Tensile test of A6061 specimen |
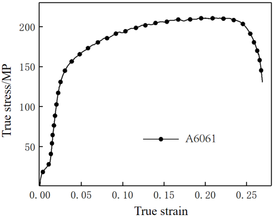
|
| Figure 2. True stress-strain curve of A6061 |
| Material | Density (kg/mm3) |
Young’s modulus (GPa) |
Poisson’s ratio |
Yield stress (MPa) |
Ultimate tensile stress (MPa) |
|---|---|---|---|---|---|
| A6061 | 2.8×10⁻⁶ | 68.9 | 0.33 | 128 | 209 |
2.2 Experimental setups
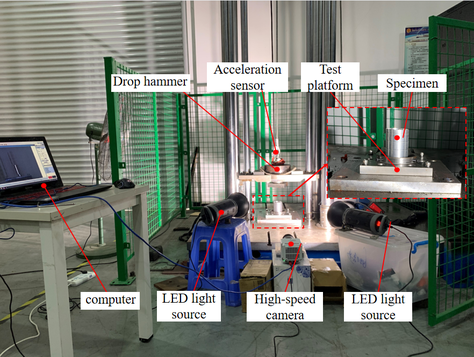
As shown in Figure 3, the test setup includes a drop-weight testing machine, a high speed camera, a LED light source device and a computer. The acceleration sensor is placed on the falling hammer to measure the acceleration-displacement curve of the compression process. The accelerometer records the hammer's deceleration upon colliding with the test specimen during its free fall.
The accelerometer measures the acceleration change and produces a voltage signal. The signal is amplified by a charge amplifier and linked to A1C050 for analog-to-digital conversion and computerized data processing. The key apparatus parameters are as follows: (1) Drop hammer: The drop hammer movement direction and installation plane have a vertical accuracy of 0.02mm. The weight of the drop hammer is 76kg. With a 70% collapse distance stiffness consideration for the minimum structure, the drop hammer height of 3.27m was chosen, resulting in a corresponding maximum speed of 8m/s. (2) High-speed camera: The camera has a resolution of 1280 x 800 and captures at 1000fps. (3) Light equipment LED: The LED has a power of 200W.
|
| Figure 3. Working principle diagram of experimental device |
2.3 Experimental program
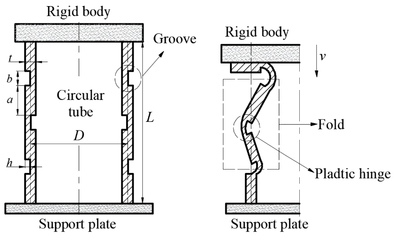
The construction of the grooved thin-walled circular tube is presented in Figure 4, where the length of the thin-walled tube is mm, the thickness is mm, the centre diameter is mm, and the distribution of the groove structure is symmetrical at both ends of the thin-walled tube. The dimensions of the grooves incorporate the groove spacing , width , number , and depth , which complies with the given equation:
|
|
(1) |
|
| Figure 4. Schematic diagram of the structure of thin-walled circular tubes with internal and external staggered grooves |
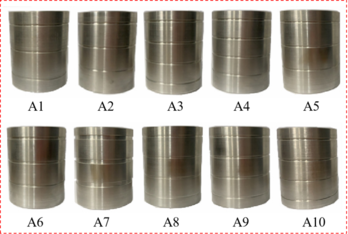
Based on Eq. (1), it becomes clear that the four variables are not entirely independent of each other. Accordingly, the investigations were evaluated for the number of grooves , width , and depth individually. A summary of the research schedule is presented in Table 2 and the specimens A1-A10 are as shown in Figure 5:
(I) To study the effect of the number of grooves : make the width of the grooves mm, the depth of the grooves mm, choose the number of grooves . Equation (1) reveals the corresponding groove spacing to be 14.67mm, 12.29mm, 10.5mm, and 9.11mm, while the experimental program in Table 2 is A1, A2, A3, and A4.
(II) In order to study the effect of groove width , the number of grooves is set to , and groove depth mm. Width is then chosen at 1.5mm, 2mm, 2.5mm, and 5mm. Using Eq. (1), the corresponding groove spacing is found to be 12.79mm, 12.29mm, 11.79mm, and 9.29mm, and the corresponding experimental program is noted in Table 2 as A5, A2, A6, and A7.
(III) Investigating the influence of groove depth : The groove spacing is fixed at mm with grooves, while the width of each groove is 2mm. Substituting values into Eq. (1), the depths are 0.25mm, 0.5mm, 0.75mm and 1mm, corresponding to Table 2's experimental program entries A8, A9, A3, A10.
| Variables Number | (mm) | (mm) | (mm) | |
|---|---|---|---|---|
| A1 | 5 | 14.67 | 2 | 0.75 |
| A2 | 6 | 12.29 | 2 | 0.75 |
| A3 | 7 | 10.5 | 2 | 0.75 |
| A4 | 8 | 9.11 | 2 | 0.75 |
| A5 | 6 | 12.79 | 1.5 | 0.75 |
| A6 | 6 | 11.79 | 2.5 | 0.75 |
| A7 | 6 | 9.29 | 5 | 0.75 |
| A8 | 7 | 10.5 | 2 | 0.25 |
| A9 | 7 | 10.5 | 2 | 0.5 |
| A10 | 7 | 10.5 | 2 | 1 |
|
| Figure 5. A1-A10 specimens |
3. FE model
3.1 FE model description
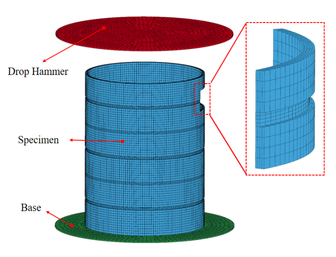
Figure 6 presents the finite element model of a thin-walled circular tube featuring staggered grooves both internally and externally. The explicit finite element programme LS-DYNA is used for the simulation. The drop hammer is treated as a rigid body, and the element type is a Solid 185 eight-node hexahedral element. LS-DYNA software employs a selection of different materials for various intrinsic models. The A6061 employs the MAT_PLASTIC_KINEMATIC model, which enables the real-time yield strength of the material to adapt to changes in the strain rate. As the panel stiffness exceeds the specimen stiffness, the MAT_RIGID model is selected.
Three contact types are defined in the finite element model: single-surface contact (ASSC) is utilized for the specimen itself, point-surface automatic contact (ANTS) is utilized for the contact between the drop hammer and the end face of the specimen, and face-to-face contact (TDSS) is utilized for the contact between the base and the bottom face of the specimen. The kinetic and static friction coefficients have been set to 0.2. The solution time has been established as 0.03 seconds with a solution data step size of 1000.
|
| Figure 6. FE model of thin-walled circular tube with internal and external staggered grooves |
3.2 Validation of the numerical model
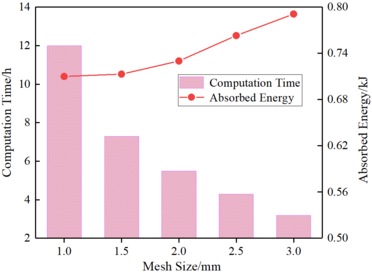
The size of the grid element greatly affects the calculation results and requires a critical choice. Figure 7 displays the influence of the analytical model A4 on the total energy absorption of the structure, utilizing grid sizes of 1.0mm, 1.5mm, 2.0mm, and 2.5mm. As demonstrated by the figure, the total energy absorption tends to converge when the mesh size is less than 2mm. Furthermore, the calculation time significantly increases with a mesh size of 1mm as compared to 1.5mm. Considering the costs of calculations and requirements for accuracy, a mesh size of 1.5mm aligns best with the simulation's actual requirements.
|
| Figure 7. Change rule of calculation results with grid size |
4. Results
4.1 Effect of the groove size parameters
Tables 3 to 5 provide a summary of both simulated and experimental results of the initial peak load of the specimens with different number of grooves, width and depth. The data shows that the maximal error value between the experimental and simulation results is only -5.13%, which confirms the reliability of the research results. Incorporating Eq. (1), Table 3 reveals that for a constant notch width , the spacing between notches gradually decreases as the number of grooves increases, and the initial peak load also gradually decreases. Meanwhile, Table 4 indicates that when the number of grooves is fixed, the spacing between grooves decreases with an increase in groove width , resulting in a progressive decrease in the initial peak load. From the data presented in Table 5, it is apparent that the maximum load decreases as the depth of the groove increases. It is worth noting that the number and width of the grooves have a minimal impact on the initial peak load, whereas the depth of the grooves has the most significant effect.
| Number | Groove number () | Initial peak load (kN) | Error (%) | |
|---|---|---|---|---|
| Experiment | Simulation | |||
| A1 | 5 | 25.91 | 25.82 | 0.35 |
| A2 | 6 | 24.78 | 25.14 | -1.43 |
| A3 | 7 | 24.28 | 24.53 | -1.02 |
| A4 | 8 | 23.13 | 23.32 | -0.81 |
| Number | Width (mm) | Initial peak load (kN) | Error (%) | |
|---|---|---|---|---|
| Experiment | Simulation | |||
| A5 | 1.5 | 25.01 | 25.21 | -0.79 |
| A2 | 2 | 24.78 | 25.14 | -1.43 |
| A6 | 2.5 | 23.91 | 24.53 | -2.53 |
| A7 | 5 | 23.23 | 23.62 | -1.65 |
| Number | Depth (mm) | Initial peak load (kN) | Error (%) | |
|---|---|---|---|---|
| Experiment | Simulation | |||
| A8 | 0.25 | 38.69 | 40.78 | -5.13 |
| A9 | 0.5 | 32.72 | 33.23 | -1.53 |
| A3 | 0.75 | 24.28 | 24.53 | -1.02 |
| A10 | 1 | 16.43 | 16.85 | -2.49 |
4.2 Experimental verification
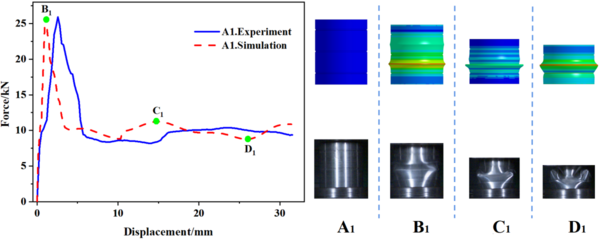
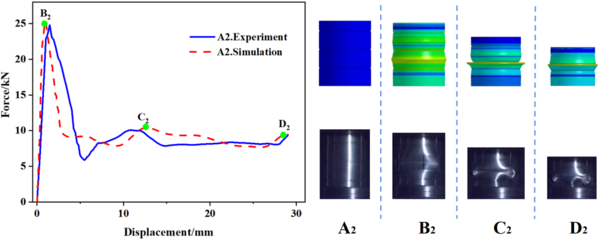
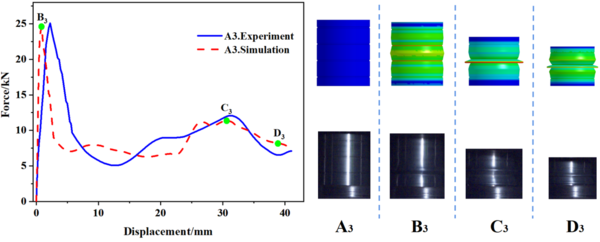
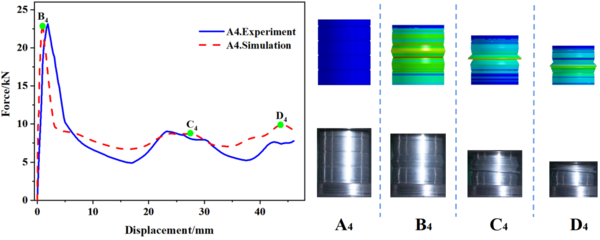
In this study, 10 specimens (A1-A10) with the same structural dimensions as those calculated by simulation were selected for testing, and the test results were then compared with the simulation results, as shown in Figure 8. Overall, the trend of the load-displacement characteristics of each specimen test corresponded well with the simulation predictions. Additionally, Tables 3 to 5 present the comparable experimental and simulated values of the initial peak load for each specimen. Furthermore, there are variations in folding positions apart from the first position, which is essentially in line with the simulation results. Moreover, the deformation patterns of a few specimens, such as A1, A2, A5, and A6, significantly vary from the simulation calculations, possibly owing to the accuracy of specimen machining and the stability of the impact testing apparatus. However, based on the load-displacement curve, it is apparent that the test findings and simulation outcomes correspond substantially.
| ||||||||||||||||||||
| Figure 8. Experimental and simulation results of specimens A1 to A10 |
5. Initial peak load prediction expression
5.1 The initial peak load theory
In general, the initial peak load is generated at the moment of collision, and the mechanism of its generation involves a number of related factors, such as material parameters, initial impact velocity, strain rate and elastic wave transmission distance, etc., and there is no exact theoretical solution for the initial peak load. The size of the initial peak load of the inner and outer staggered grooved thin-walled circular tubes is influenced by various factors during collision, including impact velocity, cross-sectional tube area, strain rate, and dimensional parameters of the grooved structure. The formation of this load is a complex physical process, lacking a theoretical derivation formula.
Based on the Cowper-Symonds equation [42], the initial peak load can be expressed as:
|
|
(2) |
where is the initial peak load; is the cross-sectional area of the thin-walled circular tube; is the dynamic yield stress of the material; is the static yield stress of the material; is the equivalent strain rate; and are the strain rate parameters.
Under low-velocity impact, the elastic stress wave generated by the thin-walled circular tube is transmitted to a distance exceeding the height of the tube . Due to the extremely short impact time, the impact velocity can be considered to be essentially unchanged before the initial peak load is reached. If the axial impact velocity of the impact block is , the equivalent strain rate can be expressed as:
|
|
(3) |
5.2 Expression derivation and verification
Thin-walled circular tubes with internal and external staggered grooves exhibit a more stable deformation pattern and require lower compression loads for collapse when compared to the tubes without grooves. The efficiency of engineering design can be improved if the initial peak load can be predicted.
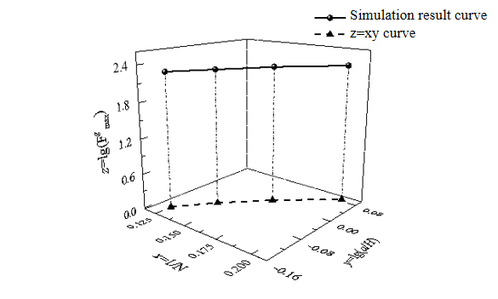
The correlation between is plotted from Table 3, as shown in Figure 9. From Table 4, it can be seen that the maximum load of the thin-walled circular tube with internal and external staggered grooves decreases linearly with the groove width . The maximum load of the thin-walled circular tube with internal and external staggered grooves decreases linearly with the groove depth . is the half wavelength (half of the fold length) of the thin-walled straight tube, which can be expressed as:
|
|
(4) |
|
|
(5) |
|
|
(6) |
As illustrated in Figure 9, when the width of the groove b and the depth of the groove are fixed, it becomes evident that the simulation result curve (Eq. (5)) and the curve (Eq. (6)) run parallel to each other. This suggests that the two spatial curves are interrelated:
|
|
(7) |
where is a constant.
|
| Figure 9. Results of data processing |
Based on the aforementioned analysis, this paper draws upon the methodology outlined in the literature [27]. The proposed strategy involves the introduction of a geometric parameter , which is related to the number of grooves , groove size , groove width and groove depth . This will be based on the simulated initial peak load of the ungrooved thin-walled circular tubes. The aim is to predict the initial peak load of the internally and externally staggered grooved thin-walled circular tube. Thus, the geometric parameter can be expressed as:
|
|
(8) |
At this point, the initial peak load of the thin-walled circular tube with staggered grooves both internally and externally is stated as:
|
|
(9) |
Based on the above data analysis, this paper represents the parameters as follows:
|
|
(10) |
Combining Eqs. (3), (9), and (10), the initial peak load of the thin-walled circular tube with internal and external staggered grooves can be determined:
|
|
(11) |
The initial peak load of the different grooved thin-walled circular tubes under impact are calculated by Eq. (11), and the results are shown in Table 6. The theoretical calculation results are basically consistent with the experimental and numerical values, and the maximum error is only -7.64%. This demonstrates the accuracy and reliability of the initial peak load expression after the introduction of geometric parameters .
| Number | Theory (kN) | Simulation (kN) |
Experiment (kN) |
Error between theory and simulation (%) |
Error between theory and experiment (%) |
|---|---|---|---|---|---|
| A1 | 23.93 | 25.82 | 25.91 | -7.32 | -7.64 |
| A2 | 24.46 | 25.14 | 24.78 | -2.70 | -1.29 |
| A3 | 23.88 | 24.53 | 24.28 | -2.65 | -1.64 |
| A4 | 22.79 | 23.32 | 23.13 | -2.27 | -1.46 |
| A5 | 24.62 | 25.21 | 25.01 | -2.34 | -1.56 |
| A6 | 24.29 | 24.53 | 23.91 | -0.98 | 1.59 |
| A7 | 23.34 | 23.62 | 23.23 | -1.19 | 0.47 |
| A8 | 39.61 | 40.78 | 38.69 | -2.87 | 2.38 |
| A9 | 31.84 | 33.23 | 32.72 | -4.18 | -2.69 |
| A10 | 15.93 | 16.85 | 16.43 | -5.46 | -3.04 |
5.3 Further verification
To confirm the applicability of the initial peak load prediction expression, Eq. (11) was used to make a theoretical comparison of the A1-A8 group of structures in the reference [33] (in this paper the test numbers correspond to A11-A18). Table 7 details the relevant structural dimensions, whilst Table 8 showcases the corresponding comparison outcomes.
| Number | (mm) | (mm) | (mm) | |
|---|---|---|---|---|
| A11 | 3 | 23 | 2 | 0.75 |
| A12 | 4 | 18.00 | 2 | 0.75 |
| A13 | 9 | 8.00 | 2 | 0.75 |
| A14 | 10 | 7.09 | 2 | 0.75 |
| A15 | 6 | 11.29 | 3 | 0.75 |
| A16 | 6 | 10.29 | 4 | 0.75 |
| A17 | 7 | 10.5 | 2 | 1.1 |
| A18 | 7 | 10.5 | 2 | 1.2 |
| Number | Initial peak load (kN) | Error (%) | ||
|---|---|---|---|---|
| Theory | Simulation | |||
| A11 | 3 | 29.13 | 27.01 | 7.85 |
| A12 | 4 | 27.70 | 26.32 | 5.24 |
| A13 | 9 | 23.47 | 22.68 | 3.48 |
| A14 | 10 | 22.35 | 20.23 | 10.48 |
| A15 | 6 | 24.49 | 24.07 | 1.74 |
| A16 | 6 | 24.23 | 23.83 | 1.68 |
| A17 | 7 | 12.37 | 13.36 | -7.41 |
| A18 | 7 | 10.04 | 11.09 | -9.47 |
Table 8 shows that the predicted results are in good agreement with the experimental results found in the literature. This again confirms the applicability of Eq. (11).
However, Table 8 reveals that the excessive number of grooves in test A14 produces a significant discrepancy between the simulation results and the predicted results. When a thin-walled circular tube with staggered internal and external grooves is subjected to axial compression, as the number of grooves increases, the thin-walled circular tube is rapidly destabilized and the initial peak load decreases sharply. At this point, the Eq. (11) is no longer applicable.
In this scenario, one can adjust the parameters of Eq. (11) as per the available experimental data to attain anticipated outcomes, thereby aiding in the selection of thin-walled circular tubes, predicting the initial peak load and advancing the project progress.
6. Conclusions
In this research, the axial buckling modes and crashworthiness of circular tube with external linear gradient grooves are investigated theoretically, experimentally and numerically. The following conclusions may be drawn:
(1) Compared to conventional thin-walled circular tubes, the grooved thin-walled circular tubes can effectively reduce the initial peak load during axial impact loading. The grooves cause symmetrical folding of the tube which directs axial deformation into regular superimposed and contracting patterns, thereby effectively improving the axial impact performance of thin-walled circular tubes.
(2) Through the comparison of experimental data and finite element simulation analyses of the internal and external grooved thin-walled circular tubes, it is found that the load-displacement curves are in good agreement, and the wrinkles produced on the thin-walled circular tubes are approximately similar at the same moment. Furthermore, the deformation from the beginning to the end of compression can correspond to each other. The maximal error value of the initial peak load is only -5.13%, and the experimental result is basically the same as that of the simulation result.
(3) The impact of groove dimensions (including the number of grooves , the width of grooves , and the depth of grooves ) on the initial peak load is analyzed via both experimental and simulation data. The two-dimensional relationship graph clearly indicates that the initial peak load reduces as groove width , groove depth , and the number of grooves increase. Finally, the geometric parameter is introduced to derive a initial peak load prediction expression for thin-walled circular tubes with internal/external staggered grooves. By comparing the predicted results of this expression with previous experimental data, it was observed that the initial peak load of the grooved thin-walled tubes is mostly consistent with the predicted results within a certain dimensional interval. This confirms the reliability of the initial peak load prediction expression.
References
[1] Du X. Impact dynamics and crashworthiness design of cylindrical shell. Science Press, 2004.
[2] Tang Z., Liu S., Zhang Z. Analysis of energy absorption characteristics of cylindrical multi-cell columns. Thin-Walled Structures, 62:75-84, 2013.
[3] Mamalis A.G., Manolakos D.E., Ioannidis M.B., et al. Finite element simulation of the axial collapse of metallic thin-walled tubes with octagonal cross-section. Thin-Walled Structures, 41(10):891-900, 2003.
[4] Rossi A., Fawaz Z., Behdinan K. Numerical simulation of the axial collapse of thin-walled polygonal section tubes. Thin-Walled Structures, 43(10):1646-1661, 2005.
[5] Liu Y.C., Day M.L. Simplified modelling of thin-walled box section beam. International Journal of Crashworthiness, 11(3):263-272, 2006.
[6] Zhang X., Huh H. Crushing analysis of polygonal columns and angle elements. International Journal of Impact Engineering, 37(4):441-451, 2010.
[7] Liu W., Lin Z., Wang N., et al. Dynamic performances of thin-walled tubes with star-shaped cross section under axial impact. Thin-Walled Structures, 100:25-37, 2016.
[8] Yamashita M., Gotoh M., Sawairi Y. Axial crush of hollow cylindrical structures with various polygonal cross-sections: Numerical simulation and experiment. Journal of Materials Processing Technology, 140(1–3):59-64, 2003.
[9] Fan Z., Lu G., Liu K. Quasi-static axial compression of thin-walled tubes with different cross-sectional shapes. Engineering Structures, 55(4):80-89, 2013.
[10] Tang Z., Liu S., Zhang Z. Energy absorption properties of non-convex multi-corner thin-walled columns. Thin-Walled Structures, 51:112-120, 2012.
[11] Reddy S., Abbasi M., Fard M. Multi-cornered thin-walled sheet metal members for enhanced crashworthiness and occupant protection. Thin-Walled Structures, 94:56-66, 2015.
[12] Abbasi M., Reddy S., Ghafari-Nazari A., et al. Multiobjective crashworthiness optimization of multi-cornered thin-walled sheet metal members. Thin-Walled Structures, 89:31-41, 2015.
[13] Tran T.N., Hou S., Han X., et al. Theoretical prediction and crashworthiness optimization of multi-cell triangular tubes. Thin-Walled Structures, 82:183–195, 2014.
[14] Chen W., Wierzbicki T. Relative merits of single-cell, multi-cell and foam-filled thin-walled structures in energy absorption. Thin-Walled Structures, 39(4):287-306, 2001.
[15] Zhang X., Cheng G., Zhang H. Theoretical prediction and numerical simulation of multi-cell square thin-walled structures. Thin-Walled Structures, 44(11):1185-1191, 2006.
[16] Najafi A., Rais-Rohani M. Mechanics of axial plastic collapse in multi-cell, multi-corner crush tubes. Thin-Walled Structures, 49(1):1-12, 2011.
[17] Zhang X., Zhang H. Energy absorption of multi-cell stub columns under axial compression. Thin-Walled Structures, 68:156-163, 2013.
[18] Nia A.A., Parsapour M. An investigation on the energy absorption characteristics of multi-cell square tubes. Thin-Walled Structures, 68:26-34, 2013.
[19] Fang J., Gao Y., Sun G., et al. On design of multi-cell tubes under axial and oblique impact loads. Thin-Walled Structures, 95:115-126, 2015.
[20] Tran T.N., Hou S., Han X., et al. Theoretical prediction and crashworthiness optimization of multi-cell square tubes under oblique impact loading. International Journal of Mechanical Sciences, 89:177-193 , 2014.
[21] Qiu N., Gao Y., Fang J., et al. Crashworthiness analysis and design of multi-cell hexagonal columns under multiple loading cases. Finite Elements in Analysis & Design, 104:89-101, 2015.
[22] Nia A.A., Parsapour M. Comparative analysis of energy absorption capacity of simple and multi-cell thin-walled tubes with triangular, square, hexagonal and octagonal sections. Thin-Walled Structures, 74:155-165, 2014.
[23] Mahmoodi A., Shojaeefard M.H., Googarchin H.S., et al. Theoretical development and numerical investigation on energy absorption behavior of tapered multi-cell tubes. Thin-Walled Structures, 102(102):98-110, 2016.
[24] Zhang X., Zhang H. Axial crushing of circular multi-cell columns. International Journal of Impact Engineering, 65:110-125, 2014.
[25] Tabacu S. Axial crushing of circular structures with rectangular multi-cell insert. Thin-Walled Structures, 95:297-309, 2015.
[26] Kim H.S. New extruded multi-cell aluminum profile for maximum crash energy absorption and weight efficiency. Thin-Walled Structures, 40(4):311-327, 2002.
[27] Zhang X., Cheng G. A comparative study of energy absorption characteristics of foam-filled and multi-cell square columns. International Journal of Impact Engineering, 34(11):1739-1752, 2007.
[28] Zhang X., Wen Z., Zhang H. Axial crushing and optimal design of square tubes with graded thickness. Thin-Walled Structures, 84:263-274, 2014.
[29] Daneshi G.H., Hosseinipour S.J. Grooves effect on crashworthiness characteristics of thin-walled tubes under axial compression. Materials & Design, 23(7):611-617, 2002.
[30] Daneshi G.H., Hosseinipour S.J. Elastic–plastic theory for initial buckling load of thin-walled grooved tubes under axial compression. Journal of materials processing technology, 125-126(36):826-832, 2003.
[31] Hosseinipour S.J., Daneshi G.H. Energy absorbtion and mean crushing load of thin-walled grooved tubes under axial compression. Thin-Walled Structures, 41(1):31-46, 2003.
[32] Hosseinipour S.J., Daneshi G.H. Experimental studies on thin-walled grooved tubes under axial compression. Experimental Mechanics, 44(1):101-108, 2004.
[33] Mirmohammadsadeghi S.E., Khalili K., Ahmadi S.Y., Hosseinipour S.J. Experimental and finite element simulation investigation of axial crushing of grooved thin-walled tubes. International Journal of Advanced Manufacturing Technology, 77(9-12):1627-1643, 2015.
[34] Liu Z., Hao W., Xie J., et al. Axial-impact buckling modes and energy absorption properties of thin-walled corrugated tubes with sinusoidal patterns. Thin-Walled Structures, 94(94):410-423, 2015.
[35] Alkhatib S.E., Tarlochan F., Eyvazian A. Collapse behavior of thin-walled corrugated tapered tubes. Engineering Structures, 150:674-692, 2017.
[36] Moradpour A., Elyasi M., Montazeri S., et al. Developing a new thin-walled tube structure and analyzing its crushing performance for AA 60601 and mild steel under axial loading. Transactions of The Indian Institute of Metals, 69(5):1107-1117, 2016.
[37] Yuen S.C.K., Nurick G.N. The energy-absorbing characteristics of tubular structures with geometric and material modifications: An overview. Applied Mechanics Reviews, 61(2):020802, 2008.
[38] Darvizeh A., Darvizeh M., Ansari R., et al. Analytical and experimental investigations into the controlled energy absorption characteristics of thick-walled tubes with circumferential grooves. Journal of Mechanical Science and Technology, 28(10):4199-4212, 2014.
[39] Montazeri S., Elyasi M., Moradpour A. Investigating the energy absorption, SEA and crushing performance of holed and grooved thin-walled tubes under axial loading with different materials. Thin-Walled Structures, 131:646-653, 2018.
[40] Zheng Y.Q., Zhu X.C., Dong X.Q., et al. Theoretical and experimental studies on the axial impact behavior of Q235B longitudinally welded tubes. Journal of Vibration and Shock, 35(20):98-103, 2016.
[41] Niknejad A., Abedi M.M., Liaghat G., et al. Foam-filled grooved tubes with circular cross-section under axial compression: a theoretical analysis. Iranian Journal of Science and Technology-Transactions of Mechanical Engineering, 40(3):155-167, 2016.
[42] Wei Y., Yang Z., Yan H., et al. Proactive regulation of axial crushing behavior of thin-walled circular tube by gradient grooves. International Journal of Mechanical Sciences, 108:49-60, 2016.
[43] Yang Z., Yu Y., Wei Y., et al. Crushing behavior of a thin-walled circular tube with internal gradient grooves fabricated by SLM 3D printing. Thin-Walled Structures, 111:1-8, 2017.
[44] Abedi M.M., Niknejad A., Liaghat G.H., et al. Foam-filled grooved tubes with circular cross section under axial compression: an experimental study. Iranian Journal of Science and Technology, Transactions of Mechanical Engineering, 42:401-413, 2018.Document information
Published on 23/05/24
Accepted on 12/05/24
Submitted on 22/10/23
Volume 40, Issue 2, 2024
DOI: 10.23967/j.rimni.2024.05.006
Licence: CC BY-NC-SA license
Share this document
Keywords
claim authorship
Are you one of the authors of this document?
