m (Dear editor and reviewer, we have made corresponding revisions to the entire text. Thank you for your suggestions.) (Tag: Visual edit) |
m (Onate moved page Review 663194049661 to Wang et al 2024a) |
(No difference)
| |
Revision as of 10:39, 20 March 2024
Abstract: The integration of a large amount of renewable energy sources into the new distribution system has significantly altered its fault characteristics, resulting in variable operation modes and limited short-circuit currents. Hence, early arc faults can serve as indicators of impending system short-circuits, and prevent the difficulty of tripping the new distribution system by effectively detecting them in advance. A quantitative analytical model for the early fault current and temperature is developed, and a theoretical analysis reveals the challenges of achieving reliable detection based solely on either current or temperature. A novel early fault detection method that combines current and temperature is proposed, which further utilizes arc power as a complex feature to identify early faults. The proposed feature integrates the promptness of the electrical signal (zero-sequence current) and the high sensitivity and reliability of the thermal signal (temperature), and exhibits higher reliability than the existing method. The validity of the proposed method is verified by PSCAD simulation, field data and laboratory simulated fault tests.
Key words: Early arc faults; Fault detection method; New distribution system; Arc model; Compound eigenquantity criterion.
1. Introduction
The integration of new energy sources into the distribution network has significantly altered the fault characteristics of the new distribution system. The fluctuation of new energy output causes the power distribution system to operate in various modes, and the short-circuit current of the new energy sources is constrained in magnitude and phase, leading to the weak short-circuit current of the new distribution system. This poses reliability challenges, especially under high transition resistance conditions [1]. Numerous incidents of forest fires, equipment damage, personal casualties and other severe consequences have been reported due to the failure of timely tripping in the event of system faults [2]. In this context, the early arc fault is an indicator of the system's impending short circuit, and by identifying and tripping the early fault arc, the occurrence of short circuit faults can be effectively prevented, and the likelihood of erroneous protection actions can be reduced to some extent. Hence, it is of paramount importance to investigate the early fault detection method of the new distribution system.
Existing detection methods can be classified into electric and non-electric methods based on the different fault characteristics. The electric gas method can be further categorized into linear method [3] and nonlinear method [4] depending on whether the nonlinear features of the arc are considered. The linear method models the early fault arc as a linear resistance and employs the traveling wave impedance [3] and transient zero-sequence component correlation [5] to identify the early fault. The nonlinear method constructs the criterion using the current waveform distortion [6] and high frequency energy [7, 8] of the early fault arc. However, the fault current and voltage characteristics in the early stage are relatively weak and hard to differentiate from the system noise, resulting in difficulties in adjustment and the issue of relatively high resistance to movement relying solely on the electrical characteristics.
The line temperature is monitored by various temperature measuring equipment in the non-electric gas method. The temperature measurement technology of lines based on distributed optical fiber, which can measure the temperature information along the line in real time with a measurement range of tens of kilometers, has been implemented in engineering [9]. The optical fiber serves as both a signal transmission channel and a temperature sensor. Due to the small zero-sequence current amplitude of the fault in the early stage of the new distribution system, the arc suppression coil fails to quench arc effectively [2], resulting in continuous arc burning and heating after the fault. Therefore, the fault detection method based on the line temperature rise characteristics is a feasible idea. However, the core problem of using only overtemperature characteristics to identify early faults is that the temperature changes slowly and the spatial distribution characteristics are not uniform, which leads to greater randomness of the measured value of the temperature measuring equipment, difficult setting, and poor rapidity.
Faced with the problems of insufficient reliability of electrical quantity characteristics and poor speed of temperature quantity characteristics, this paper analyzes the problems of detection methods relying solely on a single characteristic quantity based on an early fault equivalent model, and proposes a new early fault detection method for distribution systems that combines current quantity and temperature quantity. Using the sudden change characteristics of the fault zero sequence current waveform to form a disturbance detection threshold, and then detecting early faults based on composite feature quantities. This feature combines the speed of electrical signals and the high sensitivity and reliability of thermal signals, providing a new optional approach for fault detection in new distribution systems with high proportion of new energy access. The effectiveness of the proposed method was verified through PSCAD simulation, on-site data, and laboratory simulated fault tests.
2. Analysis of early fault arc characteristics
2.1 Analysis of power characteristics of early fault arc
The equivalent circuit model for early faults is composed of a constant resistance and an arc resistance connected in series [2]. The constraint equations for the voltage and current at the fault point are:
|
|
(1) |
In the formula, the arc resistance is a dynamic nonlinear resistance. Among the existing research results on modeling , the Kizilcay arc model is most widely used from the perspective of arc energy balance [10], so this model is chosen. The control equation is:
|
|
(2) |
In the formula: is the arc current; 、 and are the arc time constant, arc characteristic voltage, and characteristic resistance, respectively. Based on experimental data of underground cable arc faults [11], arc parameters were obtained. takes 0.2~0.4 ms, takes 300~4000 V and takes 0.005~0.015 Ω.
Equations (1) and (2) together constitute the equivalent model of the fault point under early faults. In order to study the power characteristics of the fault arc, further analytical analysis is conducted on the model. Solve differential equation (2) and obtain:
|
|
(3) |
Considering that the attenuation index component usually decays to 0 within 2-5 cycles, which is extremely short in time scale compared to temperature changes, it can be ignored. At the same time, considering that: 1) the arc current waveform is approximately a power frequency sine wave, the influence of waveform and phase error can be ignored, so , is the current amplitude at the fault point. 2) Considering that , the latter can be omitted. The analytical formula for arc conductivity derived from this is:
|
|
(4) |
The second term in equation (4) basically only affects the conductivity phase and can be ignored, thus simplifying it as follows:
|
|
(5) |
In the formula, represents the phase difference generated by the second term of equation (4) through triangular transformation, and is slightly less than 0, indicating that the arc is inductive to the outside. The analytical expression for early fault arc power is:
|
|
(6) |
Considering that the time scale of power is in seconds, the effective value expression of early fault arc power can be calculated:
|
|
(7) |
Under the clamping effect of a large transition resistance, the early fault is approximately . By substituting the fault circuit equation into equation (7), the quantitative relationship between the early fault arc power and the transition resistance at the fault point can be obtained:
|
|
(8) |
As shown in equation (8), the arc power is inversely proportional to the transition resistance. The fault arc power value remains at 1.35kW under the level of 3kΩ transition resistance, and the temperature rise time scale of the fault point is in the second level. The cable load loss power during normal operation is typically less than 1W/m, and the line temperature fluctuations induced by this are usually in the hourly range [12], which are negligible compared to the fault arc power. Hence, early failures exhibit significant temperature rise characteristics compared to normal operation.
2.2 Analysis of temperature characteristics of early fault arc
The line temperature rise characteristics induced by the early faulty arc power can be measured by the distributed optical fiber temperature measuring equipment, which is usually installed near the line, as illustrated in Figure 1.
As shown in Figure 1, the temperature measurement fiber is limited to measuring the temperature at a specific point in the cross-sectional dimension of the line. The temperature data obtained at the installation point of the optical fiber exhibit considerable variability depending on the location of the fault. Moreover, the temperature rise is negligible when the fault occurs far away from the laying point of the optical fiber. Hence, the temperature distribution function of this section, which is determined by the temperature distribution characteristics on the cross-sectional dimension of the line surface after the fault, needs to be analyzed to enable the accurate measurement of the temperature value by the temperature measuring equipment. 
The physical model of this problem, which is a complex two-dimensional unsteady heat transfer problem, is depicted in Figure 2(a). In this paper, the two-dimensional problem is simplified and decomposed into the superposition of multiple one-dimensional problems. The simplification approach is as follows: 1) The structure in the line that has negligible influence on the surface temperature distribution is omitted. 2) The heat transfer sequence after the fault is as follows: the air gap is heated up first, followed by the heat transfer between the metal layer and the outer protective layer, which is referred to as the transverse heat transfer process; Due to the much higher heat transfer capacity of metal than that of polyethylene material, the heat transfer process of the metal layer outer sheath is referred to as the longitudinal heat transfer process.
The simplified model obtained from the above simplification is shown in Figure 2 (b). Considering the small volume of the air gap at the location of the fault damage, a centralized parameter thermal path model is used to solve it. The dynamic process is represented by series connection of thermal resistance and heat capacity , and the faulty heat source is equivalent to a constant source [13]:
|
|
(9) |
In the formula: is the line temperature before the fault.
The heating process of the metal layer by the air gap can be solved by the following equation based on boundary ① in Figure (b):
|
|
(10) |
In the formula: is the thermal diffusion rate of the metal; , and represent thermal conductivity, density, and specific heat coefficient, respectively; is the outer radius of the metal layer; is the air gap temperature shown in equation (9); is the temperature distribution function of the metal layer.
By substituting equation (9) into the boundary conditions of equation (10), the expression for the temperature distribution of the metal layer can be obtained:
|
|
(11) |
In the formula, and belong to the family of Gaussian error functions.
The definite solution equation on boundary ② is similar to equation (10) and will not be repeated. By integrating boundaries ①, ②, and ③, the temperature distribution pattern of early fault lines can be derived:
|
|
(12) |
In the formula: is the thermal diffusion rate of polyethylene; is the thickness of the outer protective layer; is the spatial variable in the radial dimension of the outer protective layer; is the temperature distribution of the metal layer shown in equation (11); is the surface temperature of the cable before the fault. is the temperature distribution function of the outer protective layer.
According to the function in equation (12), it can be seen that the overall fault temperature shows a monotonic upward trend with the increase of time variable t; As the spatial variable x increases, it rapidly decays, and the spatial distribution shows a significant temperature gradient. This inference mathematically confirms the previous viewpoint: limited to the installation method of distributed temperature measurement optical fibers, there is a certain degree of randomness in the temperature changes measured by the equipment after a fault, which will affect the criterion setting and detection speed. More effective detection algorithms are needed to adapt to it.
3. Early fault detection method
As deduced from the above theory, the early fault has a large fault heating power and a conspicuous temperature rise characteristic at the fault point. However, the existing temperature measuring equipment has a limitation that causes the line temperature measurement value to be random. Hence, the fault criterion is formulated by combining the composite characteristics of zero sequence current and fault temperature, and the software algorithm is employed to compensate for the condition limitation of hardware equipment and enhance the reliability and detection speed.
3.1 Analysis of the principle of compound characteristic quantity criterion
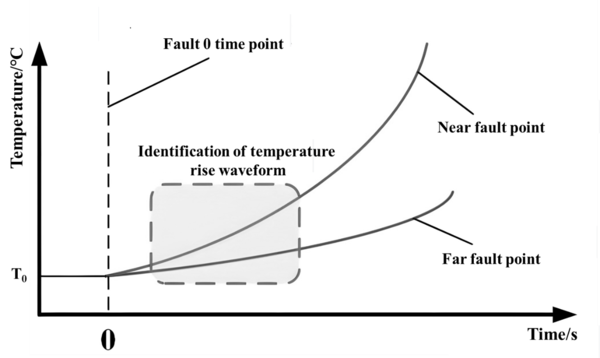
The theoretical analysis reveals that the early fault temperature changes slowly and the spatial distribution is not uniform. Therefore, the temperature measuring equipment suffers from greater measurement randomness when the fault randomly occurs at a certain cross-section position, leading to difficulty in setting and poor rapidity. The problem can be solved by collecting temperature data in a fixed time window and identifying faults based on the temperature waveform features illustrated in the fault temperature distribution expression (12), as shown in Figure 3.
The line’s surface temperature does not increase instantly after an early fault, rendering the temperature measuring equipment incapable of determining the fault’s zero time point solely based on temperature information. Consequently, the horizontal axis information of the temperature rise waveform remains undetermined. Hence, electrical characteristics are introduced to construct a low disturbance detection threshold for the algorithm’s initiation and to provide the fault zero time point for the identification of temperature rise waveform features.
3.2 Disturbance detection threshold based on sudden change of zero sequence current waveform
As stated in section 3.1, the electrical characteristics are required as the disturbance detection threshold. However, the amplitude information of zero sequence voltage and current is hard to discern effectively for early faults above 3 kΩ. Hence, the waveform mutation feature of zero sequence current before and after the fault is chosen as the disturbance detection threshold in this paper, which is independent of the amplitude information and can circumvent the problem of the algorithm’s rejection.
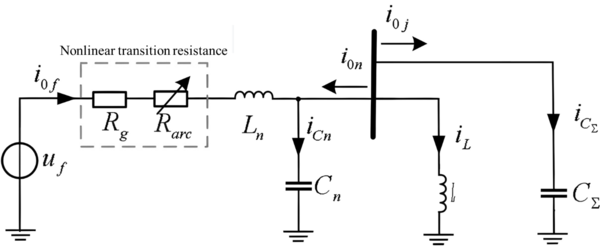
The fault equivalent circuit after early system failures can be represented by Figure 4. Among them, is the equivalent inductance of the arc suppression coil; is the sum of the equivalent ground capacitance of the busbar and the healthy line; and are the equivalent inductance and capacitance on the faulty line, respectively; , and represent the current flowing through , and , respectively; is the zero sequence fault component voltage ( is the phase voltage amplitude during normal system operation, is the power frequency angular frequency, is the initial phase angle of the fault); is the zero sequence current flowing through the fault point; and are the zero sequence currents obtained from the measurement points of the healthy and faulty lines, respectively; and are the constant transition resistance and nonlinear arc resistance in the early fault equivalent model, respectively.
Write differential equations based on fault equivalent circuits:
|
|
(13) |
As deduced from equation (13), the analytical expressions for the currents and flowing through the faulty and healthy lines can be obtained. The transient response process is essentially a second-order zero state response that encompasses nonlinear components [2]. The zero sequence current displays a weak power frequency sine wave under normal operation due to factors such as line to ground capacitance, three-phase parameter imbalance, and measurement errors. Under the second-order transient response of faults, the zero sequence current flowing through the measurement point undergoes a discontinuous mutation. For instance, when compensating for system over damping, without considering the nonlinearity of grounding arc, the zero sequence current of the faulty line can be expressed as a piecewise function in the following form:
|
|
(14) |
The piecewise function shown in equation (14) reveals that the transient waveform of the zero sequence current of the faulty line will undergo a sudden change at time t=0, and coupled with the nonlinear influence of the arc, its waveform mutation characteristics will be more severe.
In order to identify this feature, this paper selects a low computational complexity and high sensitivity multi-resolution morphological gradient to extract it. The core process of the algorithm is the combination of four basic operations (dilation, corrosion, open operation, and closed operation) of the structural element on the target signal f, which can achieve one-dimensional signal waveform mutation feature recognition. For one-dimensional signals, flat structural elements are usually selected:
|
|
(15) |
In the formula, and are the two structural sub elements used to identify the rising and falling edges of the signal, respectively; is the length of the structural element.
Based on the structural factor , the proposed algorithm first performs filtering preprocessing on the collected zero sequence current data to improve its tolerance to noise. The preprocessing algorithm is a morphology based open close filtering operation, as shown in equation (16):
|
|
(16) |
|
(17) |
The calculation symbols shown in equations (16) and (17) are the basic operation rules defined by MMG, please refer to reference [27] for details. In equation (17), is the number of MMG operations, usually taken as 3. and are the values of the structural sub elements and after the k-th operation, respectively. is the final calculation result.
The key to applying MMG to the waveform mutation characteristics of fault zero sequence current is that the structural factor should match the geometric shape of the target signal in order to reliably identify the mutation characteristics in the signal. For sinusoidal periodic signals, the length l of the one-dimensional structural factor used in this article should correspond to the system's power frequency period. When the zero sequence current flowing through the measuring point is a sine wave, the MMG calculation result . When the waveform undergoes a sudden change at a certain moment , the MMG calculation result . Set the setting value to obtain the criteria for sudden changes in the waveform of the fault zero sequence current as follows:
|
|
(18) |
In the formula, is the zero sequence current measured on the n-th section.To ensure a low rejection threshold for disturbance detection, the threshold value should be set low.。
3.3 Fault detection based on compound eigenquantity criterion
After initiating the algorithm through the disturbance detection threshold and acquiring the zero time point information of the fault, this section utilizes the known information to identify the fault temperature rise waveform characteristics, which form a composite feature quantity early fault detection criterion.
According to the theoretical analysis in sections 2.1 and 2.2, when the heating power of early faults is , the temperature distribution function on the cable surface along the cross-sectional dimension can be written as . From this equation, it can be seen that the waveform characteristics of the fault temperature rise measured by distributed optical fibers are determined by the three parameters , , and . The temperature and time can be obtained separately through temperature measurement equipment and disturbance detection threshold, as well as two unknown parameters and . Therefore, based on equation (12), this article identifies the unknown parameters and using the data of known variables and , and constructs fault criteria based on the range of values of
The above waveform parameter identification process is essentially an unconstrained nonlinear least squares fitting problem, with the objective function being:
|
|
(19) |
In the formula, represents the number of temperature data; is the i-th sampling value. The sampling frequency of existing distributed fiber optic temperature measurement devices is usually 1Hz. After extensive simulation and experiments, this paper determines that taking m as 20 can better balance the detection speed and identification accuracy of the algorithm. From this, it can be concluded that the sampling time of the proposed algorithm is 20 seconds.
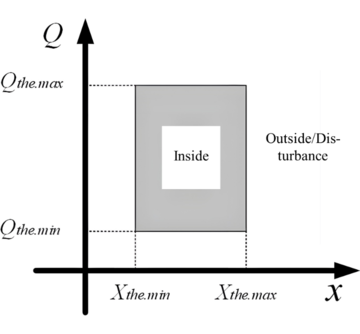
This optimization problem can be solved based on the Levenberg Marquardt (LM) algorithm, which has a mature encapsulation module in Matlab, and will not be repeated due to space limitations. After calculating the identification values of , a two-dimensional fault detection criterion can be constructed based on its different value ranges under fault and non-fault conditions, as shown in Figure 5.
The setting principle of the fault criterion shown in Figure 5 is as follows:
1) For the tuning of , according to theoretical analysis, the value range of should be . Among them, is the maximum mapping coefficient, which is only related to the parameters of the cable itself, and is the outer diameter of the metal layer. Introducing a margin coefficient , the tuning range of is .
2) For the tuning of , in principle, when there is no fault, but considering interference factors, the algorithm always calculates an error value , so needs to avoid interference error . The temperature measurement is less affected by interference factors, mainly from equipment measurement errors (distributed fiber optic temperature measurement error ± 0.5 ℃), temperature noise errors, and interference heat source errors. Among them, the temperature noise error can be selected based on empirical values, usually 0.5 ℃ is sufficient to meet the requirements. Based on the measurement error and noise error of the comprehensive equipment, can be calculated by substituting the normal operating temperature fluctuation of ± 2 ℃ into equation (19). The interference heat source error comes from factors such as cable core heating and sunlight exposure. Based on a large amount of on-site operation data, it is known that such heat sources usually have an impact on cable temperature on an hourly time scale [14]. This article only collects temperature information within 20 seconds and is almost unaffected. Similarly, considering the margin coefficient kp, the tuning range of is
The final criterion for fault identification is:
|
|
(20) |
Based on the previous analysis, this paper uses the sudden change characteristics of the zero sequence current waveform and the information of the line temperature rise waveform within 20 seconds to form the early fault composite characteristic quantity criterion. The algorithm flow is shown in Figure 6.
4. Simulation verification
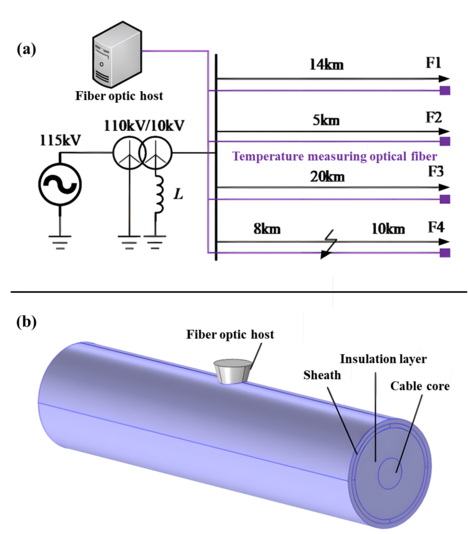
To validate the proposed detection criteria for the composite characteristic of early faults, a composite simulation model of the electromagnetic field and temperature field of early faults of the line was constructed as follows: First, a typical 10 kV neutral grounding distribution network model through arc suppression coil was built based on the PSCAD simulation software, as illustrated in Figure 7(a). The system comprises four lines, and detailed line parameters are presented in Table 1. The arc model at the fault point is provided in section 2.1. The compensation of arc suppression coil was set to 8%. Outgoing line 4 was faulty 8km from the bus bar.
Using COMSOL finite element simulation software, the electromagnetic and temperature fields of a 10kV YJV22-6/10kV 500mm2 nominal section cable were coupled and modelled, as depicted in Figure 7(b). The cable had a length of 10m, and Table 2 lists its detailed material and geometric parameters.
| Line type | R1 | C1 | L1 | R0 | C0 | L0 |
| Ω/km | Ω/km | Ω/km | Ω/km | Ω/km | Ω/km | |
| Aerial conductor | 0.17 | 0.0097 | 1.2096 | 0.23 | 0.006 | 5.4749 |
| Cable | 0.27 | 0.339 | 0.255 | 0.27 | 0.28 | 1.019 |
| Stucture/Material | Thickness/radius (mm) | Relative permeability | Conductivity (S/m) | Relative dielectric constant | Thermal conductivity (W/(m×K)) | Density (kg/m3) | Constant pressure heat capacity (J/(kg×K)) |
| Cable core/Copper | 30.3 | 1 | 55274 | 1 | 30.1 | 8700 | 385 |
| Conductor shielding layer/Semiconductor mixture | 8.50E-04 | 1 | 2 | 2.25 | 10 | 1055 | 2405 |
| Insulation layer/XLPE | 19.5 | 1 | 1.00E-18 | 2.5 | 0.46 | 930 | 2302 |
| Insulation screen/Semiconductor mixture | 8.50E-04 | 1 | 2 | 2.25 | 10 | 1055 | 2405 |
| Metal layer/aluminium | 2.5 | 1 | 3.77E+07 | 1 | 238 | 2700 | 900 |
| Sheath/polyethylene | 2.9 | 1 | 1.00E-18 | 2.5 | 0.46 | 935 | 2302 |
4.1 Early fault arc power analysis verification
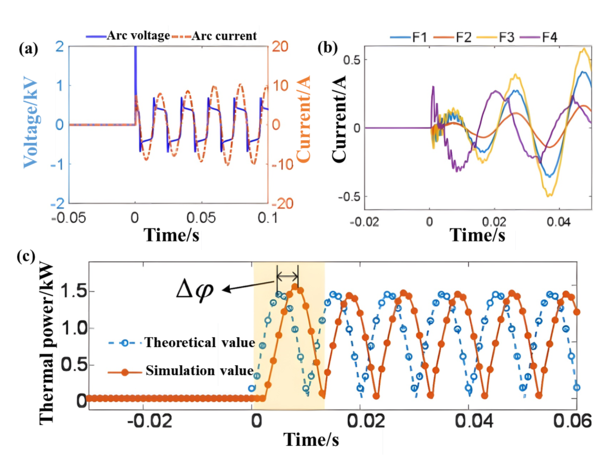
The parameters in the fault model are set as follows: a constant resistance of 8 kΩ, an arc characteristic voltage parameter of 1 kV, and a characteristic resistance parameter of 0.015. Through PSCAD simulation, the zero sequence current, arc voltage, arc current, and early fault arc power of each line are obtained as shown in Figure 8.
As shown in Figures 8 (a) and (b), the voltage and current waveforms of the arc display significant nonlinearity after the fault occurs. The zero sequence current waveform in the system experiences significant waveform changes at time t=0, which agrees with the piecewise function equation (14).. Additionally, due to the presence of the nonlinear resistor , the zero sequence current after the fault has significant high-frequency harmonics. Therefore, the presence of fault arcs increases the waveform change characteristics of the zero sequence current, which is consistent with theoretical analysis.
As can be seen from Figure 8(c), the calculation results of the early fault arc power analytic formula derived from equation (8) are in good agreement with the simulation, and the waveforms of the two differ by a phase Angle Δφ in phase, which accords with the conclusion obtained during the simplification of equation (5). Combined with theoretical calculation and simulation, it can be seen that the early fault arc power of 8kΩ is still as high as 1.46kW, which has obvious temperature characteristics, and the fault detection idea based on this feature is feasible.
4.2 Analytical verification of temperature distribution characteristics of early faults
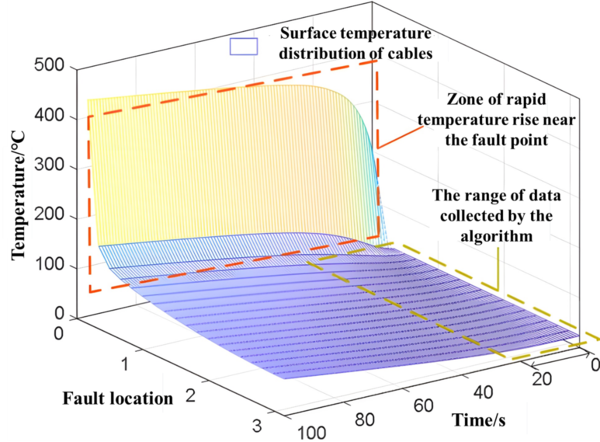
The surface temperature distribution characteristics of the cable after the fault were obtained by importing the COMSOL model with the early fault arc power values from the previous simulation as conditions, as illustrated in Figure 9.
As Figure 9 illustrates, the temperature distribution on the cable cross-section dimension exhibits a monotonic increase overall and extremely uneven local characteristics after the fault. Consequently, the installation principle constrains the distributed fiber optic temperature measurement equipment, and the measured values display a certain degree of randomness, which agrees with the theoretical analysis in the article. The temperature rise amplitude within 20s may be less than 10 ℃ if the fault occurs far from the fiber optic installation point, resulting in the problem of early faults evolving into short circuit faults that are challenging to detect reliably.
4.3 Disturbance detection threshold verification
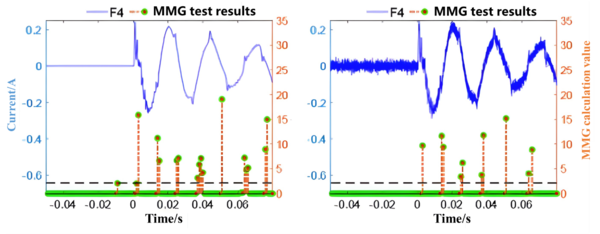
This section verifies the action performance of disturbance detection threshold. When a constant resistance is set to 10 kΩ, Figure 10 shows the detection results of the F4 fault on the output line.
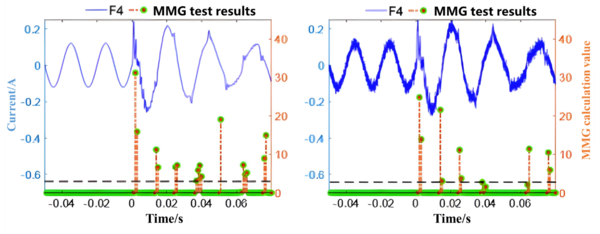
As shown in Figure 10 (a), the waveform mutation characteristics of zero sequence current at a transition resistance value of 10 kΩ can be effectively detected by the disturbance detection threshold. Based on (a), a 20dB noise signal is superimposed in Figure 10 (b), and the MMG calculation results cross the threshold effectively. It is evident that the proposed method has a certain level of noise tolerance. Zero sequence current may also exist in the system during normal operation due to factors such as measurement errors of current transformers, load and line parameter imbalance, and the waveform is usually a sine wave. To examine the effect of such working conditions on the disturbance detection threshold performance, a system three-phase asymmetry of 3.5% was set in PSCAD, and the discrimination results of the disturbance detection threshold are presented in Figure 11.
As Figure 11(a) and (b) illustrate, mismatched three-phase line parameters cause the zero sequence currents measured in each section during normal operation to display a sinusoidal waveform, which agrees with the theoretical analysis previously mentioned. The amplitude change of the zero sequence current before and after the fault is relatively small at a 3.5% asymmetry, rendering it unsuitable as a fault identification feature. Under this operating condition, the MMG calculation value of the disturbance detection threshold can cross the threshold reliably, and can also initiate reliably under 40dB noise. The proposed method only detects sudden changes in waveform information and does not depend on changes in amplitude, demonstrating its suitability for detecting early faults under large transition resistances.
4.4 Verification of composite eigenvalue detection criteria
According to the tuning principles of the criteria and the parameters of the constructed model, the error term is calculated to be 0.247. In fault criterion (20), the set values of and are (0.3, ∞) and (-0.1, 4.2), respectively.
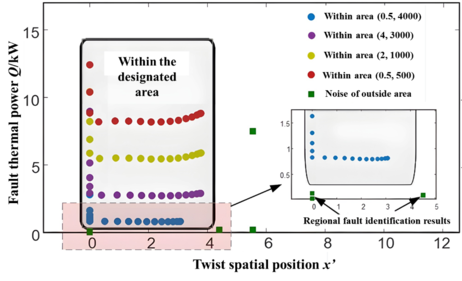
To verify the effectiveness of the proposed early fault detection method. According to the theoretical derivation of the characteristics of early fault arcs, it can be inferred that the main conditions affecting the temperature characteristics of faults are the arc model parameter , constant resistance , and the location of the fault cross-section. For the above three conditions, the detection results of the proposed method obtained through the joint simulation model of PSCAD and COMSOL are shown in Figure 12 and Table 3.
Figure 12 highlights the effectiveness of the proposed method at different cross-sectional positions . On the surface of the cable from A to E in Figure 12 (b), 19 equidistant points at different positions were selected for verification. The four different colored dots represent the verification results under four different ( ) fault conditions. The green dots represent external fault noise. Considering the most unfavorable conditions, set the amplitude of noise outside the area to ±2 ℃.
| Transition resistance/Ω | Characteristic voltage/kV | Fault location | Power Qf/kW | Detection value | Detection accuracy (Qf-Q)/Qf | Result | |
| Q | x | ||||||
| 1000 | 1 | B | 5.3 | 5.24 | 0.15 | 1.13% | √ |
| 2 | C | 8.6 | 7.37 | 1.61 | 14.30% | √ | |
| 2000 | 0.5 | D | 1.5 | 1.35 | 2.88 | 10.00% | √ |
| 1 | E | 2.8 | 2.62 | 3.5 | 6.43% | √ | |
| 4000 | 2 | D | 2.3 | 2.08 | 2.88 | 9.56% | √ |
| 4 | E | 2.5 | 2.35 | 3.52 | 6.00% | √ | |
| 6000 | 0.3 | D | 0.36 | 0.355 | 2.94 | 1.69% | √ |
| 0.5 | E | 0.51 | 0.52 | 3.49 | 2.10% | √ | |
| 7000 | 0.3 | D | 0.31 | 0.32 | 3.4 | 3.20% | √ |
| 0.5 | E | 0.44 | 0.464 | 3.41 | 5.64% | √ | |
| 8000 | 0.4 | C | 0.3 | 0.278 | 1.47 | 7.33% | × |
| 1 | D | 0.69 | 0.64 | 2.67 | 8.33% | √ | |
Table 3 verifies the fault detection performance of the proposed algorithm when arc model parameters and constant resistance are different. The identification errors of the temperature rise waveform parameters ( , ) and the results of fault identification are given in the table. Combining Table 3 and Figure 12, it can be seen that although the randomness of fault occurrence location leads to the randomness of measurement of temperature measuring equipment, the proposed method can identify and determine the compound characteristic parameters and more accurately, and use their fault value ranges to reliably detect faults. The proposed method may not cause misjudgment until the transition resistance is 8 kΩ. Moreover, when the noise waveform is ±2℃, the parameter identification values will not fall into the action zone, and the proposed method has a high noise tolerance ability.
5. Field data validation of disturbance detection thresholds
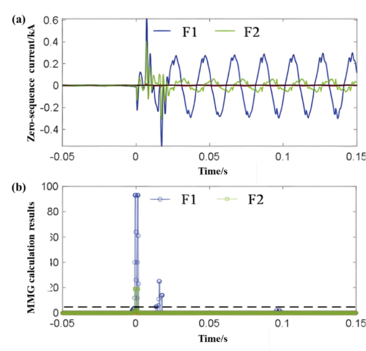
The validity of the proposed disturbance detection threshold is further verified by using a set of actual wave recording data after one of the two outlet lines of HY Station in Jiaungsu in 2022 suffered a high-resistance early failure. The verification results are shown in Figure 13.
As Figure 13(a) illustrates, the zero sequence current exhibits a large waveform mutation at t=0 before and after the fault. The MMG calculated value of the disturbance detection threshold surpasses the threshold in the output lines F1 and F2, which can initiate the subsequent fault detection algorithm reliably. Different decibels of noise were superimposed on the field data to verify the disturbance detection threshold’s anti-interference ability. The second test in Table 4 displays the verification results. The disturbance detection threshold maintains a good detection effect when 10dB noise is superimposed.
| No. | MMG calculation value (1) | Result | MMG calculation value (1) | Result |
| 1(30dB) | 67.5 | √ | 22 | √ |
| 2(20dB) | 50 | √ | 25 | √ |
| 3(10dB) | 40 | √ | 11 | √ |
6. Laboratory simulation of early failure test verification
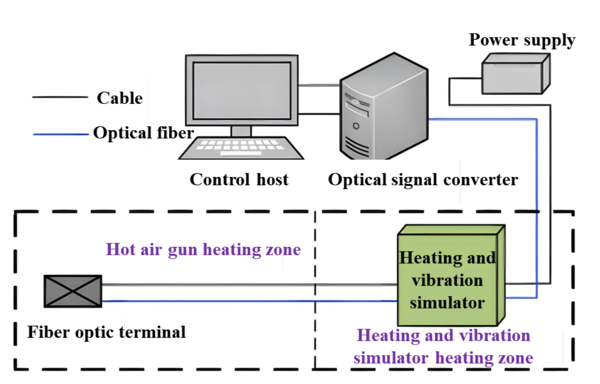
Figure 14 illustrates the artificial simulation test platform for early earth fault in the laboratory. The test equipment consists of a control host, a temperature measurement optical fiber, and a heating device. The distributed temperature measurement fiber measures the line with a total length of 112 m and a sampling frequency of 0.33 Hz. Figure 14(b) displays the specific components of each equipment.
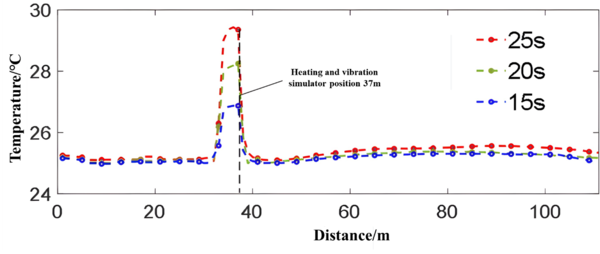
A fault heating and vibration simulator, which was fixed at 37 m along the cable, was employed as the heating equipment. It had two heating gears of 2 kW and 4 kW, and could simulate the fault arc heating effect well. Alternatively, a hot air gun could be used to heat any position of the cable, with adjustable heating power, but the simulation effect was inferior. Since the existing test equipment could not generate the real early ground fault directly, the fault arc heating was approximated by heating the cable with the heating equipment. The artificial simulation process of the early ground fault was as follows: the heating equipment was applied to different positions of the cable, the temperature data along the cable was collected by a temperature measuring optical fiber and transmitted to the control host, and the fault identification algorithm shown in equation was used for calculation. The heating and vibration simulator was heated at 37 m of the cable with 2 kW power gear, and the test recording and broadcasting data were obtained as shown in Figure 15.
Figure 15 demonstrates that the temperature increases gradually after heating, and only ascends by less than 10 ℃ within 25 s. Hence, it is challenging to differentiate fault and interference heat source by merely employing overtemperature characteristics and neglecting temperature change velocity information.
Table 5 presents the fault identification results achieved by heating the cable at various power levels of the temperature/stress simulator and the identification results attained by heating the cable at different positions of the heat gun at diverse power levels. The results indicate that the proposed method can identify early faults dependably.
| Heating Equipment | Power gear/kW | Fault location/m | Temperature rise waveform characteristic parameters | Result | |
| Q | x | ||||
| Heating and vibration simulator | 2 | 37 | 2.865 | 2.16 | √ |
| 4 | 37 | 5.73 | 2.58 | √ | |
| Hot air gun | 0.4 | 48 | 0.497 | 0.75 | √ |
| 0.6 | 75 | 0.786 | 2.22 | √ | |
| 0.8 | 105 | 0.915 | 1.47 | √ | |
7. Conclusion
In the evolving landscape of distribution systems with a heightened integration of renewable energy sources, the conventional topology exhibits significant variability, leading to a constrained fault current and a subsequent reduction in fault detection reliability. Addressing this challenge necessitates the recognition of early failures indicative of short-circuit faults, from which the ensuing conclusions are extrapolated:
1. An analytical model quantifying the electrical and thermal parameters of incipient faults has been formulated. The investigation into the heterogeneous distribution of the cable surface’s thermal field during such faults reveals that reliance on a singular electrical or thermal parameter impedes the attainment of dependable detection.
2. It is posited that a synergistic detection approach, harnessing both current and temperature, augmented by the inclusion of arc power as a composite diagnostic metric, offers enhanced early fault identification. This metric synergizes the immediacy of the electrical signal (zero sequence current) with the heightened sensitivity and dependability of the thermal signal (temperature). Consequently, this proposed methodology surpasses existing techniques in terms of reliability and detection alacrity, presenting a novel paradigm for fault detection in new energy-enriched distribution systems.
References
[1] Xu B.Y., Xue Y.D., Feng G., Wang C. Discussion on some problems of grounding fault protection in distribution network. Power Syst. Autom., 43(20):1-7, 2019.
[2] Wang B., Geng J.Z., Dong X.Z. Analysis and detection of volt ampere characteristics of high resistance grounding fault in distribution network. Chin. J. Electr. Eng., 34(22):3815-3823, 2014.
[3] Zhang C.H., Song G.B., Dong X.Z. A single ended adaptive traveling wave protection method for high resistance fault. Chin. J. Electr. Eng., 40(11):3548-3557, 2020.
[4] Wei M., Liu W., Zhang H., Shi F., Chen W. Distortion-Based Detection of High Impedance Fault in Distribution Systems. IEEE Trans. Power Deliv., 36(3):1603-1618, 2021.
[5] Xue Y.D., Li J., Chen X.S., Xu B.Y., Li T.Y. Transient line selection and transient resistance identification of high resistance grounding fault in resonant grounding system. Chin. J. Electr. Eng., 37(17):5037-5048, 2017.
[6] Wei M., Shi F., Zhang H., Jin Z., Bao H. High Impedance Arc Fault Detection Based on the Harmonic Randomness and Waveform Distortion in the Distribution System. IEEE Trans. Power Deliv., 35(2):837-850, 2020.
[7] Xiao Q.M., Guo M.F., Chen D.Y. High-Impedance Fault Detection Method Based on One-Dimensional Variational Prototyping-Encoder for Distribution Networks. IEEE Syst. J., 16:2022.
[8] Wang X., Zhang H., Shi F., Wu Q., Fang C. Location of Single Phase to Ground Faults in Distribution Networks Based on Synchronous Transients Energy Analysis. IEEE Trans. Smart Grid, 11(1):774-785, 2020.
[9] Huang J.P., Zhang Z., Wang W., Hu Z.H., Ren L., Zhang B. A local quench detection and protection method for a superconducting cable based on distributed optical fiber temperature measurement technology. Power Syst. Prot. Control, 48(14):76-84, 2020.
[10] Idarraga Ospina G., Cubillos D., Ibanez L. Analysis of arcing fault models. In: 2008 IEEE/PES Transmission and Distribution Conference and Exposition: Latin America, Bogota, Colombia, 1-5: 2008.
[11] Kizilacy M, Koch K-H. Numerical fault arc simulation based on power arc tests. Eur. Trans. Electr. Power, 4:177-185, 1994.
[12] Dong X.Y. Research on Fault Location of Microgrid Cable based on Distributed Optical Fiber Temperature Measurement. North China Electric Power University (Beijing), 2021.
[13] Ozixi M.N., translated by Yu Changming. Heat conduction. Higher Education Press, 1983.
[14] Niu H.Q., Zhou X., Wang X.B., Zhang X., Tang Y., Fan Y.B., Zhao J.L. Calculation and experiment of transient temperatures of single-core cables on jacket temperature monitoring. High Voltage Eng., 35(9):2138-2143, 2009.
Document information
Published on 26/04/24
Accepted on 24/04/24
Submitted on 25/01/24
Volume 40, Issue 2, 2024
DOI: 10.23967/j.rimni.2024.04.003
Licence: CC BY-NC-SA license
Share this document
claim authorship
Are you one of the authors of this document?

