m |
m (Zarate moved page Review 550954897841 to Hernandez-Martinez et al 2023a) |
||
| (2 intermediate revisions by one other user not shown) | |||
| Line 9: | Line 9: | ||
<div class="center" style="width: auto; margin-left: auto; margin-right: auto;"> | <div class="center" style="width: auto; margin-left: auto; margin-right: auto;"> | ||
| − | Adrián D. García–Soto. Civil and Environmental Engineering Department, Engineering Division, Universidad de Guanajuato. Av. Juárez 77, Zona Centro. Guanajuato, Gto., México. [mailto: | + | Adrián D. García–Soto. Civil and Environmental Engineering Department, Engineering Division, Universidad de Guanajuato. Av. Juárez 77, Zona Centro. Guanajuato, Gto., México. adgarcia[mailto:@ugto.mx @ugto.mx]</div> |
<div class="center" style="width: auto; margin-left: auto; margin-right: auto;"> | <div class="center" style="width: auto; margin-left: auto; margin-right: auto;"> | ||
| Line 19: | Line 19: | ||
The load effects to which bridge systems and structural elements are subjected to due to vehicular passage are estimated using live load models contained in bridge design codes. Those live load models are frequently derived for girder bridges subjected to shear forces and bending moments. However, other type of bridges, as truss bridges and others, can be subjected to other forces too, for instance axial loads and other effects. In Mexico, in past decades 3D-truss bridges based on a structural system known as “Tridilosa” were designed and built. The live load models to analyze them were widely used to design girder bridges; moreover, the traffic at the time may differ from more recent trucks and vehicles. This paper investigates the adequacy of live load models from codified design to represent load forces on the referred 3D-truss bridges, as compared to realistic Mexican traffic from WIM (weigh-in-motion) data. The results show that live load models in bridge codes are not necessarily adequate to assess forces in the existing 3D-truss (“Tridilosa”) bridges in Mexico. | The load effects to which bridge systems and structural elements are subjected to due to vehicular passage are estimated using live load models contained in bridge design codes. Those live load models are frequently derived for girder bridges subjected to shear forces and bending moments. However, other type of bridges, as truss bridges and others, can be subjected to other forces too, for instance axial loads and other effects. In Mexico, in past decades 3D-truss bridges based on a structural system known as “Tridilosa” were designed and built. The live load models to analyze them were widely used to design girder bridges; moreover, the traffic at the time may differ from more recent trucks and vehicles. This paper investigates the adequacy of live load models from codified design to represent load forces on the referred 3D-truss bridges, as compared to realistic Mexican traffic from WIM (weigh-in-motion) data. The results show that live load models in bridge codes are not necessarily adequate to assess forces in the existing 3D-truss (“Tridilosa”) bridges in Mexico. | ||
| + | |||
| + | ==Keywords== | ||
| + | |||
| + | Bridges; Live load models; Real trucks load; Structural response | ||
==Introduction== | ==Introduction== | ||
| Line 32: | Line 36: | ||
{| style="width: 100%;border-collapse: collapse;" | {| style="width: 100%;border-collapse: collapse;" | ||
|- | |- | ||
| − | | style="border: 1pt solid black;text-align: center;width: 100%;"|[[Image: | + | | style="border: 1pt solid black;text-align: center;width: 100%;"|[[Image:Review_550954897841-image1.jpeg|504px]] |
|- | |- | ||
| style="border: 1pt solid black;text-align: center;"|<span id='_Ref115077151'></span>Figure 1 Typical “Tridilosa” Bridge | | style="border: 1pt solid black;text-align: center;"|<span id='_Ref115077151'></span>Figure 1 Typical “Tridilosa” Bridge | ||
| Line 48: | Line 52: | ||
{| style="width: 100%;border-collapse: collapse;" | {| style="width: 100%;border-collapse: collapse;" | ||
|- | |- | ||
| − | | style="border: 1pt solid black;text-align: center;vertical-align: top;width: 100%;"|[[Image: | + | | style="border: 1pt solid black;text-align: center;vertical-align: top;width: 100%;"|[[Image:Review_550954897841-image2.png|360px]] |
|- | |- | ||
| style="border: 1pt solid black;text-align: center;"|<span id='_Ref115424003'></span>Figure 2 Geometry of “Tridilosa” bridges | | style="border: 1pt solid black;text-align: center;"|<span id='_Ref115424003'></span>Figure 2 Geometry of “Tridilosa” bridges | ||
| Line 59: | Line 63: | ||
{| style="width: 100%;border-collapse: collapse;" | {| style="width: 100%;border-collapse: collapse;" | ||
|- | |- | ||
| − | | style="border: 1pt solid black;text-align: center;width: 100%;"|[[Image: | + | | style="border: 1pt solid black;text-align: center;width: 100%;"|[[Image:Review_550954897841-image3.png|600px]] |
|- | |- | ||
| style="border: 1pt solid black;text-align: center;"|<span id='_Ref96347840'></span>Figure 3 Live load models used for design considered in this study | | style="border: 1pt solid black;text-align: center;"|<span id='_Ref96347840'></span>Figure 3 Live load models used for design considered in this study | ||
| Line 77: | Line 81: | ||
{| style="width: 100%;border-collapse: collapse;" | {| style="width: 100%;border-collapse: collapse;" | ||
|- | |- | ||
| − | | style="border: 1pt solid black;text-align: center;width: 100%;"|[[Image: | + | | style="border: 1pt solid black;text-align: center;width: 100%;"|[[Image:Review_550954897841-image4.png|600px]] |
|- | |- | ||
| style="border: 1pt solid black;text-align: center;"|<span id='_Ref95996975'></span>Figure 4 Histograms of GVW for WIM datasets considered | | style="border: 1pt solid black;text-align: center;"|<span id='_Ref95996975'></span>Figure 4 Histograms of GVW for WIM datasets considered | ||
| Line 97: | Line 101: | ||
{| style="width: 100%;border-collapse: collapse;" | {| style="width: 100%;border-collapse: collapse;" | ||
|- | |- | ||
| − | | style="border: 1pt solid black;vertical-align: top;width: 100%;"|[[Image: | + | | style="border: 1pt solid black;text-align: center;vertical-align: top;width: 100%;"|[[Image:Review_550954897841-image5-c.png|600px]] |
|- | |- | ||
| style="border: 1pt solid black;text-align: center;vertical-align: top;"|Figure 5 Results for bottom diagonals for 9 m long “Tridilosa” bridge | | style="border: 1pt solid black;text-align: center;vertical-align: top;"|Figure 5 Results for bottom diagonals for 9 m long “Tridilosa” bridge | ||
| Line 107: | Line 111: | ||
{| style="width: 100%;border-collapse: collapse;" | {| style="width: 100%;border-collapse: collapse;" | ||
|- | |- | ||
| − | | style="border: 1pt solid black;vertical-align: top;width: 100%;"|[[Image: | + | | style="border: 1pt solid black;text-align: center;vertical-align: top;width: 100%;"|[[Image:Review_550954897841-image6-c.png|600px]] |
|- | |- | ||
| style="border: 1pt solid black;text-align: center;vertical-align: top;"|Figure 6 Results for bottom diagonals for 18 m long “Tridilosa” bridge | | style="border: 1pt solid black;text-align: center;vertical-align: top;"|Figure 6 Results for bottom diagonals for 18 m long “Tridilosa” bridge | ||
Latest revision as of 11:13, 18 December 2023
The load effects to which bridge systems and structural elements are subjected to due to vehicular passage are estimated using live load models contained in bridge design codes. Those live load models are frequently derived for girder bridges subjected to shear forces and bending moments. However, other type of bridges, as truss bridges and others, can be subjected to other forces too, for instance axial loads and other effects. In Mexico, in past decades 3D-truss bridges based on a structural system known as “Tridilosa” were designed and built. The live load models to analyze them were widely used to design girder bridges; moreover, the traffic at the time may differ from more recent trucks and vehicles. This paper investigates the adequacy of live load models from codified design to represent load forces on the referred 3D-truss bridges, as compared to realistic Mexican traffic from WIM (weigh-in-motion) data. The results show that live load models in bridge codes are not necessarily adequate to assess forces in the existing 3D-truss (“Tridilosa”) bridges in Mexico.
Keywords
Bridges; Live load models; Real trucks load; Structural response
Introduction
Highway bridges are a key part of the infrastructure for a country. Several structural systems can be employed to design and build highway bridges, for instance steel truss bridges, usually used to span medium and long distances.
The chords, vertical and diagonal elements of a truss bridge are considered to be subjected to axial loads, which an important difference with respect to the more common girder bridges, implying that research should be carried out to further advance our knowledge on these kinds of structures. Past and current studies on bridges cover a wide range of subjects as damage identification (Farhey, et al., 1997), (Chang & Kim, 2016), health monitoring (Catbas, et al., 2008), experimental research (Bakht & Jaeger, 1990), (Aktan, et al., 1994), (Azizinamini, 2002), (Häggström, et al., 2014), (Täljsten, et al., 2018), fatigue (Lee, 1996), (Wang, et al., 2007), (Mulyadi & Suangga, 2020), cracking (Wang, et al., 2017), and repairing schemes among many others.
Truss bridges have also collapsed, as reported in the literature, either due to truck collision (Stark, et al., 2016), inadequate design (Hao, 2010) or other reasons. There is also evidence that girder bridges and truss bridges behave in a different way in terms of the dynamic response due to vehicular passage (Parida & Talukdar, 2020).
Therefore, truss bridges subjected to live loads should be investigated, especially when considering a type of existing bridges in Mexico built at the end of the 1970s and the beginning of the 1980s, when a bridge typology named “Tridilosa” (concrete slabs supported by three-dimensional trusses) arose and was frequently used. “Tridilosa” bridges basically consists of two parts: (1) a three-dimensional (3D) steel truss, and (2) a reinforced concrete slab supported by the 3D-truss. A typical “Tridilosa” bridge is shown in Figure 1. Severe fatigue problems have been found in existing “Tridilosa” bridges; they have oft been replaced by most common structural systems (girder bridges of prestressed concrete). Some “Tridilosa” bridges are still operational though (Figure 1). The fact that girder bridges have shown to be more effective in withstanding fatigue demands than “Tridilosa” bridges, justifies the assessment of live load on these kinds of structures, either by truck models in design codes or by real traffic, which is carried out in the present study.
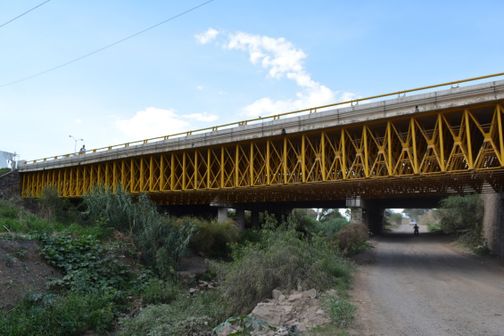
|
| Figure 1 Typical “Tridilosa” Bridge |
Note also that live load models, employed to compute load effects, may not be necessarily adequate to compute axial loads in truss bridge elements, especially the ones caused under realistic truck loads.
The main objective of the present study is to compare forces in elements of “Tridilosa” bridges caused by live load models in design codes versus those caused by realistic truck loading aimed at investigating the adequacy of such models to evaluate existing 3D-truss bridges in Mexico. To achieve the main objective, the loads caused by trucks on the considered “Tridilosa” are computed based on WIM (weigh-in-motion) data obtained on highways in Guanajuato, Mexico; for the comparisons, load models used for codified design in Mexico (IMT/SCT (Instituto Mexicano del Transporte/Secretaria de Comunicaciones y Transportes), 1999), (IMT/SCT (Instituto Mexicano del Transporte/Secretaría de Comunicaciones y Transportes), 2004), the US (AASHTO, 2017) and Canada (CAN/CSA, 2014) are also considered.
“Tridilosa” bridges considered
A couple of “Tridilosa” bridges with span lengths of 9 m and 18 m are considered and schematically shown in Figure 2. As mentioned above, these two bridges are to be subjected to realistic truck loading and live load models to inspect the ability (or inability) of code models to capture axial forces in the truss elements of the “Tridilosa” bridges. To discuss possible implications on fatigue issues for these kinds of 3D-truss bridges is also included in this study.
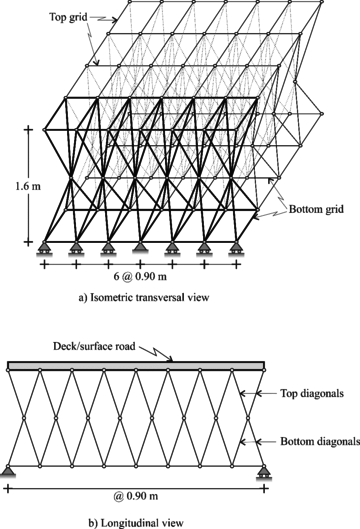
|
| Figure 2 Geometry of “Tridilosa” bridges |
Code live load models
Desing truck models used by Mexican designers as the T3-S3 (Figure 3a) and T3-S2-R4 (Figure 3b) are considered (IMT/SCT (Instituto Mexicano del Transporte/Secretaria de Comunicaciones y Transportes), 1999) because they were used to analyze “Tridilosa” bridges; these two models correspond to real truck in Mexican highways. Other considered model is the IMT 66.5 (Figure 3c), that is based on truck surveys recorded in the 1990s in Mexican highways (IMT/SCT (Instituto Mexicano del Transporte/Secretaría de Comunicaciones y Transportes), 2004). Additionally, the HL-93 model (Figure 4d) from the American standards (AASHTO, 2017) is used, as well as the CL-925 (Figure 4e) model from the Canadian standards (CAN/CSA, 2014).
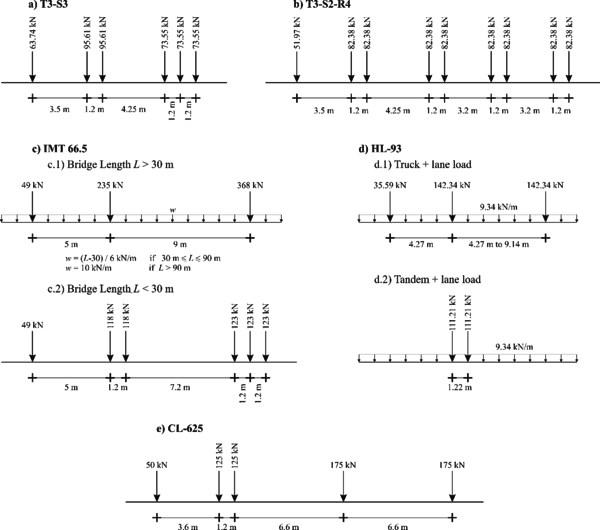
|
| Figure 3 Live load models used for design considered in this study |
Since the previous models correspond in some cases to different traffic environments and are aimed at designing bridges form different countries, a performance comparison is not pursued. Rather, the ability of the models to adequately capture the general trend of the axial forces in the considered 3D-truss bridges is of interest. In other words, considering that load and resistance factors are excluded from the analysis for the scope of this study, it is not expected that the code live load models cause comparable axial forces in truss elements as those caused by real trucks, but it would be expected that a code live load model would cause uniform ratios of real axial loads to nominal axial loads for all truss bridge elements across different spans and other characteristics. Such uniformity is desirable, because the live load model would only need a proper calibration of load and resistance factors to achieve comparable safety levels for all truss bridge elements (e.g., the elements of a “Tridilosa” bridge) across different span lengths. The opposite would occur if the ratio between realistic axial loads and code axial loads are obtained, i.e., the live load model would not be able to provide designed chords, vertical and diagonal truss elements with approximately the same reliability level. It is considered that other perspective to face this issue is to inspect the number of times that axial loads generated by trucks in a WIM database surpass the threshold (maximum value of axial load) generated for each of the live load models in Figure 3 for a given bridge. It is also expected that if this number of exceedance times (to be discussed later) stays approximately constant for all truss bridge elements, the live load model would be adequate to design the truss elements (the “Tridilosa” elements for the scope of this study) for roughly the same safety level. This latter approach is investigated in the present study.
WIM data used
WIM data are used to run the recorded vehicles over the “Tridilosa” bridges and compute the axial loads in the truss elements. General information of one of the sets of data (IP-2009 for brevity hereinafter) is reported somewhere else (García-Soto, et al., 2015), (García–Soto, et al., 2020); as a brief summary, the data set was obtained in 2009 for a four-lane highway between Irapuato City and La Piedad City (45 federal highway crossing Guanajuato in central Mexico) and contains 3,834,961 recorded vehicles. Figure 4a shows the histogram of Gross Vehicular Weight (GVW) for the whole set of vehicles; Figure 5b also shows a histogram of GVW, but for vehicles with GVW > P90(GVW), i.e., the histogram of only the 10% heaviest vehicles in the dataset.
Other dataset (IP-2017 hereinafter) was obtained in the same previously referred highway, but only for the week from January 24th to January 30th in 2017; it contains 226,488 recorded vehicles. In Figure 4c histograms of GVW for the whole set of data is shown. Analogously, Figure 4d shows the histogram for GVW > P90(GVW).
The last dataset (GS-2017 hereinafter) was obtained in a two-lane road between the City of Guanajuato and the City of Silao (also in Guanajuato State, 110 federal road) for the week from January 16th to January 22nd in 2017; it contains 127,218 recorded vehicles. Figures 4e and 4f shows histograms of GVW as before. In the 110 federal road only lighter trucks are allowed, as can be inferred from Figures 4e and 4f.
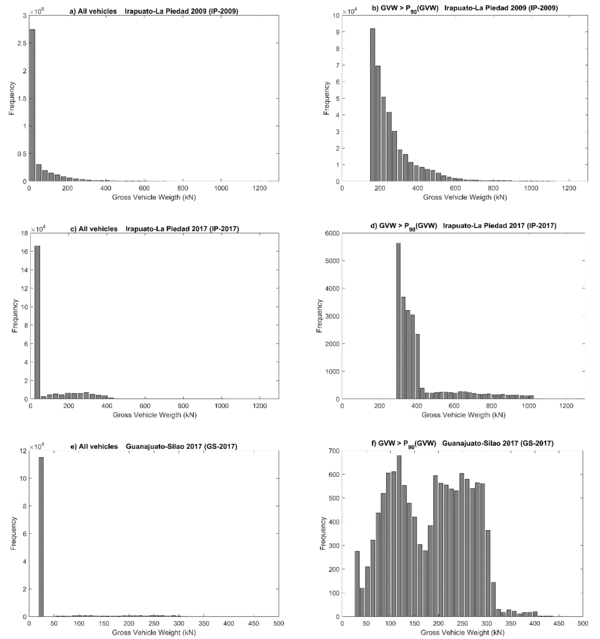
|
| Figure 4 Histograms of GVW for WIM datasets considered |
Note that vehicles with a zero force in any axle or other cases considered as errors in data acquisition are excluded.
Software used to carry out the analyses
All analyses were carried out with the software AMER 2.0 (Hernández–Martínez, 2019). It was used to investigate shear forces and bending moments in bridges with continuous spans (García–Soto, et al., 2020). To carry out the analyses, every vehicle is run along the “Tridilosa” bridges at 10 cm increments; this is carried out in both directions, since this leads to different maximum load effects (in different positions). The AMER 2.0 is especially efficient for analyzing moving loads over any type of bridge in a very reasonable time. The considered “Tridilosa” bridges are modeled with pinned connections; beams elements are considered to transfer the vehicle loads to the truss nodes (the top chord), as per (O'Connel & Dexter, 2001).
Resulting axial loads on “Tridilosa” bridges
Preferably, a live load model for codified design should adequately assess axial load ratios, i.e., the ratio between axial loads from real trucks and those caused by the live load model for all truss bridge elements (e.g., bottom diagonal elements). Since unfactored live load models are used, it is expected that the assessed axial loads caused by code live load models are exceeded by the axial loads generated from real trucks (the maximum ones). Nonetheless, we consider that the number of times in which assessed axial loads from a code live load model is exceeded by actual traffic should be approximately the same in all the truss bridge elements, if the elements are to have relatively the same safety level. While undergoing projects being carried out by the authors show that this can be the case of chord elements in common truss bridges, this is not the case for the diagonals of the “Tridilosa” bridges as will be shown.
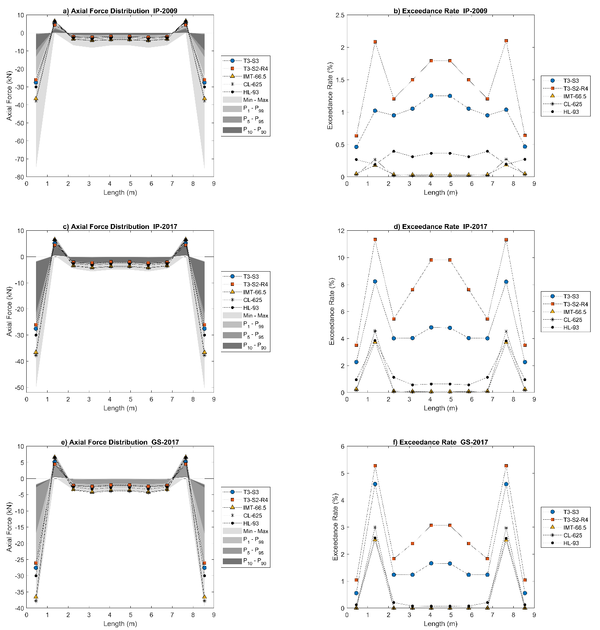
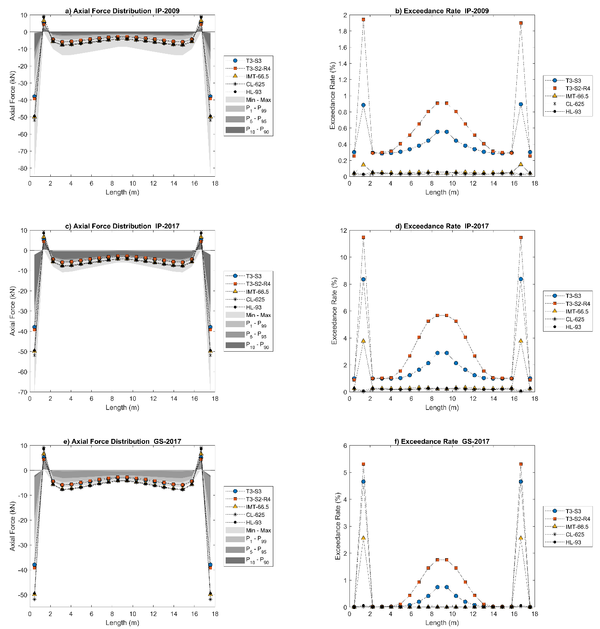
The results for the 9 m and 18 m long “Tridilosa” bridges are shown in Figures 5 and 6. The left side of Figures 5 and 6 shows the axial loads acting on bottom diagonals along the “Tridilosa” bridge for the IP-2009 (Figures 5a and 6a), the IP-2017 (Figures 5c and 6c) and the GS-2017 (Figures 5e and 6e) datasets.
|
| Figure 5 Results for bottom diagonals for 9 m long “Tridilosa” bridge |
Compression and tension forces are considered negative and positive, respectively, as an adopted convention. A scale of gray colors represents the axial load distribution acting on every element along the bridge for each considered dataset; the lighter gray (15% of gray intensity) represents the range in which the minimum and the maximum values of acting axial loads on elements (bottom diagonals) along the “Tridilosa” bridge are found. The lower and the upper limits of gray at 25% intensity represent the 1% and the 99% of the largest axial loads, (denoted as P1 and P99, respectively; convention that is followed for other percentages). Likewise, the lower and the upper limits of gray at 40% intensity represent the P5 and the P95 axial load value distribution. P10 and P90 axial load value distribution correspond to the lower and the upper limits of the darkest gray (65% of gray intensity). This shows the fact a very small number of very heavy trucks causes the largest forces in bottom diagonals of the “Tridilosa” bridges in Figures 5 and 6; this may be expected, but the gay scales allow to see it at a glance. The axial loads generated by every live load model described before are shown with lines with markers. All presented results are unfactored. It is pointed out once more that the study is not intended to show which model is better to estimate the axial loads from the WIM data. The use of design live load models is aimed at investigating if they approximately lead to uniform exceedance rates (for axial loads) in all the “Tridilosa” elements.
|
| Figure 6 Results for bottom diagonals for 18 m long “Tridilosa” bridge |
The right sides of Figures 5 and 6 shows the number of times (in terms of percentage) that axial loads caused by the vehicles in a given dataset exceed the axial load value generated by each of the selected live load models; these exceedance rates are shown for the bottom diagonals of the “Tridilosa” bridges along the bridge span; Figures 5b and 6b for the IP-2009, Figures 5d and 6d for the IP-2017 and Figures 5f and 6f for the GS-2017 datasets. As observed in the right sides of Figures 5 and 6, the exceedance rates are no uniform along the bridge, especially at the extremes; this does not occur for any of the code live load models, either containing a uniformly distributed load or not. Overall, Figures 5 and 6 shows that live load models from codes do not capture the exceedance rates in axial loads for the bottom diagonals of the “Tridilosa” bridges, except by some cases in the central part of the bridges. This may lead to reliability levels that are not uniform for all “Tridilosa” bridge elements (García-Soto, et al., 2015), (García–Soto, et al., 2020), which deserves further research; they also may in part explain the unsuccessful performance of these kind of structures. Live load models developed expressively for evaluating exiting “Tridilosa” truss bridges (or even designing new ones) could be desirable; this has been stated for the case of bridges with continuous spans (García–Soto, et al., 2020).
Figures 5 and 6 also show that for the “Tridilosa” bridges, spans of 9 m and 18 m, respectively, the bottom diagonals next to those connected at the supports (i.e., the second and the penultimate diagonal elements) exhibit the highest exceedance rates for all databases. It should also be noted that highest exceedance rates are not directly related to GVW. This may occur since vehicles in IP-2017 and GS-2017 databases have higher loads per axle, although the GVW is not necessarily heavier. In addition, it should be considered that heavier and longer vehicles do not necessarily fit entirely on these bridges. Other aspects to be highlighted are that it becomes evident that different live load models (and/or live load factors) should be prescribed for highways with different traffic characteristics (since roads allowing lighter traffic lead to lesser demands), and that because live load models from codes are calibrated mainly for load effects on girder bridges (shear force and bending moment), it could be desirable to develop models based on truss bridges able to capture axial loads rather than other load effects. The findings apply to “Tridilosa” bridges of different span lengths, as shown in Figures 5 and 6, for 9 m and 18 m length “Tridilosa” bridges, respectively.
It is also noted that since the fatigue limit states included in design codes depends on the stress range generated by live load models, the findings in this study are also considered relevant for such case and is to be investigated in further research.
Conclusions
WIM (weigh-in-motion) data are used to compute maximum axial loads in existing three-dimensional truss bridges known as “Tridilosa” bridges in Mexico. The axial loads are compared against the maximum axial load generated for given design models (truck of live load models for codified design). These values are used as threshold axial loads in every truss element, to inspect how many times the threshold is exceeded by axial loads of the real traffic (exceedance rates) from any of the considered WIM databases (three). Each vehicle from the WIM data and each live load model is run over the bridge in 10 cm increments and both directions, and the maximum axial loads are extracted. This is performed with the aid of a software that is very efficient to analyze moving loads over bridges.
It is found that truck models used for bridge design may not be adequate to estimating axial loads in “Tridilosa” bridge elements, because the exceedance rates, i.e., percentage of surpassed axial loads generated by WIM traffic with respect to a threshold given by a live load model, in “Tridilosa” bridges can be very irregular for some structural elements (e.g., the bottom diagonals), especially at the extremes. This occurs for all live load models and WIM datasets considered and for both “Tridilosa” spans of 9 m and 18 m length. The fact that exceedance rates are not uniform may imply an inadequate estimation of relatively constant axial loads in all “Tridilosa” truss elements. It is considered that these non-uniform exceedance rates may imply non-uniform safety levels either, which is to be investigated in future studies.
Computing every “Tridilosa” element axial load using existing live load models for may not be the best option to achieve uniform safety levels. It is desirable to inspect whether other design models could be developed to specifically cope with axial loads in “Tridilosa” (or other) truss bridges, so that more uniform exceedance rates are obtained.
The findings of this study may also imply that other limit states for “Tridilosa” bridges should be investigated, since axial load demands are related to the load range generated by live load models in some codes.
Acknowledgements
The financial support from CONAHCyT (Mexican National Agency of Humanities, Science and Technology); “Problemas Nacionales” 2014 Project 248162) is gratefully acknowledged.
Referencias
AASHTO, 2017. AASHTO Bridge Design Specifications. 8th ed. Washington(DC): American Association of State Highway and Transportation Officials.
Aktan, A. E., Lee, K. L., Naghavi, R. & Hebbar, K., 1994. Destructive testing of two 80-year-old truss bridges. Transp. Res. Rec., 1(1460), pp. 62-72.
Azizinamini, A., 2002. Full scale testing of old steel truss bridge. J. Constr. Steel Res., 58(5-8), pp. 843-858.
Bakht, B. & Jaeger, L., 1990. Bridge testing - A surprise every time. J. Struct. Eng., 116(5), pp. 1370-1383.
CAN/CSA, 2014. Canadian Highway Bridge Design Code. CAN/CSA-S6-14 ed. Mississauga(Ontario): s.n.
Catbas, F. N., Susoy, M. & Frangopol, D. M., 2008. Structural health monitoring and reliability estimation: Long span truss bridge application with environmental monitoring data. Eng. Struc., 30(9), pp. 2347-2359.
Chang, K. C. & Kim, C. W., 2016. Modal-parameter identification and vibration-based damage detection of a damage steel truss bridge. Eng. Struct., 122(1), pp. 156-173.
Farhey, D. N. et al., 1997. Structural deterioration assessment for steel bridges. J. Bridge Eng., 2(3), pp. 116-124.
García-Soto, A. D., Hernández-Martínez, A. & Valdés-Vázquez, J. G., 2015. Probabilistic assessment of a design truck model and live load factor from weigh-in-motion data for Mexican highway bridge design. Canadian Journal of Civil Engineering, 24(11).
García–Soto, A. D., Hernández–Martínez, A. & Valdés–Vázquez, J. G., 2020. Probabilistic assessment of live load effects on continuous span bridges with regular and irregular configurations and its design implications. Canadian Journal of Civil Engineering, 47(4).
Häggström, J., Collin, P., Blanksvärd, T. & Täljsten, B., 2014. Assessment and full scale failure test of a steel truss bridge. 37th IABSE Madrid Symposium Report, 102(1), pp. 2757-2764.
Hao, S., 2010. I-35W bridge collapse. J. Bridge Eng., 15(5).
Hernández–Martínez, A., 2019. Análisis Matricial de Estructural Reticulares. http://www.di.ugto.mx/GEMEC.
IMT/SCT (Instituto Mexicano del Transporte/Secretaria de Comunicaciones y Transportes), 1999. Modelo de cargas vivas vehiculares para el diseño estructural de puentes. Querétaro, México: IMT/SCT.
IMT/SCT (Instituto Mexicano del Transporte/Secretaría de Comunicaciones y Transportes), 2004. Formulación de la norma SCT de cargas vehiculares para el diseño estructural de puentes carreteros. Querétaro, México: IMT/SCT.
Lee, S. B., 1996. Fatigue failure of welded vertical members of a steel truss bridge. Eng. Fail. Anal., 3(2), pp. 103-108.
Mulyadi, E. & Suangga, M., 2020. WIM data analysis for the fatigue lifetime evaluation of standard steel truss bridge elements. IOP Conf. Ser.: Mater. Sci. Eng. 1007 012155.
O'Connel, H. M. & Dexter, R. J., 2001. Response and analysis of steel trusses for fatigue truck loading. J. Bridge Eng., 6(6), pp. 628-638.
Parida, S. & Talukdar, S., 2020. An insight to the dynamic amplification factor for steel truss girder bridge. Int. J. Steel Struct., Volume 20, pp. 1341-1354.
Stark, T. D. et al., 2016. I-5 Sakagit River Bridge Collapse Review. J. Perform Constr. Fail., 30(6).
Täljsten, B. et al., 2018. Bridges tested to failure in Sweden. IABSE Conference Copenhagen.
Wang, C. S. et al., 2007. Fatigue and fracture evaluation of a 70-year-old steel bridge. Key Eng. Mater., Volume 347, pp. 359-364.
Wang, Q., Nakamura, S., Okumatsu, T. & Nishikawa, T., 2017. Comprehensive investigation on the cause of a critical crack found in a diagonal member of a steel truss bridge. Eng. Struct., 132(1), pp. 659-670.
Document information
Published on 18/12/23
Submitted on 04/12/23
Volume 7, 2023
Licence: CC BY-NC-SA license
Share this document
Keywords
claim authorship
Are you one of the authors of this document?