(Created page with "<!-- metadata commented in wiki content <span id='_Hlk142401408'></span><span id='OLE_LINK10'></span><span id='OLE_LINK9'></span><big>'''Seismic Response Characteristics of...") |
|||
| Line 27: | Line 27: | ||
The seismic wave is reflected and refracted at the slope and the portal as it propagates from bottom to top, resulting in the increased dynamic response of the portal section. On the other hand, the tunnel portal section is the exposed part, which has relatively poor geological conditions. Therefore, tunnel portal is the weak section in the seismic strengthening of the whole tunnel <sup>[4, 5]</sup>, especially when passing through unfavorable geological conditions such as layered surrounding rock, the seismic damage suffered is more severe<sup>[6, 7]</sup>. | The seismic wave is reflected and refracted at the slope and the portal as it propagates from bottom to top, resulting in the increased dynamic response of the portal section. On the other hand, the tunnel portal section is the exposed part, which has relatively poor geological conditions. Therefore, tunnel portal is the weak section in the seismic strengthening of the whole tunnel <sup>[4, 5]</sup>, especially when passing through unfavorable geological conditions such as layered surrounding rock, the seismic damage suffered is more severe<sup>[6, 7]</sup>. | ||
| − | Currently, research on seismic issues at the tunnel entrance mainly focuses on the seismic damage factors <sup>[8]</sup>, seismic damage characteristics <sup>[1, 9, 10]</sup>, and seismic response laws <sup>[11 | + | Currently, research on seismic issues at the tunnel entrance mainly focuses on the seismic damage factors <sup>[8]</sup>, seismic damage characteristics <sup>[1, 9, 10]</sup>, and seismic response laws <sup>[11, 12]</sup> of tunnels passing through fault fracture zones or terrain bias pressure tunnels. The main methods used include prototype observation, experimental research, theoretical analysis, and numerical analysis. (1) The prototype observation method, which focuses on studying real earthquake disaster cases, analyses the failure characteristics of tunnels and the measured seismic dynamic characteristics to conduct research on earthquake response. Cui et al (2011) <sup>[13] </sup>conducted statistical analysis on the types of earthquake damage to highway tunnels in the Wenchuan earthquake area, and pointed out six factors that affect tunnel earthquake damage; (2) The test research method is to conduct simulation tests according to the seismic characteristics, and obtain the structural dynamic response characteristic data by manually controlling the seismic wave input mechanism, boundary conditions, etc., so as to analyse the tunnel seismic response from different angles and purposes. For example, Cao et al (2023) <sup>[14]</sup> and Liu et al (2022) <sup>[15]</sup> studied the displacement and stress distribution characteristics of tunnel lining under different propagation and vibration angles of SV wave. Zhao et al (2022) <sup>[16]</sup> and Shen et al (2020) <sup>[17]</sup> validated the seismic performance of tunnels crossing inactive faults through large-scale shake table tests. Xu et al (2016) <sup>[18] </sup>used shaking table tests to study the seismic response of the mountain tunnel entrance section, compared the seismic performance of different reinforcement measures, and proposed the seismic reinforcement range value of the mountain tunnel entrance section; (3) The theoretical analysis method, which is mainly based on vibration theory and wave theory, has extended various analysis methods by combining specific underground structures and rock and soil properties. However, it can be broadly classified into the quasi-static method <sup>[19, 20]</sup>, the interaction method<sup>[21]</sup> and the wave dynamic analysis method; (4) Numerical methods are often limited in both model experiments and theoretical methods when the geological and topographical conditions of tunnels are complex. Therefore, numerical methods are increasingly used to analyse seismic problems in tunnels, often using the finite element method (FEM) <sup>[22]</sup>, finite difference method (FDM) <sup>[23]</sup>, boundary element method (BEM) <sup>[24]</sup>, finite element method and mixed finite element method <sup>[25]</sup>. |
Asymmetrical loading is very common at the entrance of mountain tunnels. Due to the poor quality of the surrounding rock, the asymmetric loading at the portal sections is usually due to the terrain. In some cases, however, the asymmetric loading comes from both the terrain and the geology. Undoubtedly, due to the combined effects of terrain and geology, the mechanical behavior of this type of asymmetrically loaded tunnel is more complex. It is therefore necessary to investigate the mechanical behavior of such portals under seismic action. Taken a tunnel portal subjected to topographical and geological asymmetric loading as an example, this paper presents a study on the issues mentioned above. A three-dimensional numerical simulation was conducted to investigate the seismic response characteristics under earthquake action, which can provide a reference for the design of mountain tunnels subjected to topographical and geological asymmetric loading. | Asymmetrical loading is very common at the entrance of mountain tunnels. Due to the poor quality of the surrounding rock, the asymmetric loading at the portal sections is usually due to the terrain. In some cases, however, the asymmetric loading comes from both the terrain and the geology. Undoubtedly, due to the combined effects of terrain and geology, the mechanical behavior of this type of asymmetrically loaded tunnel is more complex. It is therefore necessary to investigate the mechanical behavior of such portals under seismic action. Taken a tunnel portal subjected to topographical and geological asymmetric loading as an example, this paper presents a study on the issues mentioned above. A three-dimensional numerical simulation was conducted to investigate the seismic response characteristics under earthquake action, which can provide a reference for the design of mountain tunnels subjected to topographical and geological asymmetric loading. | ||
| Line 155: | Line 155: | ||
[[Image:Draft_Peng_770507870-image7.png|600px]] </div> | [[Image:Draft_Peng_770507870-image7.png|600px]] </div> | ||
| − | Fig. 6 Layout of monitoring points (unit: m) | + | '''Fig. 6 Layout of monitoring points (unit: m)''' |
===4.2 Displacement characteristics of the lining during earthquake=== | ===4.2 Displacement characteristics of the lining during earthquake=== | ||
| Line 176: | Line 176: | ||
</div> | </div> | ||
| − | + | '''Fig. 7 Horizontal displacement of the tunnel portal''' | |
It is also necessary to investigate the peak displacement of the monitoring points at each section of the tunnel entrance. Fig. 8 shows the peak horizontal displacement of the monitoring points at the tunnel entrances under different tunnel depths. Fig. 8a shows the time when the peak displacement is reached at different sections. It can be seen from the figure that the time when the peak displacement is reached at the tunnel entrance is approximately the same, but the time when the peak displacement is reached at different sections is different. For example, the fluctuation of the time when peak displacement is reached at sections 1-3 remains between 9.5 s and 9.86 s, while the time when peak displacement is reached at sections 4-6 remains unchanged at 4.72 s. Fig. 8b shows the maximum deformation generated by the monitoring points at different tunnel entrance cross-sections under seismic action. It is seen that as the depth of the tunnel increases, the peak displacement that can be achieved at the tunnel entrance decreases and the magnitude of the decrease gradually decreases. This is because the constraints at the tunnel entrance are stronger than those at the tunnel exit, and the rock masses constrain each other under the influence of seismic motion, resulting in a relatively small displacement. | It is also necessary to investigate the peak displacement of the monitoring points at each section of the tunnel entrance. Fig. 8 shows the peak horizontal displacement of the monitoring points at the tunnel entrances under different tunnel depths. Fig. 8a shows the time when the peak displacement is reached at different sections. It can be seen from the figure that the time when the peak displacement is reached at the tunnel entrance is approximately the same, but the time when the peak displacement is reached at different sections is different. For example, the fluctuation of the time when peak displacement is reached at sections 1-3 remains between 9.5 s and 9.86 s, while the time when peak displacement is reached at sections 4-6 remains unchanged at 4.72 s. Fig. 8b shows the maximum deformation generated by the monitoring points at different tunnel entrance cross-sections under seismic action. It is seen that as the depth of the tunnel increases, the peak displacement that can be achieved at the tunnel entrance decreases and the magnitude of the decrease gradually decreases. This is because the constraints at the tunnel entrance are stronger than those at the tunnel exit, and the rock masses constrain each other under the influence of seismic motion, resulting in a relatively small displacement. | ||
| Line 189: | Line 189: | ||
</div> | </div> | ||
| − | + | '''Fig. 8 Peak horizontal displacement at monitoring points''' | |
===4.2 Slope displacement=== | ===4.2 Slope displacement=== | ||
| Line 226: | Line 226: | ||
|} | |} | ||
| − | + | '''Fig. 10 Peak horizontal displacement at monitoring points''' | |
The above analysis of the horizontal displacement characteristics indicates that the tunnel body is less prone to significant deformation compared to the entrance due to the strengthening of the surrounding rock constraints. In addition, for tunnels with poor terrain and geological conditions, the damage to the tunnel slope is no less than that to the entrance and more attention should be paid to the seismic and seismic measures of the tunnel slope. | The above analysis of the horizontal displacement characteristics indicates that the tunnel body is less prone to significant deformation compared to the entrance due to the strengthening of the surrounding rock constraints. In addition, for tunnels with poor terrain and geological conditions, the damage to the tunnel slope is no less than that to the entrance and more attention should be paid to the seismic and seismic measures of the tunnel slope. | ||
Revision as of 16:07, 23 August 2023
Abstract: The tunnel portal is the most seismically vulnerable section of the tunnel against earthquakes. Due to the combined effects of topographic and geological asymmetric loading, the mechanical characteristics of this type of portal are very complex. In this study, a three-dimensional numerical model was developed and calculated to investigate the seismic response characteristics of a tunnel portal subjected to topographic and geological asymmetric loading. The results show that the seismic weakness of the tunnel support structure is located at the tunnel arch shoulders and sidewalls; the time to reach the peak displacement around the tunnel is slightly delayed compared to the slope, and the time to reach the peak displacement shows a phased pattern. Compared to the tunnel structure, the slopes are more prone to landslides and other disasters due to terrain and geological factors under earthquake action. Therefore, more attention should be paid to the seismic and anti-seismic design of tunnel slopes.
Keywords: Tunnel portal; Topographical and geological asymmetric loading; Seismic response; Numerical simulation
1. Introduction
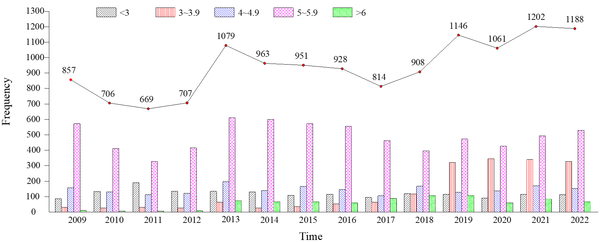
According to statistics from the China Earthquake Data Center, a total of 13179 earthquakes occurred worldwide from 2009 to 2022 (as shown in Fig. 1). With frequent earthquakes and higher magnitude earthquakes (in the red and green areas), many structures have been damaged. In the past, it was widely believed that the seismic performance of tunnels was better than that of above-ground structures because the surrounding rock limited the displacement of the structure. However, in recent years, many tunnel structures have been damaged in several earthquakes. Such as the Chi Chi earthquake [1] and the Wenchuan earthquake in China [2, 3], the nearby tunnels have suffered serious seismic damage, such as lining cracks, tunnel arching and tunnel collapse.
Fig. 1 Earthquake statistics from 2009 to 2022.
The seismic wave is reflected and refracted at the slope and the portal as it propagates from bottom to top, resulting in the increased dynamic response of the portal section. On the other hand, the tunnel portal section is the exposed part, which has relatively poor geological conditions. Therefore, tunnel portal is the weak section in the seismic strengthening of the whole tunnel [4, 5], especially when passing through unfavorable geological conditions such as layered surrounding rock, the seismic damage suffered is more severe[6, 7].
Currently, research on seismic issues at the tunnel entrance mainly focuses on the seismic damage factors [8], seismic damage characteristics [1, 9, 10], and seismic response laws [11, 12] of tunnels passing through fault fracture zones or terrain bias pressure tunnels. The main methods used include prototype observation, experimental research, theoretical analysis, and numerical analysis. (1) The prototype observation method, which focuses on studying real earthquake disaster cases, analyses the failure characteristics of tunnels and the measured seismic dynamic characteristics to conduct research on earthquake response. Cui et al (2011) [13] conducted statistical analysis on the types of earthquake damage to highway tunnels in the Wenchuan earthquake area, and pointed out six factors that affect tunnel earthquake damage; (2) The test research method is to conduct simulation tests according to the seismic characteristics, and obtain the structural dynamic response characteristic data by manually controlling the seismic wave input mechanism, boundary conditions, etc., so as to analyse the tunnel seismic response from different angles and purposes. For example, Cao et al (2023) [14] and Liu et al (2022) [15] studied the displacement and stress distribution characteristics of tunnel lining under different propagation and vibration angles of SV wave. Zhao et al (2022) [16] and Shen et al (2020) [17] validated the seismic performance of tunnels crossing inactive faults through large-scale shake table tests. Xu et al (2016) [18] used shaking table tests to study the seismic response of the mountain tunnel entrance section, compared the seismic performance of different reinforcement measures, and proposed the seismic reinforcement range value of the mountain tunnel entrance section; (3) The theoretical analysis method, which is mainly based on vibration theory and wave theory, has extended various analysis methods by combining specific underground structures and rock and soil properties. However, it can be broadly classified into the quasi-static method [19, 20], the interaction method[21] and the wave dynamic analysis method; (4) Numerical methods are often limited in both model experiments and theoretical methods when the geological and topographical conditions of tunnels are complex. Therefore, numerical methods are increasingly used to analyse seismic problems in tunnels, often using the finite element method (FEM) [22], finite difference method (FDM) [23], boundary element method (BEM) [24], finite element method and mixed finite element method [25].
Asymmetrical loading is very common at the entrance of mountain tunnels. Due to the poor quality of the surrounding rock, the asymmetric loading at the portal sections is usually due to the terrain. In some cases, however, the asymmetric loading comes from both the terrain and the geology. Undoubtedly, due to the combined effects of terrain and geology, the mechanical behavior of this type of asymmetrically loaded tunnel is more complex. It is therefore necessary to investigate the mechanical behavior of such portals under seismic action. Taken a tunnel portal subjected to topographical and geological asymmetric loading as an example, this paper presents a study on the issues mentioned above. A three-dimensional numerical simulation was conducted to investigate the seismic response characteristics under earthquake action, which can provide a reference for the design of mountain tunnels subjected to topographical and geological asymmetric loading.
2. Project overview
2.1 Topographic and geological conditions
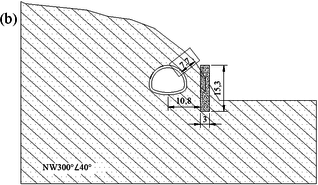
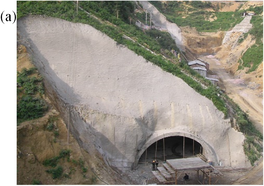
The left tunnel entrance of a highway tunnel was selected for the case study. As shown in Fig. 2, the tunnel portal passed through a slope with an angle of 45°. The buried depth is about 30.0 m and the side covering depth is only about 7.7 m. This asymmetrical topography results in a high asymmetrical loading on the left tunnel portal. Moreover, it is also subjected to asymmetrical loading caused by geological factors. The geological survey results show that in addition to the fourth residual slope accumulation soil with a thickness of about 0 - 2.6 m on the surface layer, the bedrock of the entrance section is mainly composed of moderately thick residual sandstone. The dip of the bedrock layer is /NW300°∠30-45°, and the angle of intersection between the strike of the bedrock layer and the route is very small. There are obvious weak interbeds between the strata. Once the tunnel is excavated, the surrounding rock will move along the weak interlayer, resulting in severe asymmetrical loading on the tunnel.
|
Fig. 2 Topographic and geological characteristics of the left tunnel portal: (a) the topographic characteristics; (b) characteristics of layered rock mass (unit: m).
2.2 Tunnel support and construction methods
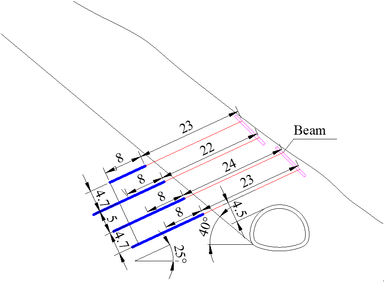
In view of the high asymmetrically loading at the left tunnel portal, the following corresponding reinforcement measures were taken: (1) Due to the small thickness of the lateral covering depth, the shallowly buried side cannot provide sufficient counter pressure. Therefore, 6 anti-slide piles were installed on the outside of the tunnel to increase the resistance of the outer rock mass and limit the deformation of the tunnel structure. The top of the anti-slide pile is flush with the tunnel excavation contour line, and the distance between the anti-slide pile and the tunnel axis is 10.8 m, with a length, width, and height of 3.0 m, 3.0 m, and 15.3 m, respectively. (2) Considering the sliding force generated along the strata after tunnel excavation, anchor cables are used to support the slope and reduce the load caused by the bedding rock mass. The design of the anchor cable is mainly based on its own resistance to resist the sliding force of the sliding body. Based on the sliding force characteristics, the final anchor cable layout is determined as shown in Fig. 3. The tensile force of each bundle of anchor cables is 100 t, and the longitudinal spacing of the anchor cables is 5.0 meters, with an average tensile force of 80 t per meter of anchor cable.
Fig. 3 Layout of the anchor cables (unit: m)
The composite lining was installed as the tunnel structure. A fully enclosed structure with a concrete thickness of 27 cm and a steel frame of I20b beams spaced at 60 cm was used for the initial support. The secondary lining is made of 50 cm thick reinforced concrete and the main reinforcement of the steel bars is φ22 mm with a spacing of 20 cm. The upper and lower step method is used for tunnelling, with a distance of approximately 5-7m between the upper and lower steps.
3. Three-dimensional numerical simulation and seismic calculation
3.1 Simulation model and boundary conditions
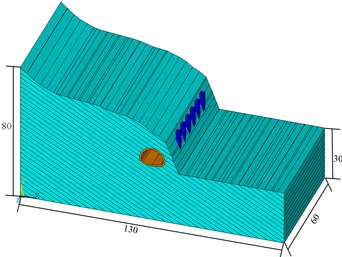
The three-dimensional model created based on the terrain and geological characteristics of the tunnel is shown in Fig. 4. The solid elements were used to simulate the surrounding rock, the composite lining and the anti-slip piles. The simulation of rock layers is achieved by setting the contact between bodies, with a distance of 2 m between rock layers. Using the frictional contact type, the two contact surfaces can either separate normally or slide tangentially. The cable elements were used to simulate the anchor cables. In order to eliminate the influence of boundary conditions, the distance from the left and right boundaries to the tunnel is approximately five times the tunnel width, and the distance from the lower boundary to the tunnel is approximately three times the tunnel height. Therefore, the model has a length of 130 m in the x-direction, a height of 80 m in the y-direction and a width of 60 m in the z-direction. There are 366834 elements and 66097 nodes in the model. During the simulation, the left boundary (x = 0 m), the right boundary (x = 130 m), the lower boundary (y = 0 m), and the z = 60 m boundary were fixed by roller, and the top surface was free. Along the z = 0 m side, y = 0 m to y = 30 m was fixed by roller, and y = 30 m to the top was free.
Fig. 4 Three-dimensional simulation model (unit: m).
3.2 Seismic wave simulation
To accurately simulate the propagation process of seismic waves in actual sites and eliminate the reflection effect of seismic waves on artificially set model boundaries, viscous boundaries are set in the calculation model to absorb or consume wave energy transmitted outside the boundaries, which can accurately reflect the propagation process of seismic waves. Viscous boundary refers to the application of forward and tangential viscous resistance on the boundary, which is independent of the boundary and provides- forward resistance tn and tangential viscous resistance ts:
|
|
(1) |
|
|
(2) |
where vn and vs are the forward and tangential components of velocity on the boundary, respectively; ρ is the density of the medium; Cp and Cs are the propagation velocities of P and S waves in the medium, respectively.
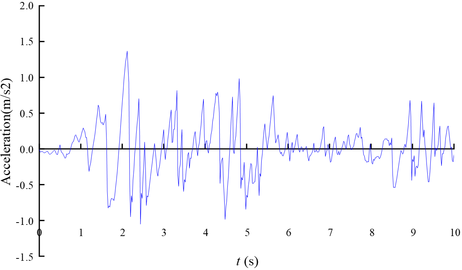
In the Specifications for Seismic Design of Highway Tunnels [JTG 2232-2019] [26], the seismic fortification intensity of the area where the tunnel is located is 6 degrees, the design basic seismic acceleration value is 0.10 g, the design earthquake group is the first group, and the characteristic period of the seismic response spectrum is 0.35 s. According to the tunnel site conditions, the corresponding artificial waves are synthesised as the calculation criteria, and the input dynamic time history is shown in Fig. 5.
Fig. 5 Time history curve of earthquake acceleration
3.3 Simulation process and parameters
The initial stress field of the model considers only the self-weight stress field. According to the actual construction sequence, the anti-skid piles and anchor cables are constructed first, followed by excavation and lining. Once the calculation is complete, the tunnel enters the operational phase before seismic waves are input. The calculation uses the Mohr-Coulomb model for the surrounding rock and rock layers, and the elastic model for the lining and anti-skid piles. According to the geological report and the design parameters, the simulated parameters are shown in Table 1.
Table 1 Physico-mechanical parameters of materials
| ρ/(kg·m-3) | E/MPa | ν | c/kPa | φ/(°) | |
| Surrounding rock | 2200 | 5000 | 0.3 | 45 | 43 |
| Bedding plane | 1800 | 2500 | 0.35 | 30 | 22 |
| Lining | 2500 | 21000 | 0.2 | - | - |
| Anti-slide pile | 2300 | 20000 | 0.2 | - | - |
4. Simulation results
4.1 Key points
Ground motion analysis has usually been based on deformation analysis. At the same time, from an engineering point of view, the stability and safety of the tunnel is mainly judged by the magnitude of the tunnel deformation value. Finally, since the seismic wave input in this paper is the shear wave input at the bottom of the model, the surrounding rock is mainly subjected to shear. At this point, the horizontal displacement of the surrounding rock is much larger than the vertical displacement. Therefore, this paper mainly investigates the horizontal and vertical deformation characteristics of the monitoring points.
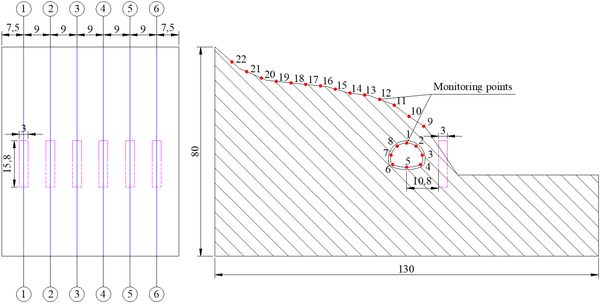
The selection of monitoring points has a significant effect on the results of the dynamic response analysis. To avoid the influence of boundary effects, monitoring points are placed along 6 cross-sections in the Y-direction of the model. The layout of the monitoring points is shown in Fig. 6, where monitoring points 1-8 are located around the lining and monitoring points 9-22 are located along the slope.
Fig. 6 Layout of monitoring points (unit: m)
4.2 Displacement characteristics of the lining during earthquake
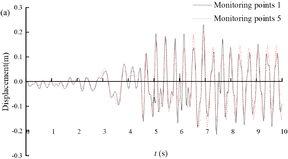
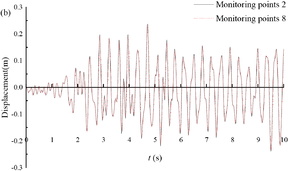
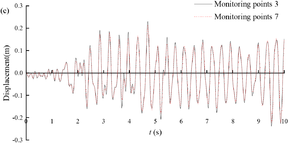
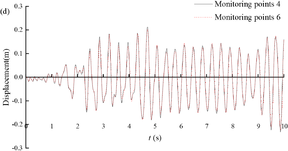
Fig. 7a shows the displacement time histories of the arch crown and invert of section 3. From the figure it is seen that the tunnel arch produces greater displacement compared to the tunnel invert, mainly due to the different constraints on the tunnel invert and the arch, with less soil cover from the tunnel to the arch and less constraints on the arch. Fig. 7b~d show the time-history displacement curves of the tunnel arch shoulder, arch waist and arch corner. It can be seen that due to the influence of terrain distortion, the displacement changes of the arch shoulder, arch waist and arch foot of the shallow buried side of the tunnel are larger than the corresponding positions of the deep buried side. At the same time, due to the small distance between each part, the displacement difference remains between 0 and 0.043 m, and the displacement change is not significant.
Fig. 7 Horizontal displacement of the tunnel portal
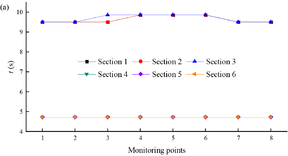
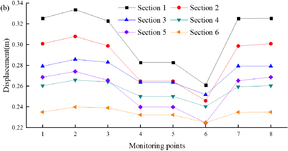
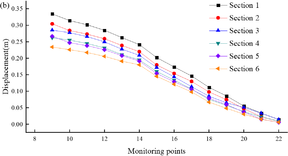
It is also necessary to investigate the peak displacement of the monitoring points at each section of the tunnel entrance. Fig. 8 shows the peak horizontal displacement of the monitoring points at the tunnel entrances under different tunnel depths. Fig. 8a shows the time when the peak displacement is reached at different sections. It can be seen from the figure that the time when the peak displacement is reached at the tunnel entrance is approximately the same, but the time when the peak displacement is reached at different sections is different. For example, the fluctuation of the time when peak displacement is reached at sections 1-3 remains between 9.5 s and 9.86 s, while the time when peak displacement is reached at sections 4-6 remains unchanged at 4.72 s. Fig. 8b shows the maximum deformation generated by the monitoring points at different tunnel entrance cross-sections under seismic action. It is seen that as the depth of the tunnel increases, the peak displacement that can be achieved at the tunnel entrance decreases and the magnitude of the decrease gradually decreases. This is because the constraints at the tunnel entrance are stronger than those at the tunnel exit, and the rock masses constrain each other under the influence of seismic motion, resulting in a relatively small displacement.
Fig. 8 Peak horizontal displacement at monitoring points
4.2 Slope displacement
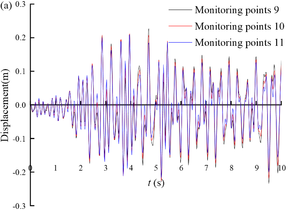
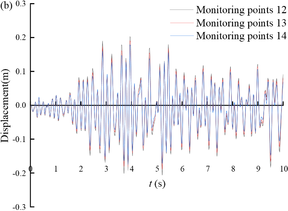
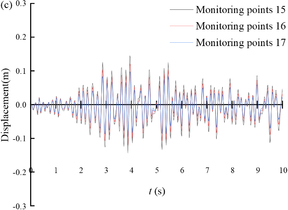
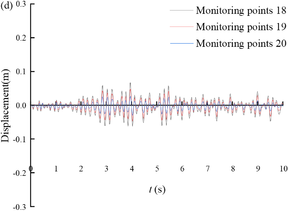
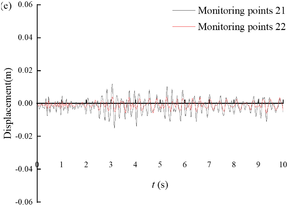
Fig. 9 shows the displacement time histories of the monitoring points on the slope of Section 3. From the figure, it can be seen that the seismic displacement gradually decreases from the bottom of the tunnel slope to the top of the tunnel slope. The magnitude of the displacement time range fluctuation is larger when the slope gradient is steeper, such as monitoring point 9 to monitoring point 11; and the magnitude of the displacement time range fluctuation is smaller when the slope gradient is gentler, such as monitoring point 12 to monitoring point 22.
Fig. 9 Horizontal displacement time scale of the tunnel slope
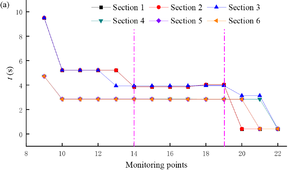
Based on the calculation results, draw the peak horizontal displacement map of the tunnel slope monitoring points under different tunnel depth conditions as shown in Fig. 10. Fig. 10a shows the time taken for different sections to reach the peak displacement. It can be seen from the figure that the time taken to reach the peak displacement shows a phased pattern and the time of occurrence of the peak displacement on the slope remains basically constant within the 20m range. If the slope surface corresponds to the monitoring, the time for monitoring points 10-14 to reach the peak displacement at section 1-3 is maintained at 5.22 seconds, at section 4-6 it is maintained at 2.84 seconds, and the time for monitoring points 15-19 to reach the peak displacement at section 1-3 is maintained at 3.86 seconds, and at section 4-6 it is maintained at 2.84 seconds. Fig. 10b shows the peak displacement of the monitoring points at different sections. As the depth of the tunnel increases, the distance between the peak displacements on the tunnel slope gradually decreases. Compared with Fig. 8, despite the constraint of anti-slip piles, the time at which the monitoring points on the tunnel slope reach the peak displacement is shorter than the time at which the monitoring points at the tunnel entrance reach the peak displacement. And the peak displacement reached in the steep slope area of the tunnel is greater than that at the tunnel entrance.
|
Fig. 10 Peak horizontal displacement at monitoring points
The above analysis of the horizontal displacement characteristics indicates that the tunnel body is less prone to significant deformation compared to the entrance due to the strengthening of the surrounding rock constraints. In addition, for tunnels with poor terrain and geological conditions, the damage to the tunnel slope is no less than that to the entrance and more attention should be paid to the seismic and seismic measures of the tunnel slope.
5. Conclusions
(1) For tunnels passing through slopes (topographically asymmetrically loaded) and inclined rock strata (geologically asymmetrically loaded), even with appropriate slope support measures, the slope is more prone to landslides and other disasters due to terrain and geological factors under seismic action than the linings. Therefore, more attention should be paid to the seismic and anti-seismic measures of the tunnel slope.
(2) The time to peak post-seismic displacement after earthquake of the linings is slightly delayed compared to that of the slope, and the time to peak displacement shows a phased pattern, with the peak displacement of the slope remaining constant within the 20 m range.
(3) As the depth of the tunnel increases, the effect of the earthquake on the tunnel gradually decreases. And for the tunnel linings, the seismically weak areas are at the tunnel arch shoulder and the side wall.
(4) It is well known that the occurrence and mechanical properties of rock layers are key factors influencing the mechanical behavior of tunnels. However, only a case study has been conducted in this paper, and the characteristics of rock layers and slopes are certain. Therefore, further research can systematically investigate different rock layers and slope characteristics to guide the design and construction of similar projects in seismic areas.
Acknowledgments
This work is supported by the Research Ability Enhancement Project for Young and Middle-aged Teachers in Universities in Guangxi (Grant No. 2022KY1169).
References
[1] Wang W, L., Wang T, T., Su J, J., Huang T, H., 2001. Assessment of damage in mountain tunnels due to the Taiwan Chi-Chi Earthquake. Tunnelling & Underground Space Technology Incorporating Trenchless Technology Research, 16(3): 133-150. DOI: 10.1016/S0886-7798(01)00047-5.
[2] Li T, B., 2008. Failure Characterisitics and Influence Factor Analysis of Mountain Tunnels at Eplcenter Zones of Great Wenchuan Earthquake. Journal of Engineering Geology, 16(06): 742-750 (in Chinese).
[3] Cui G, Y., Liu W, D., Ni S, Z., Wang M, N., Lin G,J., 2014. Study on Diffierent Seismic Intensities and Earthquake Damage to Highway Tunnels in Wenchuan Area Affected by Earthquakes. Modern Tunnelling Technology, 51(06): 1-6 (in Chinese). DOI: 10.13807/j.cnki.mtt.2014.06.001.
[4] Li Y, S., Gao G, Y., Li T, B., 2006. Analysis of Earthquake Response and Stability Evaluation for Transeverse Slope at Secund Tunnel Portal. Chinese Journal of Underground Space and Engineering, (05): 738-743 (in Chinese).
[5] Yan S, A., Liang B., Gao B., 2005. Dynamic Analysis of Longitudinal aseismic Reliability of Underground Structures. Chinese Journal of Rock Mechanics and Engineering, (01): 71-76 (in Chinese).
[6] Yan S, A., Liang B., Gao F., Gao B., 2005. Dynamic Reliability Analysis on Resistance of Tunnels to Longitudinal Non-stationary Eartuquake. Chinese Journal of Rock Mechanics and Engineering, (05): 818-822 (in Chinese).
[7] Cui G, Y., Wang M, N., Yu L., Lin G, J., 2013. Seismic Damage and Mechanism of Portal Structure of Highway Tunnels in Wenchuan Earthquake. Chinese Journal of Geotechnical Engineering, 35(06): 1084-1091 (in Chinese).
[8] Li T, B., 2012. Damage to mountain tunnels related to the Wenchuan earthquake and some suggestions for aseismic tunnel construction. Bulletin of Engineering Geology and the Environment, 71(2). DOI: 10.1007/s10064-011-0367-6.
[9] Cui G, Y., Wu X, G., Wang M, N., Lin G, J., 2017. Earthquake Damages and Characteristics of Highway Tunnels in the 8.0-Magnitude Wenchuan Earthquake. Modern Tunnelling Technology, 54(02):9-16 (in Chinese). DOI:10.13807/j.cnki.mtt.2017.02.002.
[10] Zang W, J., 2017. Damage to Highway Tunnels Caused by tne Wenchuan Earthquake. Modern Tunnelling Technology, 54(02): 17-25 (in Chinese). DOI: 10.13807/j.cnki.mtt.2017.02.003.
[11] Fan Z, F., Zhang J, C., Xu h., 2019. Theoretical study of the dynamic response of a circular lined tunnel with an imperfect interface subjected to incident SV-waves. Computers and Geotechnics, 110(06): 308-318. DOI: 10.13807/j.cnki.mtt.2017.02.003.
[12] Xu J, S., Xu H., Sun R, F., Zhao X, W., Yin C., 2020. Seismic risk evaluation for a planning mountain tunnel using improved analytical hierarchy process based on extension theory. Journal of Mountain Science, 17(01).
[13] Cui G, Y., Wang M, N., Lin G, J., Wang W, J., Zhang D., 2011. Statistical Analysis of Earthquake Damage Types of Typical Highway Tunnel Lining Structure in Wenchuan Seismic Disastrous Area. The Chinese Journal of Geological Hazard and Control, 22(01): 122-127. DOI:10.16031/j.cnki.issn.1003-8035.2011.01.019.
[14] Cao M, X., Yan S, H., Du J, X., Sun W, Y., Li Y, X., Zhao J, J., 2023. Effect of Oblique SV Wave on the Seismic Response of Mountain Tunnel. Advances in Civil Engineering, 2023. DOI: 10.1155/2023/4368949.
[15] Liu Z, X., Ai T, C., Huang L., Meng S, B., Jiang P, L., 2022. Seismic Dynamic Response Analysis of Mountain Tunnels with Seismic Reduction and Isolation Measures. KSCE Journal of Civil Engineering, 27(1). DOI:10.1007/S12205-022-0288-X.
[16] Zhao X, Li R, H., Yuan Y, Yu H, T., Zhao M, Huang J. Q., 2022. Shaking table tests on fault-crossing tunnels and aseismic effect of grouting. Tunnelling and Underground Space Technology incorporating Trenchless Technology Research, 125. DOI:10.1016/J.TUST.2022.104511.
[17] Shen Y, S., Wang Z, Z., Yu J., Zhang X., Gao B., 2020. Shaking table test on flexible joints of mountain tunnels passing through normal fault. Tunnelling and Underground Space Technology incorporating Trenchless Technology Research, 98(C). DOI: 10.1016/j.tust.2020.103299.
[18] Xu H., Li T, B., Xia L., Zhao John, X., Wang D., 2016. Shaking table tests on seismic measures of a model mountain tunnel. Tunnelling and Underground Space Technology incorporating Trenchless Technology Research, 60. DOI: 10.1016/j.tust.2016.09.004.
[19] Liu J, B., Wang W, H., Zhao D, D., 2013. Comparison of the Pseudo-static Methods for Seismic Analysis of the Underground Structures. Engineering Mechanics, 30(01) (in Chinese). DOI: 10.6052/j.issn.1000-4750.2011.05.0316.
[20] Yu H, T., Zhang Z, W., Wu Y, X., Dai C, X., 2018. Analysis Methods for Simplified longitudinal Seismic Response of Variable Stiffness Tunnels. Earthquake Engineering and Engineering Dynamics, 38(4) (in Chinese). DOI: CNKI:SUN:DGGC.0.2018-04-011.
[21] Fang X,Q., Ma H, W., Zhu C, S., Ding Q, L., Zhu Z, G., Han Z, M., 2023. Imperfect interface model and dynamic interaction mechanism around tunnels under seismic waves: A review. Tunnelling and Underground Space Technology incorporating Trenchless Technology Research, 137. DOI: 10.1016/J.TUST.2023.105120.
[22] Li P., Song E, X., 2013. A high-order time-domain transmitting boundary for cylindrical wave propagation problems in unbounded saturated poroelastic media. Soil Dynamics & Earthquake Engineering, 48: 48-62. DOI: 10.1016/j.soildyn.2013.01.006.
[23] Zuo Z, W., Li D., Zhou P,F., ;Lin C, J., Yang Z, C., Xu X, J., Zhang L, L., Wang J, S., 2021. Analysis of Seismic Wavefield Characteristics in 3D Tunnel Models Based on the 3D Staggered-Grid Finite-Difference Scheme in the Cylindrical Coordinate System. Applied Sciences, 11(13). DOI: 10.3390/APP11135854.
[24] Alielahi H., Kamalian M., Adampira M., 2015. Seismic ground amplification by unlined tunnels subjected to vertically propagating SV and P waves using BEM. Soil Dynamics & Earthquake Engineering, 71: 63-79. DOI: 10.1016/j.soildyn.2015.01.007.
[25] Vasilev G., Parvanova S., Dineva P., Wuttke F., 2015. Soil-structure interaction using BEM–FEM coupling through ANSYS software package. Soil Dynamics and Earthquake Engineering, 70: 104-117. DOI: 10.1016/j.soildyn.2014.12.007.
[26] JTG 2232-2019 , Specifications for Seismic Design of Highway Tunnels. (in Chinese).
Document information
Published on 09/10/23
Accepted on 27/09/23
Submitted on 22/08/23
Volume 39, Issue 4, 2023
DOI: 10.23967/j.rimni.2023.10.001
Licence: CC BY-NC-SA license
Share this document
Keywords
claim authorship
Are you one of the authors of this document?
