m (Tag: Visual edit) |
m (Tag: Visual edit) |
||
| Line 294: | Line 294: | ||
In the actual construction process, as the actual load of the cover beam was transferred to the main support through the upper berth and distribution beam of the support, all the theoretical loads were converted into linear loads and applied to the two main supports respectively, of which the construction load (including manual movement, equipment placement, etc.) was 11.5KN/m, the formwork load was 2.6KN/m, and the main load of the cover beam (including the theoretical weight of concrete and the theoretical weight of reinforcement) was 118.3KN/m. During the construction of the cover beam, the reinforcement tying stage was carried out in a homogeneous pattern, so that the load was applied to the top chord in batches in the form of homogeneous loads. The main load is the weight of the concrete, and the actual concrete pouring phase is divided into four stages for the safety of the construction: middle part of the cover beam - 1/2 weight pour at the south end; middle part of the cover beam - 1/2 weight pour at the north end; middle part of the cover beam - full weight pour at the south end; middle -all weight at the north end. Therefore, when analyzing the forces at this stage in the finite element simulation, the loads were also applied according to the four stages. The stress and displacement clouds of the overall support are shown in Figure 8. | In the actual construction process, as the actual load of the cover beam was transferred to the main support through the upper berth and distribution beam of the support, all the theoretical loads were converted into linear loads and applied to the two main supports respectively, of which the construction load (including manual movement, equipment placement, etc.) was 11.5KN/m, the formwork load was 2.6KN/m, and the main load of the cover beam (including the theoretical weight of concrete and the theoretical weight of reinforcement) was 118.3KN/m. During the construction of the cover beam, the reinforcement tying stage was carried out in a homogeneous pattern, so that the load was applied to the top chord in batches in the form of homogeneous loads. The main load is the weight of the concrete, and the actual concrete pouring phase is divided into four stages for the safety of the construction: middle part of the cover beam - 1/2 weight pour at the south end; middle part of the cover beam - 1/2 weight pour at the north end; middle part of the cover beam - full weight pour at the south end; middle -all weight at the north end. Therefore, when analyzing the forces at this stage in the finite element simulation, the loads were also applied according to the four stages. The stress and displacement clouds of the overall support are shown in Figure 8. | ||
| − | [[File:Draft_房_828988194_8150_图片10.png| | + | [[File:Draft_房_828988194_8150_图片10.png|386x386px]] |
| − | [[File:Draft_房_828988194_5736_图片11.png| | + | [[File:Draft_房_828988194_5736_图片11.png|386x386px]] |
(a)Stress clouds(Unit:MPa) (b)Displacement clouds(Unit:mm) | (a)Stress clouds(Unit:MPa) (b)Displacement clouds(Unit:mm) | ||
Revision as of 19:28, 22 November 2022
Abstract
The safety study is carried out for the large cantilevered cover beam assembly bracket used in the actual project, using real-time monitoring and early warning of the whole process, monitoring the strain and displacement development process of the bracket during the actual construction process, ensuring that the use of the bracket is in a safe state during the actual construction process while analyzing the causes of its changes and proposing the timing of the bracket flow. Modelling of the support and numerical simulation for actual working conditions. The monitoring data and analysis results show that the overall bracket stress ratio is less than 30%, and after the concrete structure being supported hardens, the bracket is unloaded, and the bracket strain is reduced to less than 10% of the stress ratio before it is most appropriate to remove the bracket. The maximum strain does not exceed 66.26% of the theoretical maximum strain of the rod. The actual construction conditions and the spatial form of the bracket affect the force situation, resulting in a significant deviation from the theoretical maximum strain, and the analysis results and trends reflect the low utilization rate of such bracket rods. The results of the study can be used as a reference for the topology optimization of assembled bracing frames for large cantilevered cover beams.
Keywords: Large cantilever fabricated support; Real time monitoring and early warning; Simulation analysis; Stress ratio utility analysis
1. Introduction
In the city's overpass system, it is common to see the existence of a large cantilever prestressed cover beam because of its overwhelming characteristics, such as long span, compact, small footprint, open to traffic and high urban utilization rate. Both local and oversea scholars have in-depth study in the full load bearing bracket because of the extensive use and the comprehensive construction technique[1-6]. With the development of technology, society requires a shorter construction period,the traditional full load bearing bracket needs too much time and experienced workers to set up. Thus, the large cantilever assembly support frame which cost less time and short turn over a period became a better choice to constructors,because of its passable stents, the construction process could minimize the influence on local traffic. Nowadays, the majority of researchers focus more on stents' construction technology or shape design, instead of force analysis. Although a part of researchers uses the finite element analysis method to simulate the loading condition of the heteromorphic stent, fewer of them apply the test in actual construction condition[7-11].Moreover, internal and external scholars prefer to focus on stent monitoring and monitoring plan research rather than real-time construction process monitoring[12-16].
This essay is based on the Hangzhou Pengbu Interchange Reconstruction Project. It is focused on the real-time information monitoring of the first class large cantilever truss prestressed cover beam prefabricated support frame. Such stent is different from others. The superstructure is a cantilever truss structure which suitable for cantilever cover beam construction. Except for the shorter construction period, the primary advantage of it is the passable stent, which satisfies the requirements of traffic reconstruction on site. In order to generate a comprehensive monitoring plan, the high-frequency acquisition instrument is used to monitor the whole actual process of construction in real-time all day, simultaneously increasing construction security. Through data analysis and the change of force in the different construction phase, this essay is going to figure out the reliability rate and the optimal turning timing of stents. Furthermore, the finite element simulation and monitoring data will be compared and analyzed to figure out the main factors that may affect the support force in the construction process. It provides technical support for safe construction and a basis for the broad application of this kind of stent.
2. Project profile
The Hangzhou Pengbu Interchange reconstruction project is interworking in situ reconstruction. The total length of the road is around 1.73 meters. The main highway is 1.49m long. The bridge has a full width of 25.1m and a maximum span of 56m.The main line cover beam construction could be considered a risky project. The structure could be divided into three main types, which include: T-type, M-type, and F-type. Most of them are T-type structures, and 30 of them are the size of 25.11m×3.0m×2.4m. Because of the enormous traffic flow, the full of the support frame is not allowed to use here. However, the current construction does not use column. It means that except for the high cost and high-risk level, the force of the column in all directions is not uniform while constructing. Thus, the new large cantilever assembly bracket will be more suitable under such conditions. This essay mainly focuses on the monitoring and analysis of one of the support forms of the T-shaped cover beam.
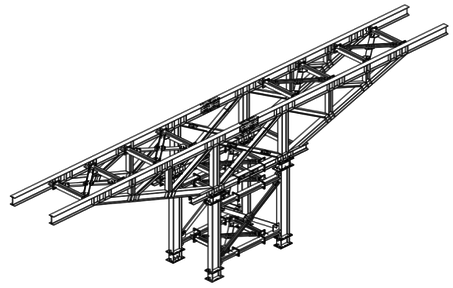
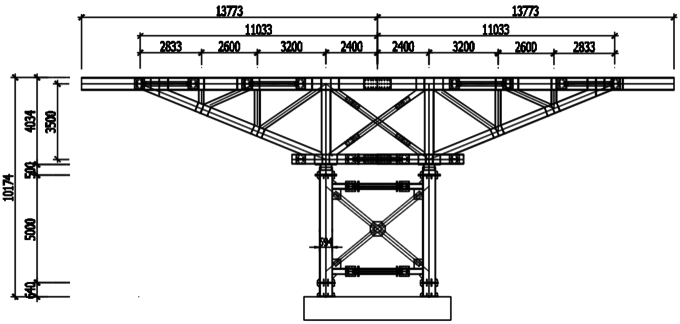
This kind of support system mainly contains foundation, steel column, horizontal support, unloading sandbox, beam and scissors support. Steel components are mainly made of Q235 steel. The support rods are all standard H-shaped steel. The upper chord is 588×300 H-type steel, the lower chord is 440×300 H-type steel, the connecting rod is 250×250 H-type steel, and the vertical foundation supporting rod is 594×302 H-type steel. For more information, the foundation is connected to the column by anchor bolts of embedded parts, the middle column is connected to the C30 concrete foundation and embedded parts of the cap platform by anchor bolts, and the unloading sandbox is set between the steel column and the beam for force transmission and unloading. The specific structure of the support is shown in Figure 1.
(a) Support space structure (b) Planar structure of support
Fig.1 Support structure
3. Construction monitoring and actual data analysis
3.1 Construction monitoring and forewarning
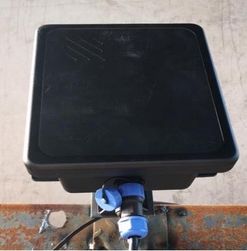
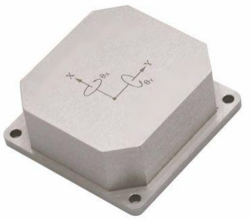
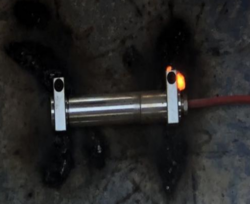
For this monitoring, after the classification according to the structure location, the monitoring location is selected according to the theoretical force situation of the pole. The monitoring instruments are shown in Figure 2, the IICC-NDM non-contact deflection detector is used for displacement monitoring, the HC-B300 dual-axis digital display inclinometer is used for bracket tilt situation, and the JDEBJ vibrating string surface strain gauge is used for strain monitoring, which is uploaded to the monitoring cloud through the HC-M610/4/8 wireless data collector. The network monitoring platform is shown in Figure 3, which collects data 24 hours a day to ensure real-time construction monitoring data transmission and real-time safety of bracket construction.
(a) Non-Contact Flexure Tester (b) Double-axis digital inclinometer (c) Vibrating chord surface
Fig.2 Monitoring instruments
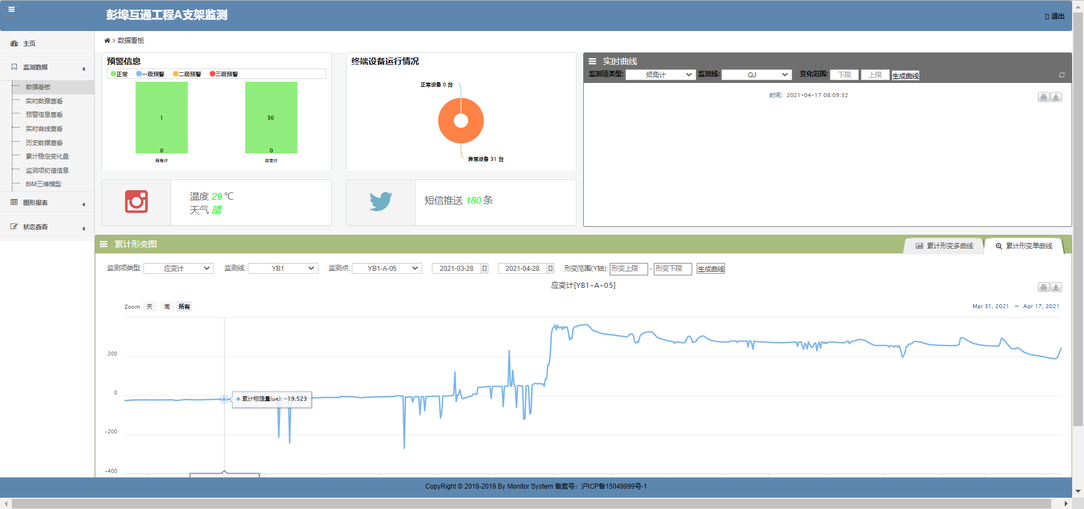 Fig.3 Network monitoring platform
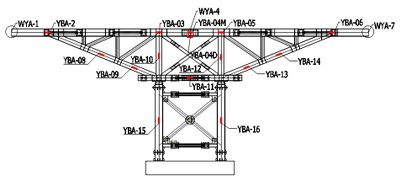
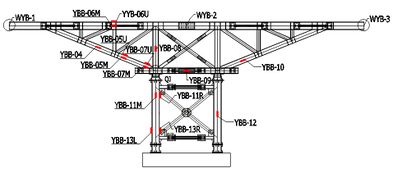
The specific monitoring position is shown in Figure 4.There are 30 strain monitoring stations (some of the monitoring test bar are stress form correctly, and the i-steel web and flange set two strain gauge respectively); 6 displacement monitoring point (using three deflection detector by fixed position instrument, the relative position between the monitoring and measurement instrument, determine stent displacement deformation, displacement of each instrument can be used to detect two points); and one inclination monitoring point (placed on the central column)
(a) Product A supports (b) Product B supports
Fig. 4 Layout of monitoring positions of product A and product B supports
The monitoring and early warning process is shown in Figure 5.Through the construction data, the theoretical maximum strain and maximum displacement of each rod of the construction support are calculated according to the theoretical maximum construction load, the monitoring scheme (monitoring points and instruments) is determined, the three-level warning value is set, and the actual data of the support during the construction process is monitored and collected throughout the day. Due to real-time monitoring, once there is a dangerous situation, the system could immediately give feedback to the construction site, adjust the construction, and then ensure construction safety, forming a closed-loop construction-monitoring chain.
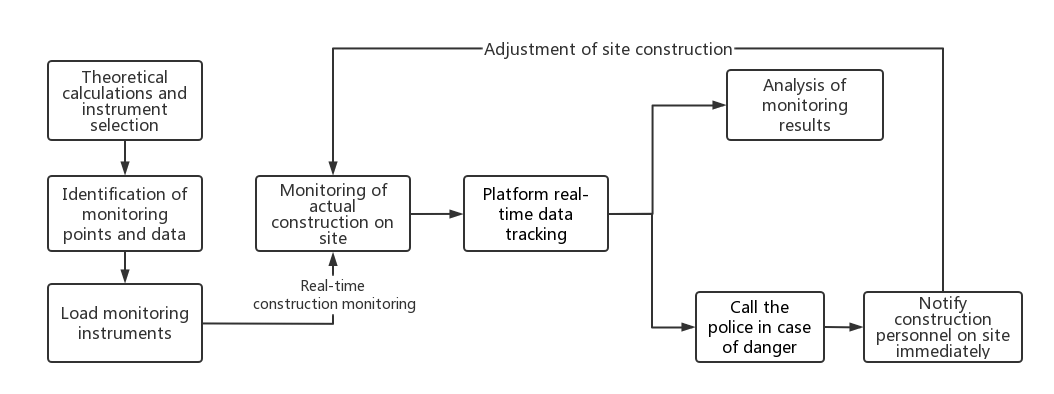 Fig.5 Monitoring and early warning flowchart
During construction, in order to provide early warning for the actual construction, the theoretical maximum strains of the brackets were calculated for all bars according to the elastic bars according to the design cover beam construction loads (construction load 5 kN/m2, formwork load 2 kN/m2, concrete load 26 kN/m2), considering that the brackets should all be warned within the yield load (after the action of the upper beryl beam of the brackets, so the maximum theoretical loads were divided according to The maximum strain on the brackets caused by the uniform distribution of the load on the two independent brackets) and the theoretical maximum displacement resulting from the larger displacements are calculated. Taking into account the yield strength of the material of each rod and the destabilization strength of the space structure, each strength meets the requirements, therefore, according to 110%, 120% and 130% of the theoretical maximum strain (all of which are less than the yield strength and destabilization strength of the rod), a three-stage warning is proposed to guide the construction on site, and the strain warning values of each measurement point are shown in Table 1.
Table 1 Early warning values of strain at each measuring point (strain unit: με)
| Number | Level 1 | Level 2 | Level 3 | Number | Level 1 | Level 2 | Level 3 |
| YBA-03 | 915 | 998 | 1043 | YBB-04 | 550 | 600 | 651 |
| YBA-04D | 768 | 845 | 922 | YBB-05U | 723 | 789 | 855 |
| YBA-04M | 768 | 845 | 922 | YBB-05M | 723 | 789 | 855 |
| YBA-05 | 915 | 998 | 1043 | YBB-06U | 915 | 998 | 1043 |
| YBA-08 | 550 | 600 | 651 | YBB-06M | 915 | 998 | 1043 |
| YBA-09 | 723 | 789 | 855 | YBB-11R | 351 | 383 | 414 |
| YBA-10 | 273 | 298 | 322 | YBB-11M | 351 | 383 | 414 |
| YBA-11 | 620 | 676 | 732 | YBB-07U | 723 | 789 | 855 |
| YBA-13 | 723 | 789 | 855 | YBB-07M | 723 | 789 | 855 |
| YBA-14 | 550 | 600 | 651 | YBB-08 | 273 | 298 | 322 |
| YBA-12 | 273 | 298 | 322 | YBB-09 | 620 | 676 | 732 |
| YBA-16 | 351 | 383 | 414 | YBB-10 | 723 | 789 | 855 |
| YBA-15 | 351 | 383 | 414 | YBB-12 | 351 | 383 | 414 |
| YBA-02 | 239 | 261 | 283 | YBB-13R | 351 | 383 | 414 |
| YBA-06 | 239 | 261 | 283 | YBB-13L | 351 | 383 | 414 |
3.2 Analysis of monitoring data
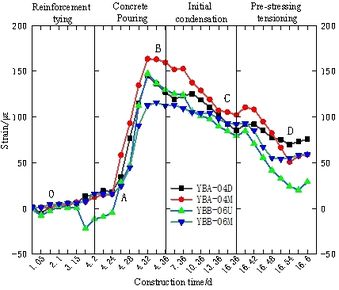
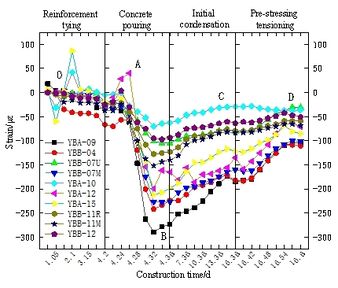
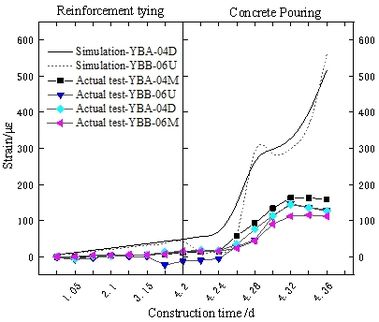
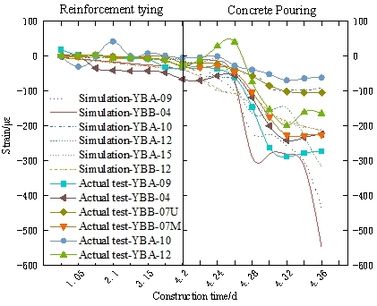
Through the monitoring of the whole construction process, the displacement and inclination of the actual bracket were small and almost unchanged, so the main analysis was on the strain. The form of force on this bracket is similar to that of a truss structure, and the force members are divided into two main categories, the first category of compressive members and the second category of tensile members. (the OA section is the reinforcement tying stage, the AB section is the concrete pouring stage, the BC section is the initial concrete setting stage and the CD section is the prestressing primary tensioning stage). The full process strain trends for the two types of stressed bars are shown in Figure 6.
(a) Tensile components (b) Compressed components
Fig. 6 Strain trend diagram of two kinds of stressed rods in the whole process
The strain trends in the whole process and the comparison with the strain data at the monitoring points show that the strain trends are the same during the whole construction process, i.e. reinforcement tying and formwork installation - concrete placement - initial concrete setting stage - primary prestressing tensioning.
From the strain trend diagram of the whole process, we can learn that during the stage of reinforcement tying and formwork installation, as the load of the upper cover beam reinforcement and formwork slowly increased, the strain of each member of the lower support frame slowly increased. Although the theoretical construction load accounted for 20% of the overall load, the actual strain of the bracket bars was only 10% to 15% of the maximum strain. After the installation of the formwork was completed, concrete was poured, and as concrete was the main load of the overall cover beam, the overall strain of the lower brace rose sharply with the pouring of concrete to the strain maximum, and the maximum rod strain was 289.54 με, but it was still within the safe range, and there was still a large gap with the theoretical strain, accounting for only 40.03% of the theoretical value, and the rod closest to the theoretical strain , the actual strain reached 73.01% of the theoretical strain.
Entering the initial concrete setting stage, the overall cover beam stiffness gradually increases due to the internal hydration of the concrete, and the load on the bracket is continuously released, so the stress on each bar is continuously reduced, i.e. the strain variable expressed by the strain data slowly falls back and can drop to 60%~75% of the maximum strain. The primary prestressing tensioning of the cover beam, with the prestressing bars arranged on the self-weighted tensioned side of the cover beam, tensions the prestressing bars and further increases the stiffness of the cover beam, resulting in a further increase in the ability of the cover beam to withstand the overall self-weight, and the strain decreases to the lowest point of the fallback interval, falling back to approximately 50% of the maximum strain.
It can be seen that the release of the stress in the bracket is closely linked to the continuous improvement in the stiffness of the upper cover beam. As the process continues, in the increased load section, the strain in the bracket increases with the overall load, but the actual strain, which has a large gap with the theoretical strain, basically does not exceed 75% of the theoretical maximum strain. According to the changes in the strain variables of each rod, the internal stresses can be calculated, as the size of each type of rod is different, so the ultimate yield stress is also different. 6.84%. The maximum strain and stress ratio at each measurement point is shown in Table 2. This shows that the overall bar utilization is very low and the bar strain surplus is still large.
Table 2 Maximum stress variable and stress ratio of each measuring point
| Measurement point number | Stage Maximum Change Strain Variable(με) | Stress ratio(%) |
| YBA-04D | 144.629 | 13.86 |
| YBA-04M | 163.48 | 15.66 |
| YBB-06U | 147.333 | 14.12 |
| YBB-06M | 115.837 | 11.10 |
| YBA-09 | -289.452 | 28.24 |
| YBB-04 | -241.991 | 23.50 |
| YBB-07U | -105.09 | 10.25 |
| YBB-07M | -227.754 | 22.22 |
| YBA-10 | -70.071 | 6.84 |
| YBA-12 | -199.335 | 19.46 |
| YBA-15 | -211.932 | 20.96 |
| YBB-11R | -127.36 | 12.60 |
| YBB-11M | -152.01 | 15.04 |
| YBB-12 | -97.025 | 9.60 |
With the completion of the upper cover beam concrete pouring and hardening, the stent is unloaded, causing the stent stress strain to decrease. By monitoring the overall construction process, 10-12 days after hardening, i.e. 15-17 days after the start of the cover beam construction (during which one prestress tensioning of the cover beam is completed), the stent strain reaches a minimum of no more than 10% of the ultimate yield strain of the rod, and the stent is removed at this stage, which not only ensures the quality of the cover beam construction, but also improves the flow of the stent and shortens the cycle of the overall bridge construction.
The monitoring data shows that the brackets are safe in practice, the actual strain is still far from the ultimate yield strength of each bar, and the use of such assembled brackets can effectively improve the construction cycle of the cover beam, but the actual brackets have low utilization of each bar.
By analyzing the overall structure of the bracket, it can be found that this type of bracket is not a separate plane load-bearing system, but a space structure system that connects the two brackets stably through transverse scissor bracing and connecting members, which has a close combination with the lower pier of the cover beam, and by using the bearing capacity of the existing pier, it ensures that the bracket bears a smaller load during the construction of the cover beam, while most of the load is borne by the pier and column, thus The theoretical maximum strain of the support frame is greater than the actual strain. The finite element analysis of the spatial structure of the brace was then used to verify the use of each bar of the brace.
4. Finite element simulation analysis
4.1 Theoretical modelling
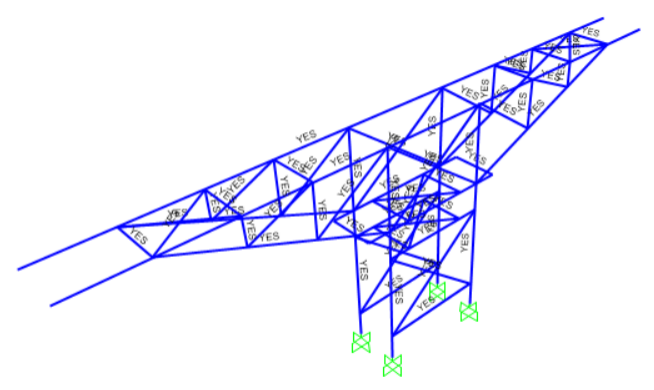
According to the monitoring of the actual construction situation, member type, member size and connection form and other actual bracket parameters, using the sap2000 finite element analysis software, the space bracket model is established to study the theoretical stress changes in the bracket under the theoretical construction load for each working condition and to verify the use of the bracket under the theoretical situation. The overall bracket is mainly divided into the following categories: upper chord bar (load directly applied part, 588 x 300 H-beam), lower chord bar (440 x 300 H-beam), web bar (250 x 250 H-beam) and column bar (594 x 302 H-beam). In the process of modelling, beam units were used for all types of bars, with each upper chord bar divided into 9 units, each web bar divided into 16 units, each lower chord bar divided into 3 units and each column bar divided into 3 units. As the actual construction of each bar is connected by multiple rows of high strength bolts, rigid nodes are used in the model to ensure moment transfer. The actual support at the bottom of the bracket is a high-strength bolt connected to the concrete pier pre-built, so fixed support is used. The three-dimensional calculation model is shown in Figure 7.
Fig. 7 3D Calculation mode
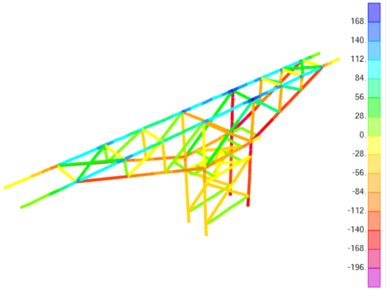
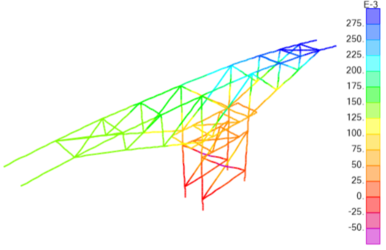
In the actual construction process, as the actual load of the cover beam was transferred to the main support through the upper berth and distribution beam of the support, all the theoretical loads were converted into linear loads and applied to the two main supports respectively, of which the construction load (including manual movement, equipment placement, etc.) was 11.5KN/m, the formwork load was 2.6KN/m, and the main load of the cover beam (including the theoretical weight of concrete and the theoretical weight of reinforcement) was 118.3KN/m. During the construction of the cover beam, the reinforcement tying stage was carried out in a homogeneous pattern, so that the load was applied to the top chord in batches in the form of homogeneous loads. The main load is the weight of the concrete, and the actual concrete pouring phase is divided into four stages for the safety of the construction: middle part of the cover beam - 1/2 weight pour at the south end; middle part of the cover beam - 1/2 weight pour at the north end; middle part of the cover beam - full weight pour at the south end; middle -all weight at the north end. Therefore, when analyzing the forces at this stage in the finite element simulation, the loads were also applied according to the four stages. The stress and displacement clouds of the overall support are shown in Figure 8.
(a)Stress clouds(Unit:MPa) (b)Displacement clouds(Unit:mm)
Fig. 8 Support nephogram
4.2 Model validation
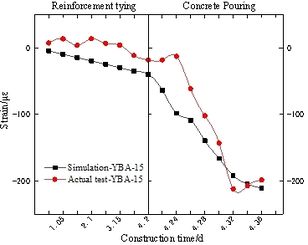
In order to verify the reasonableness of the model, the simulated data of the two types of stressed bars of the integral bracket were collated, and the strain change process of the bars is shown in Figure 9. As can be seen from Figure 9, although the simulated curve and the measured curve are different in some positions, the overall deformation development trend between the measured and simulated curves is relatively close, taking into account the actual construction influence and the sensitivity of the monitoring instruments, so the model is reasonable.
(a) Diagram of trends in tensioned components (b) Diagram of trends in pressurized components
Fig. 9 Strain change process
4.3 Analysis of calculation results
In the process of analyzing the calculation results, monitoring points with continuous strain trends and low fluctuations in the measured data were selected for analysis and comparison among the various types of bars in the bracket.
4.3.1 Upper chord rod force analysis
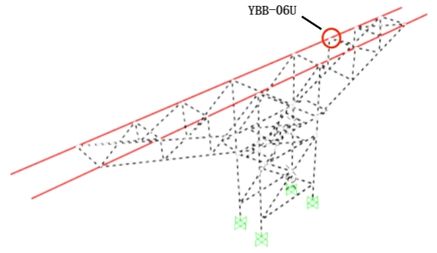
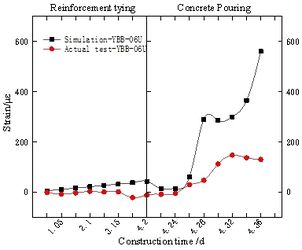
The actual monitoring data of the upper chord bar YBB-06U monitoring point compared with the simulated data is shown in Figure 10. As can be seen from Figure 10, during the reinforcement tying stage, the simulated and measured strain data of the bars increased gradually at a slow rate, but the strain variables were both small. During the reinforcement tying stage, the maximum strain in the actual monitoring data was 11.653με, accounting for 8.98% of the total strain, while the maximum strain in the simulated data was 42.961με, accounting for 7.66% of the total strain, and the two were relatively close to each other in terms of the total strain. During the concrete casting stage, the maximum strain in the actual monitoring data was 129.807με and the maximum strain in the simulated data was 560.582με. Due to the actual construction conditions and the influence of the structure of the support (the concrete fluid state and the unilateral force on the space structure of the support), both strains showed a strain trend of sudden rise and then slow fall or steady and then sudden rise again during this stage, and the maximum strain was The maximum strain is less than the theoretical maximum strain of 831 με for the single-sided force on the rod.
(a)Upper chord (b) Comparison curve of actual monitoring data and simulated data at YBB-06U monitoring point
Fig. 10 Strain of upper chord
4.3.2 Lower chord force analysis
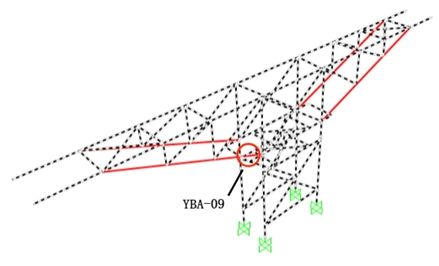
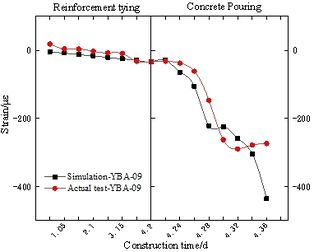
The actual monitoring data for the lower chord YBA-09 monitoring point compared with the simulated data curve is shown in Figure 11. As can be seen from Figure 11, during the reinforcement tying stage, as in the case of the upper chord, both the simulated and measured strain data of the bars gradually increased at a slow rate, but the strain variables were both small, and as the construction stage reached the concrete pouring stage, the main construction load increased at a faster rate, the strain variables of both increased significantly, and the strain variables of both were very close to each other, and the strain convergence trend of both was more consistent. During the reinforcement tying stage, the maximum strain in the actual monitoring data was -33.479με, accounting for 12.24% of the total strain, and the maximum strain in the simulated data was -33.655με, accounting for 7.74% of the total strain. During the concrete placement phase, the maximum strain in the actual monitoring data was -273.435με and the maximum strain in the simulated data was -435.145με, both maximum strains were less than the theoretical maximum strain of -657με in the bars.
(a) Lower chord (b)Comparison curve of actual monitoring data and simulated data at YBA-09 monitoring point
Fig. 11 Strain of Lower chord
4.3.3 web bar force analysis
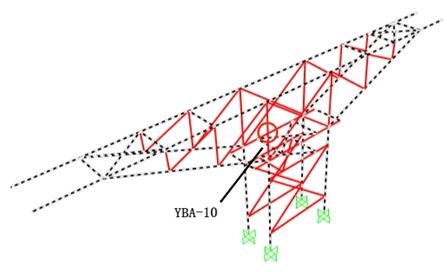
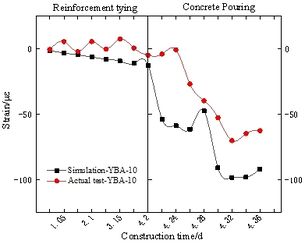
The comparison curve between the actual monitoring data and the simulated data for the web YBA-10 monitoring point is shown in Figure 12. As can be seen from Figure 12, during the reinforcement tying stage, unlike the situation of the upper and lower chords, the simulated data of the bar strain still increases gradually at a slow rate, while the actual measured data will have a tensile and compressive transformation, considering that the reason is that during the actual construction process, the reinforcement loads are not actually tied evenly according to the theoretical situation, resulting in positive and negative fluctuations of the web strain caused by the unilateral force on the bracket, but the overall tendency is still consistent with the simulated convergence, and both strains are smaller at this stage. The final strain variables are small, and as the construction phase reaches the concrete pouring phase, the main construction loads increase at a faster rate, and both strain variables increase significantly, with the same trend of strain convergence between the two. During the reinforcement tying stage, the maximum strain in the actual monitoring data was -4.974με, accounting for 7.96% of the total strain, while the maximum strain in the simulated data was -12.65με, accounting for 13.61% of the total strain. During the concrete placement phase, the maximum strain in the actual monitoring data was -62.495με and the maximum strain in the simulated data was -91.602με, both of which were less than the theoretical maximum strain of -248με in the bars.
(a) web bar (b)Comparison curve of actual monitoring data and simulated data at YBA-10 monitoring point
Fig. 12 Strain of web bar
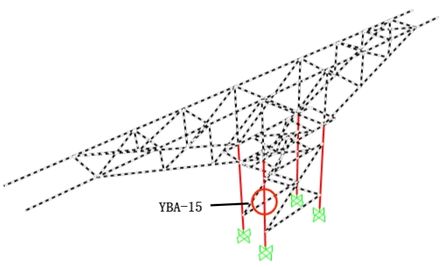
4.3.4 Column bars rod force analysis
The column bar, as the main load-bearing structure of the overall support, has the largest dimensions and a clear strain trend. The actual monitoring data of the column bar YBA-15 monitoring point compared with the simulated data curve is shown in Figure 13. As can be seen from Figure 13, during the reinforcement tying phase, as in the case of the web pole, the simulated strain data of the pole still increases gradually at a slow rate, while the actual measured data will have a tensile and compressive transformation, considering the same reasons as the web pole, but the overall tendency is still consistent with the simulated convergence, and the final strain variables are smaller at this stage, and as the construction phase reaches the concrete pouring phase, the main construction load increases at a faster rate, and both strain variables increase significantly Unlike the other bars, the growth curve of the concrete casting section of the column bar is smooth until the maximum strain is reached, and the trend of strain convergence is the same for both. During the reinforcement tying stage, the maximum strain in the actual monitoring data was -18.745με, accounting for 9.3% of the total strain, while the maximum strain in the simulated data was -39.995με, accounting for 18.92% of the total strain. During the concrete placement phase, the maximum strain of the actual monitoring data was -198.569με and the maximum strain of the simulated data was -211.359με, with an error of 6.05%, both of which were less than the theoretical maximum strain of -319με for the bars.
(a) Column bars (b)Comparison curve of actual monitoring data and simulated data at YBA-15 monitoring point
Fig. 13 Strain of column pole
The above analysis shows that overall the simulated strains of the model are consistent with the actual strains, but the actual monitoring situation is influenced by many factors at the site (construction conditions, construction sequence, construction equipment, etc.), and the actual strains may fluctuate significantly, but the overall trend is relatively stable. Compared to the simulated strain, the actual maximum strain is small, not exceeding 62.24% of the theoretical maximum strain of the pole, while the simulated data does not exceed 66.26% of the theoretical maximum strain of the pole. During the simulation and actual construction, the spatial connection of the bracket itself and the stable spatial structure system formed by the bracket and the support make the strain of the bracket decrease, much less than the theoretical maximum strain, and there is still more space to reach the ultimate yield strength of the rod itself, and no instability is generated, so the safety of the bracket in actual construction is guaranteed, and the utilization rate of the rod is lower, and the bracket can be optimized. The structure and member form can be optimized.
5. Conclusion
This study combines engineering examples to investigate a class of large cantilever prestressed cover beam assembly brackets in the Pengbu Interchange Reconstruction Project in Hangzhou, using a combination of real-time monitoring of actual construction and finite element analysis for monitoring and simulation analysis, resulting in the following conclusions.
(1) The use of real-time monitoring means, clear monitoring process, closed-loop monitoring chain, real-time monitoring of information changes in the support frame during the overall construction process, through the three-stage warning mechanism, the construction process to play a warning role to ensure the safety of the support frame during the whole construction, so that the cover beam construction process is steadily progressing, confirmed the safety of such large cantilever prestressed cover beam assembly support frame, monitoring system process and monitoring scheme can provide reference for such monitoring projects.
(2) The strains of the braces during the whole-process construction were monitored and analyzed to summarize the whole-process strain trend diagram. The analysis of the whole-process strain trend enables a clear view of the changing trend of the strains within the braces under different processes, puts forward the stress ratio of each bar, and proposes that the best time for the flow of the braces is when the stress ratio is reduced to 10%, providing a theoretical basis for the future use of such assembled braces.
(3) By comparing the finite element simulation data with the actual monitoring data analysis, the actual strain is overall smaller than the simulated strain, and the rod utilization rate of the overall support frame is low, which provides reference for the optimization of the rod as well as the structural system of such assembled support frames in the future, provides reference for the analysis of the unloading process of the interaction between concrete hardening and bracing and gives a more reasonable flow timing, and provides reference for the study of the dismantling sequence of the frame during flow.
References
[1] Guo Zhidong,Li Hui,Zhou Yanhua. Research on the application of safety technology for the construction of fastening scaffolding in housing construction. Anhui architecture,2019,26(3):41.
[2] Fang B,Yu Hafeng,Ma Kang et al. Research on the bearing mechanism of tall formwork support system for coal tower project. Structural Engineer,2020,36(5):173.
[3] Zhou Guanguan, Wan Jingxin, You Guimao et al. Analysis of the construction process of the open and closed roof of Hangzhou Olympic Sports Tennis Center. Space Structure,2021,27(2):70
[4] Zhang Zichao, Chen Xiangrong, Lin Bing, et al. Study on the stability of axial compression under scaffold riser casing joint. Journal of Building Structures,2022,43(1):228.
[5] Zhang Luying, Liu Changbin, Xu Xiaoming, et al. Finite element analysis of X-pillar and ring-beam fastener-type full-span braced scaffolding for cooling towers. Special Structures,2018,35(6):21.
[6] Liu F, Li WJ, Xu CC. Application of coiled buckle scaffolding in the support system of double curved large span cast-in-place box beam. China Building Metal Structure,2022,No.484(4):59.
[7] Wu Xiufeng,Han Jianlin,Zhao Ke. Analysis of mechanical characteristics of cast-in-place large-span retentions of main girders of wide-span cable-stayed bridges. Spatial Structures,2018,24(2):86.
[8] Lin Yuefu. Analysis of the construction process of the main steel structure of Lusail Stadium. Special structure,2020,37(4):116.
[9]Wang Jinlong. Technical and safety research of tie rod suspension frame system in assembled buildings. China Building Metal Structure,2022,No.484(4):26.
[10] Wang Huake, Tang Xunmeng. Analysis of unloading process of structural support frame of No.2 bridge on Yuhai West Road, Qianwan New Area, Ningbo. China Building Metal Structure,2020,No.466(10):113.
[11] Yan Xuechong, Wang Shufeng, Gong Zheng et al. Construction technology of cast-in-place box culvert bracket erection and pre-pressure in limited space under railway. Engineering quality,2021,39(9):35.
[12] Li M.R., Zhang Q.M.. Research on construction monitoring scheme of Jiangsu Yunjingtai project. Anhui Architecture,2021,28(10):215.
[13] Wu Jun. Exploration of automatic monitoring system for building settlement and tilt. Anhui architecture,2020,27(2):126.
[14] Ye Binglin. Application of socket-type coiled buckle bracing frame for building construction. Engineering quality,2021,39(10):57.
[15] Huang Yulin, Zhang Longlong, Zuo Zibo et al. Real-time monitoring-based control technology for integral steel platform mouldings. Spatial Structures,2021,27(2):83.
[16] Wu Yanli, Yin Suhua, Yin Yujiao. Simulation analysis and construction monitoring of pre-stressed pipe truss structure construction for large span dry coal sheds. Space Structure,2021,27(1):37.
Document information
Published on 12/01/23
Accepted on 26/12/22
Submitted on 24/09/22
Volume 39, Issue 1, 2023
DOI: 10.23967/j.rimni.2023.01.001
Licence: CC BY-NC-SA license
Share this document
claim authorship
Are you one of the authors of this document?
