m (H dashti moved page Andi1 et al 2020a to Andi et al 2021a) |
|||
| (16 intermediate revisions by one other user not shown) | |||
| Line 54: | Line 54: | ||
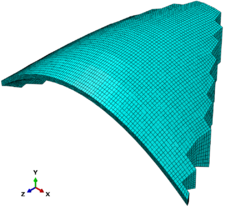
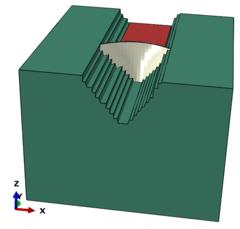
| colspan="2" style="padding:10px;"| '''Figure 1'''. Overview of Karun 3 dam in software and meshing | | colspan="2" style="padding:10px;"| '''Figure 1'''. Overview of Karun 3 dam in software and meshing | ||
|} | |} | ||
| − | |||
===2.1 Evaluated models=== | ===2.1 Evaluated models=== | ||
| Line 127: | Line 126: | ||
● Investigation of displacement distribution in Karun 3 Dam for near and Far-field earthquakes | ● Investigation of displacement distribution in Karun 3 Dam for near and Far-field earthquakes | ||
| − | <div style="text-align: | + | <div id='img-2'></div> |
| − | + | {| style="text-align: center; border: 1px solid #BBB; margin: 1em auto; width: 80%;" | |
| − | + | ||
|- | |- | ||
| − | | [[ | + | |style="padding:10px;"| [[File:Andi1_et_al_2020a_7012_Figure2.png]] |
| − | | | + | |- style="text-align: center; font-size: 75%;" |
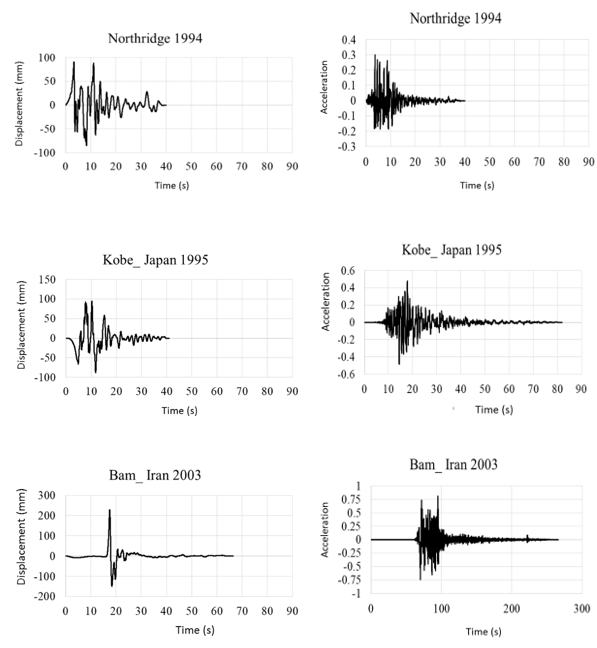
| − | + | | colspan="1" style="padding:10px;"| '''Figure 2'''. Displacement-time and acceleration-time diagrams corresponding to the record of near-field earthquakes | |
| − | + | ||
| − | + | ||
| − | + | ||
| − | | | + | |
| − | + | ||
|} | |} | ||
| − | |||
| − | |||
| − | |||
| − | |||
| − | |||
| − | |||
| − | |||
| − | |||
| − | {| | + | <div id='img-3'></div> |
| + | {| style="text-align: center; border: 1px solid #BBB; margin: 1em auto; width: 80%;" | ||
|- | |- | ||
| − | | [[ | + | |style="padding:10px;"| [[File:Andi1_et_al_2020a_9440_Figure3.png]] |
| − | | | + | |- style="text-align: center; font-size: 75%;" |
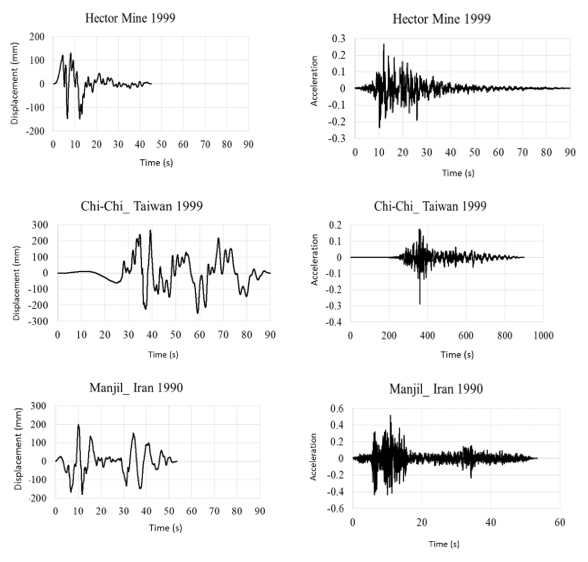
| + | | colspan="1" style="padding:10px;"| '''Figure 3'''. Displacement-time and acceleration-time diagrams for the record of far-field earthquakes | ||
|} | |} | ||
| − | |||
| − | |||
| − | |||
| − | |||
| − | |||
| − | |||
| − | |||
| − | |||
| − | |||
| − | |||
| − | |||
| − | |||
| − | |||
| − | |||
| − | |||
| − | |||
| − | |||
| − | |||
| − | |||
| − | |||
| − | |||
| − | |||
| − | |||
| − | |||
| − | |||
| − | |||
| − | |||
| − | |||
| − | |||
| − | |||
| − | |||
| − | |||
| − | |||
| − | |||
| − | |||
| − | |||
| − | |||
| − | |||
| − | |||
| − | |||
| − | |||
| − | |||
| − | |||
| − | |||
| − | |||
| − | |||
| − | |||
| − | |||
| − | |||
| − | |||
| − | |||
| − | |||
| − | |||
| − | |||
| − | |||
| − | |||
| − | |||
| − | |||
| − | |||
| − | |||
| − | |||
| − | |||
| − | |||
| − | |||
| − | |||
| − | |||
| − | |||
| − | |||
| − | |||
| − | |||
| − | |||
| − | |||
| − | |||
| − | |||
| − | |||
| − | |||
| − | |||
| − | |||
| − | |||
| − | |||
| − | |||
| − | |||
| − | |||
| − | |||
| − | |||
| − | |||
| − | |||
| − | |||
| − | |||
| − | |||
| − | |||
| − | |||
| − | |||
| − | |||
| − | |||
| − | |||
| − | |||
| − | |||
| − | |||
| − | |||
| − | |||
| − | |||
==3. Results and discussion== | ==3. Results and discussion== | ||
| − | ===3.1 | + | ===3.1 Investigation of indices in Karun dam 3=== |
Due to the high volume of water behind the dam and the pressure distribution on the dam body, the highest amount of mises stress produced in the dam body, according to mises stress distribution contour, is 5.97 MPa between different earthquakes. In the Northridge and Kobe near-field earthquake, stress and damage are concentrated on the dam body, near the foundation and dam boundary due to the high dynamic pressure in the fluid and dam body, and in the Bam near-field and Chi-Chi, Manjil and Hector far-field earthquakes, Maximum stress concentration has shifted to the dam bottom. [[#tab-2|Table 2]] shows the distribution of the maximum mises stress index in the Karun 3 Dam in different earthquakes. | Due to the high volume of water behind the dam and the pressure distribution on the dam body, the highest amount of mises stress produced in the dam body, according to mises stress distribution contour, is 5.97 MPa between different earthquakes. In the Northridge and Kobe near-field earthquake, stress and damage are concentrated on the dam body, near the foundation and dam boundary due to the high dynamic pressure in the fluid and dam body, and in the Bam near-field and Chi-Chi, Manjil and Hector far-field earthquakes, Maximum stress concentration has shifted to the dam bottom. [[#tab-2|Table 2]] shows the distribution of the maximum mises stress index in the Karun 3 Dam in different earthquakes. | ||
| + | |||
<div class="center" style="font-size: 75%;">'''Table 2'''. Distribution of maximum mises stress index in Karun 3 dam in different earthquakes</div> | <div class="center" style="font-size: 75%;">'''Table 2'''. Distribution of maximum mises stress index in Karun 3 dam in different earthquakes</div> | ||
| Line 305: | Line 191: | ||
Furthermore, the mises stress results with respect to the maximum compressive strength of the concrete dam for further nondimensionalizing and comprehensibility is considered. Thus, the maximum mises stress at each height of the water behind the dam by the compressive strength of the concrete, which is 24 MPa is divided. The number is multiplied by 100 to give the results as a percentage. As shown in [[#img-4|Figure 4]], if the water height was behind the dam at 87.8% of the total dam height, the Northridge earthquake would increase the stress of 24.88% of the compressive strength of the dam concrete. Next, if Karun 3 is affected by the Kobe, Bam, Hector, Chi-chi, and Manjil earthquakes, the values in [[#tab-3|Table 3]] and the percentages of stress increase are 20/46, 17/5, 15/5, 14/33 and 12/54 percentage of compressive strength of the dam concrete. Due to the fact that the dam is of double curvature type, the dynamic behavior of the pressure distribution at the dam height is non-linear. | Furthermore, the mises stress results with respect to the maximum compressive strength of the concrete dam for further nondimensionalizing and comprehensibility is considered. Thus, the maximum mises stress at each height of the water behind the dam by the compressive strength of the concrete, which is 24 MPa is divided. The number is multiplied by 100 to give the results as a percentage. As shown in [[#img-4|Figure 4]], if the water height was behind the dam at 87.8% of the total dam height, the Northridge earthquake would increase the stress of 24.88% of the compressive strength of the dam concrete. Next, if Karun 3 is affected by the Kobe, Bam, Hector, Chi-chi, and Manjil earthquakes, the values in [[#tab-3|Table 3]] and the percentages of stress increase are 20/46, 17/5, 15/5, 14/33 and 12/54 percentage of compressive strength of the dam concrete. Due to the fact that the dam is of double curvature type, the dynamic behavior of the pressure distribution at the dam height is non-linear. | ||
| − | <div id='img- | + | <div id='img-4'></div> |
{| style="text-align: center; border: 1px solid #BBB; margin: 1em auto; width: auto;max-width: auto;" | {| style="text-align: center; border: 1px solid #BBB; margin: 1em auto; width: auto;max-width: auto;" | ||
|- | |- | ||
| − | |style="padding:10px;"| [[ | + | |style="padding:10px;"| [[File:Andi1_et_al_2020a_9233_Figure4.png]] |
|- style="text-align: center; font-size: 75%;" | |- style="text-align: center; font-size: 75%;" | ||
| colspan="1" style="padding:10px;"| '''Figure 4'''. Relative percentage of mises stress changes in Karun 3 dam | | colspan="1" style="padding:10px;"| '''Figure 4'''. Relative percentage of mises stress changes in Karun 3 dam | ||
| Line 358: | Line 244: | ||
{| style="text-align: center; border: 1px solid #BBB; margin: 1em auto; width: auto;max-width: auto;" | {| style="text-align: center; border: 1px solid #BBB; margin: 1em auto; width: auto;max-width: auto;" | ||
|- | |- | ||
| − | |style="padding:10px;"| [[File: | + | |style="padding:10px;"| [[File:Andi1_et_al_2020a_6881_Figure5.png]] |
<!--|style="padding:10px;"| [[Image:Review_498588852584-image16.png|360px]]--> | <!--|style="padding:10px;"| [[Image:Review_498588852584-image16.png|360px]]--> | ||
|- style="text-align: center; font-size: 75%;" | |- style="text-align: center; font-size: 75%;" | ||
| Line 365: | Line 251: | ||
| − | Investigating the safety of gravity concrete dams, especially under severe loading conditions, has always been a major concern and can be controlled by examining the extent of displacement of the dam. The extent of displacement distribution in the Karun 3 dam crest is illustrated by software with color distribution contour for displacement outcome indicated by (U, Magnitude), and presented in [[#tab-4|Table 4]]. The values shown and presented in the table are for the critical state of the dynamic acceleration of the applied spectrum that the displacement-time diagram during the earthquake is drawn in | + | Investigating the safety of gravity concrete dams, especially under severe loading conditions, has always been a major concern and can be controlled by examining the extent of displacement of the dam. The extent of displacement distribution in the Karun 3 dam crest is illustrated by software with color distribution contour for displacement outcome indicated by (U, Magnitude), and presented in [[#tab-4|Table 4]]. The values shown and presented in the table are for the critical state of the dynamic acceleration of the applied spectrum that the displacement-time diagram during the earthquake is drawn in [[#img-6|Figures 6]] and [[#img-7|7]]. |
<div id='img-6'></div> | <div id='img-6'></div> | ||
| Line 426: | Line 312: | ||
| − | For further non-dimensionalizing the displacement changes of the dam crest, based on the height of the water behind the dam, we targeted the maximum displacement of the dam crest, which is 97.98 mm. Subsequently, each displacement was divided by the maximum displacement and multiplied by 100 to express the results in percentage. As shown in | + | For further non-dimensionalizing the displacement changes of the dam crest, based on the height of the water behind the dam, we targeted the maximum displacement of the dam crest, which is 97.98 mm. Subsequently, each displacement was divided by the maximum displacement and multiplied by 100 to express the results in percentage. As shown in [[#img-8|Figures 8]] and [[#img-9|9]], then if the Northridge, Kobe, Bam, Hector, Chi-chi and Manjil earthquakes are applied the Karun 3 Dam, the percentage of displacement reduction will be 17/45, 20/27, 30/06, 37/56 and 53/61% of maximum displacement are obtained. |
<div id='img-8'></div> | <div id='img-8'></div> | ||
{| style="text-align: center; border: 1px solid #BBB; margin: 1em auto; width: auto;max-width: auto;" | {| style="text-align: center; border: 1px solid #BBB; margin: 1em auto; width: auto;max-width: auto;" | ||
|- | |- | ||
| − | |style="padding:10px;"| | + | |style="padding:10px;"| [[File:Andi1_et_al_2020a_6211_Figure8.png]] |
|- style="text-align: center; font-size: 75%;" | |- style="text-align: center; font-size: 75%;" | ||
| colspan="1" style="padding:10px;"| '''Figure 8'''. Relative percentage of crest displacement in Karun 3 dam | | colspan="1" style="padding:10px;"| '''Figure 8'''. Relative percentage of crest displacement in Karun 3 dam | ||
| Line 492: | Line 378: | ||
{| style="text-align: center; border: 1px solid #BBB; margin: 1em auto; width: auto;max-width: auto;" | {| style="text-align: center; border: 1px solid #BBB; margin: 1em auto; width: auto;max-width: auto;" | ||
|- | |- | ||
| − | |style="padding:10px;"| [[ | + | |style="padding:10px;"| [[File:Andi1_et_al_2020a_9019_Figure10.png]] |
|- style="text-align: center; font-size: 75%;" | |- style="text-align: center; font-size: 75%;" | ||
| colspan="1" style="padding:10px;"| '''Figure 10'''. Crest Relative displacement percent perpendicular to Karun 3 dam | | colspan="1" style="padding:10px;"| '''Figure 10'''. Crest Relative displacement percent perpendicular to Karun 3 dam | ||
| Line 564: | Line 450: | ||
{| style="text-align: center; border: 1px solid #BBB; margin: 1em auto; width: auto;max-width: auto;" | {| style="text-align: center; border: 1px solid #BBB; margin: 1em auto; width: auto;max-width: auto;" | ||
|- | |- | ||
| − | |style="padding:10px;"| [[ | + | |style="padding:10px;"| [[File:Andi1_et_al_2020a_5189_Figure13.png]] |
|- style="text-align: center; font-size: 75%;" | |- style="text-align: center; font-size: 75%;" | ||
| colspan="1" style="padding:10px;"| '''Figure 13'''. Relative percent of maximum stress in Karun 3 dam | | colspan="1" style="padding:10px;"| '''Figure 13'''. Relative percent of maximum stress in Karun 3 dam | ||
| Line 610: | Line 496: | ||
| − | In general, we divided the main strain values on the dam body at each height of water behind the dam to target strain. The number multiplied by 100 to give the results as a percentage. The target strain is selected based on the stress-strain behavior of the concrete, which is 0.0025. At this strain, the concrete has the greatest resistance and then follows a downward trend. As shown in | + | In general, we divided the main strain values on the dam body at each height of water behind the dam to target strain. The number multiplied by 100 to give the results as a percentage. The target strain is selected based on the stress-strain behavior of the concrete, which is 0.0025. At this strain, the concrete has the greatest resistance and then follows a downward trend. As shown in [[#img-14|Figures 14]] and [[#img-15|15]], then if the Northridge, Kobe, Bam, Hector, Chi-Chi and Manjil earthquakes are applied to the Karun 3 Dam, the percentage of main strain reduction is 26/26, 60/60, 2/55, 1/66, 1/60 and 1/44 percent of the dam target strain (0.0025). |
<div id='img-14'></div> | <div id='img-14'></div> | ||
{| style="text-align: center; border: 1px solid #BBB; margin: 1em auto; width: auto;max-width: auto;" | {| style="text-align: center; border: 1px solid #BBB; margin: 1em auto; width: auto;max-width: auto;" | ||
|- | |- | ||
| − | |style="padding:10px;"| [[ | + | |style="padding:10px;"| [[File:Andi1_et_al_2020a_5577_Figure14.png]] |
|- style="text-align: center; font-size: 75%;" | |- style="text-align: center; font-size: 75%;" | ||
| colspan="1" style="padding:10px;"| '''Figure 14'''. Relative percent of maximum strain in Karun 3 dam | | colspan="1" style="padding:10px;"| '''Figure 14'''. Relative percent of maximum strain in Karun 3 dam | ||
| Line 629: | Line 515: | ||
|} | |} | ||
| − | ==4. | + | ==4. Conclusions== |
Given that the scope of the results and recommendations is limited to the samples considered for the analyses, it is expected that the results will have a more comprehensive application than those considered in the present analyses. The results of the Karun 3 double curvature arch dam are as follows: | Given that the scope of the results and recommendations is limited to the samples considered for the analyses, it is expected that the results will have a more comprehensive application than those considered in the present analyses. The results of the Karun 3 double curvature arch dam are as follows: | ||
| Line 647: | Line 533: | ||
- The general period of the Karun 3 Dam is affected by the deformation of the residue and the length of the loading period, thereby causing various zones of the Karun 3 Dam to suffer. As the loading period length increases, the loss of resistance and damage are transferred from the dam bottom to the middle and crest of the dam. | - The general period of the Karun 3 Dam is affected by the deformation of the residue and the length of the loading period, thereby causing various zones of the Karun 3 Dam to suffer. As the loading period length increases, the loss of resistance and damage are transferred from the dam bottom to the middle and crest of the dam. | ||
| − | == | + | ==References== |
| + | <div class="auto" style="text-align: left;width: auto; margin-left: auto; margin-right: auto;font-size: 85%;"> | ||
| − | [1] Westergard H. M. | + | [1] Westergard H.M. Water pressure on dams during earthquakes. Trans. ASCE, 98:418-432, 1933. |
| − | [2] Chopra A. K. | + | [2] Chopra A.K. Hydrodynamic pressure on dams during earthquakes. ASCE Proc. Jour. Engg. Mech., 93:205-223, 1967. |
| − | [3] Chopra A. K. | + | [3] Chopra A.K. Earthquake behavior of reservoir-dam systems. ASCE, 94:1475-1500, 1968. |
| − | [4] Chopra A. K. | + | [4] Chopra A.K. Earthquakes response of concrete gravity dams. Journal of the Engineering Mechanics Division, 96(4):443-454, 1970. |
| − | [5] Chakrabarti P, Chopra A. K | + | [5] Chakrabarti P., Chopra A.K. Hydrodynamic pressures and response of gravity dams to vertical earthquake component. Earthquake Engineering and Structural Dynamics, 1(4):325-335, 1972. |
| − | [6] El-Aidi B, Hall J. F | + | [6] El-Aidi B., Hall J.F. Non-linear earthquake response of concrete gravity dams. Part 1: Modelling. Earthquake Engineering and Structural Dynamics, 18(6):837-851, 1989. |
| − | [7] Calayir Y. Dumanoglu A | + | [7] Calayir Y., Dumanoglu A. Static and dynamic analysis of fluid and fluid-structure systems by the Lagrangian method. Computers and Structures, 49:625-632, 1993. |
| − | [8] Ahmadi M. T. | + | [8] Ahmadi M.T. New method of analysis for arch dams. Ph.D thesis, 1988. |
| − | [9] Navayi Neya B. | + | [9] Navayi Neya B. Mathematical modeling of concrete graviy dams under earthquake loading considering construction joints. Ph.D thesis, Moscow Power Engineering Institute, 1998. |
| − | [10] Jamshidi A, Navaeeinia B | + | [10] Jamshidi A., Navaeeinia B. Dynamic analysis of weighted concrete dams with reservoir modeling by Lagrangian and Eulerian methods. Journal of the Faculty of Engineering, University of Tehran, 41:724-709, 2007. |
| − | [11] Khanmohammadi L | + | [11] Khanmohammadi L. Evaluation of Lagrangian and Eulerian methods in response of weighted concrete dams, including dam-reservoir-foundation interaction under earthquake. Modarres Omran Scientific Journal: 116-107, 2011. |
| − | + | [12] Bogdanoff J.L., Goldberg J.E., Schiff A.J. The Effect of ground transmission time on the response of long structures. Bull. Seism. Soc. Am., 55:627-640, 1965. | |
| − | [13] Dumanoglu A. A, Severn R. T | + | [13] Dumanoglu A.A., Severn R.T. Dynamic response of dams and other structures to differential ground motion. Proc. Instn. Civ. Eng., Part 2, 77(3):333-352, 1984. |
| − | [14] Santa-Cruz S, Heredia-Zavoni E, Harichandran R. S | + | [14] Santa-Cruz S., Heredia-Zavoni E., Harichandran R.S. Low-frequency behavior coherency for strong ground motion in Mexico City and Japan. 12WCEE, No.0076, 2000. |
| − | [15] Chen M. T, Harichandran R. S | + | [15] Chen M.T., Harichandran R.S. Sensitivity of earth dam seismic response to ground motion coherency. Geotechnical Earthquake Engineering and Soil Dynamic III, pp. 914-925, 1998. |
| − | [16] Ates S, Dumanoglu A A, Bayraktar A | + | [16] Ates S., Dumanoglu A.A., Bayraktar A. Stochastic response of seismically isolated highway bridges with friction pendulum systems to spatially varying earthquake ground motions. Engineering Structures, 27:1843–1858, 2005. |
| − | [17] Wang J. T, Chopra A. K | + | [17] Wang J.T., Chopra A.K. Linear analysis of concrete arch dams including dam-water-foundation rock interaction considering spatially varying ground motion. Earthquake Engineering and Structural Dynamics, 39(7):731-750, 2010. |
| − | [18] Moradloo | + | [18] Moradloo J. Analysis of nonlinear dynamic behavior of arched concrete dams in large displacement range. Ph.D thesis, Tarbiat Modarres University, 2010. |
| − | [19] Khatibinia M., Chiti H., Akbarpour A, Naseri | + | [19] Khatibinia M., Chiti H., Akbarpour A., Naseri H.R. Shape optimization of concrete gravity dams considering dam–water–foundation interaction and nonlinear effects. Iran University of Science & Technology, 6(1):115-134, 2016. |
| − | [20] Løkke A, Chopra A.K | + | [20] Løkke A., Chopra A.K. Direct finite element method for nonlinear earthquake analysis of 3‐dimensional semi‐unbounded dam–water–foundation rock systems. Earthquake Engineering & Structural Dynamics, 47(5): 1309-1328, 2018. |
| − | [21] Wang J.T, Jin A.Y, Du X.L, Wu M.X | + | [21] Wang J.T., Jin A.Y, Du X.L, Wu M.X. Scatter of dynamic response and damage of an arch dam subjected to artificial earthquake accelerograms. Soil Dynamics and Earthquake Engineering, 87:93-100, 2016. |
| − | [22] Ouzandja D., Tiliouine B, Ouzandja T. | + | [22] Ouzandja D., Tiliouine B., Ouzandja T. Nonlinear seismic response of concrete gravity dams. In GeoMEast 2017 International Congress and Exhibition, Sustainable Civil Infrastructures: Innovative Infrastructure Geotechnology, Sharm Elsheikh, Egypt, July 15-19, pp. 13-21, Springer, Cham, 2017. |
| − | [23] Mirzabozorg H., Varmazyari M, Gharehbaghi | + | [23] Mirzabozorg H., Varmazyari M., Gharehbaghi S.A. Seismic evaluation of existing arch dams and massed foundation effects. Soils and Foundations, 56(1):19-32, 2016. |
| − | [24] Hibbitt, Karlson, Sorenson Inc. ABAQUS version 14/6: theory manual, users' manual, verification manual and example problems manual. Hibbitt, Karlson and Sorenson Inc. | + | [24] Hibbitt, Karlson, Sorenson Inc. ABAQUS version 14/6: theory manual, users' manual, verification manual and example problems manual. Hibbitt, Karlson and Sorenson Inc., 2005. |
| + | |||
| + | </div> | ||
Latest revision as of 17:53, 17 December 2021
Abstract
One of the factors affecting the dynamic state of the dams that may cause damages to the dam is the change under the spatial and temporal Excitation of the Heterogeneous ground Motion. Therefore, in different states the stress, strain, displacement and hydrostatic pressure indices are changed and led to serious damage to the dam. In this study, Karun 3 dam is investigated which is classified as one of the double curvature arch and gravity dams. For this purpose, using ABAQUS software, these indices have been investigated and controlled and the effectiveness of indices in this dam has been investigated in nonlinear dynamic seismic state. Northridge, Kobe, Bam, Hector, Chi-Chi and Manjil earthquakes are applied to the Karun 3 Dam. The results showed that due to the large amplitude and periodicity of the near-fault mappings, under the near-field earthquake, the deformation of the Karun 3 dam is greater than the far-field fault zone. As the height of the Karun 3 Dam rises, the effectiveness of far-field earthquakes declines and near-field earthquakes show more impact on the structure. In far-field earthquakes, stress changes due to earthquakes with maximum dynamic acceleration, the relative percentage of mises stress change is 15.5% and maximum dam crest change is 68.5 mm, and for near-field earthquakes is 25% and maximum dam crest change is 100 mm.
Keywords: Karun 3 Dam, gravity concrete dam, dynamic analysis, finite element method, nonlinear behavior
1. Introduction
The dams are built to regulate surface currents and optimize water usage and power generation. Dams are long-lived structures that due to scientific advances and the emergence of new materials have existed in modern dam industry for less than a century. The analysis of dam reservoir system was relied on earthquakes analytical methods. These methods are first expressed based on problem assumptions, governing equations and boundary conditions, and then the governing differential equations are directly solved. For the first time in 1933, Westergaard used an analytical method with some simplified assumptions to dynamically analyze the gravity concrete dams to determine the hydrodynamic pressure of the reservoir under harmonic vibrations of the ground. Also, proposed the added mass approach as an approximate method for considering the hydrodynamic pressure applied on the vertical face upstream dam. The Westergaard analytical method is limited to stimuli with a smaller period than the reservoir period [1]. Chopra et al. in 1967, 1970, and 1971, determined the hydrodynamic pressure applied to the dam for low-period excitations by removing the limitations of the Westgard relationship by considering the flexibility of the dam and the vertical component of the earthquake [2-5]. El Eidy and Hall [6], Claire and Domangelo [7], Ahmadi et al. [8] used the Lagrangian method to analyze the dam dynamically.
Ahmadi and Navai Nia applied this method to the arch dams and gravity dams, respectively [9]. It should be noted that the results of the finite element analysis of the reservoir and dam in the Eulerian and Lagrangian methods are not very different, so the Lagrangian method can be used to reduce the computational volume [10,11]. In recent decades, studies have been carried out on the effect of non-uniform excitation on structures which further implications for dams are addressed. Non-uniform excitation, also referred to as multi-support excitation, was first introduced by Bogdanov in 1965. He stated that if the free-field motion of the ground at different points in the supports is known, the structural response can be calculated by analyzing the time or frequency domain [12]. Doomanaglu et al. [13] stated that the impact of an earthquake on a structure depends on the velocity of the earthquake propagation and the dimensions of the structure. Therefore, the response of a structure to loose clay soil with low earthquake propagation velocity differs from the response of the same structure when built on granite rocks, and this difference increases with increasing structural length. He used a stochastic analysis method for dynamic analysis of structures and obtained the response of dams and other structures only under non-uniform temporal excitation without considering spatial excitation. Santa-Cruz et al. (2000) have shown that the two models of Herichandran and Vanmark and the Hindi and Novak models are more accurate than the other models [14]. Chen and Herichandran in 1998, based on studies of long structures, stated that during an earthquake, Changes depending on the situations such as extent of the structure, its surroundings, different properties of the foundations, the effect of the wave path, the inconsistency and integration of the site, have been occurred in earthquake inlet excitation r at different points in the substrate. Therefore assumption of uniform excitation contain approximate [15]. Ates et al. [16] applied nonlinear excitation modeling to investigate the probable response of highway bridges, considering time delay, bedding nonlinearity and seismic wave reduction, and the use of spectral density function. They used the Herichandran and Vanmark models to consider seismic wave reduction. In 2010, Wang and Chopra also investigated the linear dynamic response of several arc dams under non-uniform excitation by considering the reservoir dam interaction [17]. Ghaemians et al. also investigated the seismic response of the Pakuma arc concrete dam under non-uniform excitation. By analyzing the total displacement of non-constrained degrees of freedom to the quasi-static and dynamic displacements and solving the dynamic equilibrium equation of motion, he obtained the dynamic, quasi-static displacement and the whole dam response based on linear analysis and obtained the results were compared and matched well with The existing recorded values and concluded that the quasi-static displacement of the dam comprises a large part of its total displacement [18]. Khatibinia et al. [19] conducted a study on the optimization of the shape of concrete gravity dams with regard to the interaction effect of the dam, water, foundation and nonlinear effects. In this study, we focus on optimizing the shape of concrete gravity dams with respect to dam-water interaction and the nonlinear effects of earthquake exposure. Luck et al. [20] conducted a study on the direct finite element method for nonlinear earthquake analysis of dam-water and rock foundation systems in a 3D environment. A straightforward finite element method for nonlinear earthquake analysis in dam-water-rock systems in 2D environments has recently been proposed. The analysis method, using viscous damping boundaries, identifies seismic inputs for modeling seismic entrances as effective earthquake forces at these boundaries. Wang et al., [21] conducted a study on dynamic response scattering and arch dam damage exposed to synthetic earthquake accelerometers. In the current engineering approach, synthetic earthquake accelerometers are widely used in the seismic design of new dams. This study aimed at investigating the seismic response and sensitivity of arch dams to artificial ground motions. A total of 32 accelerometers are constructed based on the artificial design and the acceleration response spectrum, and the nonlinear dynamic response of the Dagangshan Dam, an arch dam in southwest China, is investigated while exposing to these synthetic accelerators. Ouzandja et al. [22] conducted a study on the nonlinear seismic response in concrete gravity dams. This paper aims to provide a nonlinear seismic response of concrete gravity dams due to the interaction between the dam and the foundation. For these purposes, the Oued Fodda Concrete Dam, located in Chlef (northwest Algeria), was selected as the sample. In 2016, Mirzabozorg et al. conducted a study on the seismic evaluation of existing arch dams and mass effects. In this study, the effects of massed foundation on the nonlinear seismic response of the existing arch dam are investigated. A theory has been used to model the nonlinear behavior of massed concrete in a three-dimensional space that is capable of modeling cracking/crushing under static and dynamic conditions. The openings and sliding of the dam were also considered in the analysis. The reservoir is assumed to be compressible and modeled using the finite element method with appropriate boundary conditions. Dez Arch dam was selected for the case study and the analysis was performed with the maximum reliable earthquake [23].
In this research, it is aimed to analyze three-dimensional models and select the appropriate model based on uniform and non-uniform temporal and spatial excitation of Karun 3 double curvature arch dam which is under heterogeneous motion of faults and micro faults based on earthquake acceleration. Then, the computational model for nonlinear static and dynamic analysis of arch concrete dams is proposed and their behavior under normal motion under uniform and non-uniform excitations is studied and its influence by acceleration due to the main fault located at or near the dam is studied. Moreover, the modeling of micro fault motion in different ways on arch concrete dams is presented and the results of the effect of other parameters on dam behavior are presented.
2. Material and methods
Geometrical complexity, complex behavior of matter, boundary conditions, as well as the variations in the loads present in the problem cause difficulties to achieve the exact solution for the problem. Employing acceptable approximation solutions in a finite period of time is a great opportunity to solve these problems. The finite element approach is one of the best choices in this field. In the present study, ABAQUS finite element software 6.14 was used for modeling the Karun 3 dam behavior [24]. Given the numerical nature of the research methodology in the current study, some assumptions are needed to simplify the numerical analysis. The assumptions that are considered can be linear and nonlinear behavior of materials and consideration of fluid, foundation and dam interactions. First, the elastic behavior model is applied to soil behavior. In the second step, to better understand the actual behavior of soil, the Mohr-Coulomb elastoplastic model for soil was used. The Mohr-Coulomb elastoplastic model is one of the most important models used so far for earth or rock materials and its results have shown good agreement with what has happened in nature.
For modeling of concrete in ABAQUS with respect to the stress- strain curve of the concrete, it can be seen that this material exhibits linear behavior but then the concrete behavior will be completely nonlinear and for the nonlinear part of the concrete, behavior model of damaged plastic concrete is used. Structural elements commonly are used in numerical analysis for the dam and solid element with 8-Node reduced integration (C3D8R) is applied in concrete and foundation simulation and Eulerian element is used for fluid. An overview of the model is shown in Figure 1.
|
|
| Figure 1. Overview of Karun 3 dam in software and meshing | |
2.1 Evaluated models
The basis of the force to overcome the water pressure in these dams is the transfer of this force to the valley walls and in fact the geometric shape of the dam. These dams, at least on a large scale, are often made of unreinforced concrete. In order to prevent the various concrete surfaces from laminating each other, many large dams of this type are layered and usually concreted into 2 or 3-meter layers. The surface of each concrete layer is immediately washed to adhere to the next concrete (step) to the previous concrete and to prevent laminating of the concrete surfaces on top of each other. These dams are made of the block by block and cement slurry is injected at the end between the blocks, called joints, to make the dam creation seamlessly. Karun 3 Dam was built on the Karun River, 28 kilometers from Izeh City. It is Iran's largest double curvature arch concrete dam and the fifth-highest dam which is a source of hydropower. To investigate the different indices in the Karun 3 Dam in dynamic mode, 6 earthquake records with their characteristics are presented in Table 1.
| Earthquake Name | Year | Station Name | Magnitude | Mechanism | Rjb (km) | Rrup (km) |
|---|---|---|---|---|---|---|
| Chi-Chi_ Taiwan | 1999 | CHY029 | 7.62 | Reverse Oblique | 10.96 | 10.96 |
| Manjil_ Iran | 1990 | Abbar | 7.37 | strike slip | 12.55 | 12.55 |
| Hector Mine | 1999 | Hector | 7.13 | strike slip | 10.35 | 11.66 |
| Northridge-01 | 1994 | Pacoima Kagel Canyon | 6.69 | Reverse | 5.26 | 7.26 |
| Bam_ Iran | 2003 | Bam | 6.6 | strike slip | 0.05 | 1.7 |
| Kobe_ Japan | 1995 | Nishi-Akashi | 6.9 | strike slip | 7.08 | 7.08 |
The displacement-time and acceleration-time diagrams for near-fault earthquakes is shown in Figure 2, and the displacement-time and acceleration-time diagrams for far-field earthquakes is shown in Figure 3. Due to the fact that dam behavior depends on various factors such as materials, geometrical characteristics, loading method and so on, in this research, the following parameters are investigated:
● Investigation of stress distribution in Karun 3 Dam for near and far-field earthquakes
● Investigation of strain distribution in Karun 3 dam for near and far-field earthquakes
● Investigation of pressure distribution in Karun 3 Dam for near and far-field earthquakes
● Investigation of displacement distribution in Karun 3 Dam for near and Far-field earthquakes
|
| Figure 2. Displacement-time and acceleration-time diagrams corresponding to the record of near-field earthquakes |
|
| Figure 3. Displacement-time and acceleration-time diagrams for the record of far-field earthquakes |
3. Results and discussion
3.1 Investigation of indices in Karun dam 3
Due to the high volume of water behind the dam and the pressure distribution on the dam body, the highest amount of mises stress produced in the dam body, according to mises stress distribution contour, is 5.97 MPa between different earthquakes. In the Northridge and Kobe near-field earthquake, stress and damage are concentrated on the dam body, near the foundation and dam boundary due to the high dynamic pressure in the fluid and dam body, and in the Bam near-field and Chi-Chi, Manjil and Hector far-field earthquakes, Maximum stress concentration has shifted to the dam bottom. Table 2 shows the distribution of the maximum mises stress index in the Karun 3 Dam in different earthquakes.
| Maximum pressure altitude of dam crest (m) |
Zero pressure altitude of dam crest (m) |
Type | Maximum Mises Stress (MPa) |
|---|---|---|---|
| -205 | -25 | Northbridge | 5.97 |
| -205 | -25 | Kobe | 4.91 |
| -205 | -25 | Bam | 4.2 |
| -205 | -25 | Hector | 3.72 |
| -205 | -25 | Chi-Chi | 3.44 |
| -205 | -25 | Manjil | 3.01 |
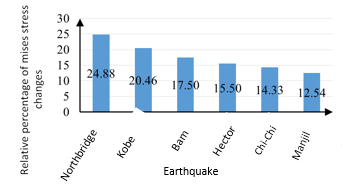
Furthermore, the mises stress results with respect to the maximum compressive strength of the concrete dam for further nondimensionalizing and comprehensibility is considered. Thus, the maximum mises stress at each height of the water behind the dam by the compressive strength of the concrete, which is 24 MPa is divided. The number is multiplied by 100 to give the results as a percentage. As shown in Figure 4, if the water height was behind the dam at 87.8% of the total dam height, the Northridge earthquake would increase the stress of 24.88% of the compressive strength of the dam concrete. Next, if Karun 3 is affected by the Kobe, Bam, Hector, Chi-chi, and Manjil earthquakes, the values in Table 3 and the percentages of stress increase are 20/46, 17/5, 15/5, 14/33 and 12/54 percentage of compressive strength of the dam concrete. Due to the fact that the dam is of double curvature type, the dynamic behavior of the pressure distribution at the dam height is non-linear.
|
| Figure 4. Relative percentage of mises stress changes in Karun 3 dam |
| Maximum pressure altitude of dam crest (m) |
Zero pressure altitude of dam crest (m) |
Type | Hydrostatic pressure distribution along height (Pa) |
|---|---|---|---|
| -205 | -25 | Northbridge | 2.17E+06 |
| -205 | -25 | Kobe | 1.92E+06 |
| -205 | -25 | Bam | 1.68E+06 |
| -205 | -25 | Hector | 1.43E+06 |
| -205 | -25 | Chi-Chi | 1.19E+06 |
| -205 | -25 | Manjil | 8.25E+05 |
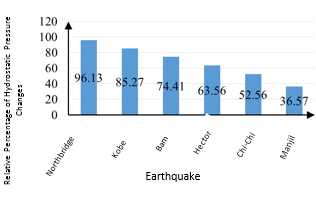
In general, to estimate the pressure values at each height behind the dam, we divided the total pressure by the assumed line at a height of 230 m which is 2,563 MPa. The number multiplied by 100 to give the results as a percentage. As shown in Figure 5, if the Northridge, Kobe, Bam, Hector, Chi-Chi and Manjil earthquakes are applied to the Karun 3 Dam, the percentage of pressure loss is 20/46, 17/5, 15/5, 14.33 and 12.54 % of maximum dam pressure is obtained.
|
| Figure 5. Relative percentage of hydrostatic pressure changes in Karun 3 dam |
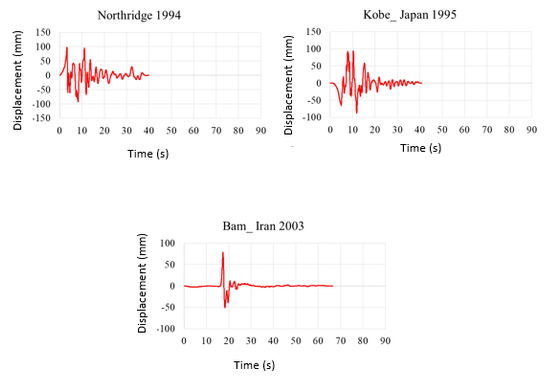
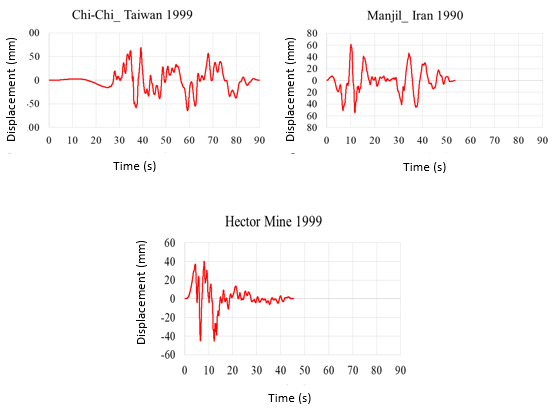
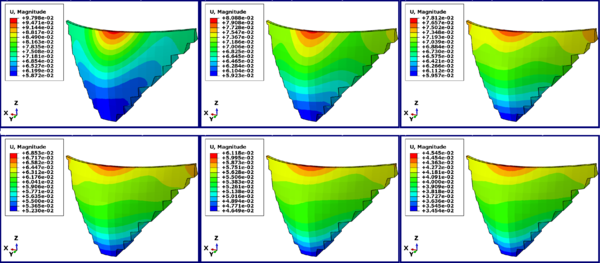
Investigating the safety of gravity concrete dams, especially under severe loading conditions, has always been a major concern and can be controlled by examining the extent of displacement of the dam. The extent of displacement distribution in the Karun 3 dam crest is illustrated by software with color distribution contour for displacement outcome indicated by (U, Magnitude), and presented in Table 4. The values shown and presented in the table are for the critical state of the dynamic acceleration of the applied spectrum that the displacement-time diagram during the earthquake is drawn in Figures 6 and 7.
|
| Figure 6. Displacement time force diagram of Karun 3 dam crest in nonlinear dynamic analysis of near field |
|
| Figure 7. Displacement time force diagram of Karun 3 dam crest in nonlinear dynamic analysis of far-field |
| Maximum pressure altitude of dam crest (m) |
Zero pressure altitude of dam crest (m) |
Type | Crest displacement (mm) |
|---|---|---|---|
| -205 | -25 | Northbridge | 97.98 |
| -205 | -25 | Kobe | 80.88 |
| -205 | -25 | Bam | 78.12 |
| -205 | -25 | Hector | 68.53 |
| -205 | -25 | Chi-Chi | 61.18 |
| -205 | -25 | Manjil | 45.45 |
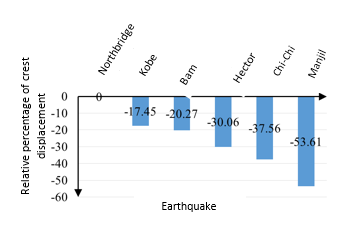
For further non-dimensionalizing the displacement changes of the dam crest, based on the height of the water behind the dam, we targeted the maximum displacement of the dam crest, which is 97.98 mm. Subsequently, each displacement was divided by the maximum displacement and multiplied by 100 to express the results in percentage. As shown in Figures 8 and 9, then if the Northridge, Kobe, Bam, Hector, Chi-chi and Manjil earthquakes are applied the Karun 3 Dam, the percentage of displacement reduction will be 17/45, 20/27, 30/06, 37/56 and 53/61% of maximum displacement are obtained.
|
| Figure 8. Relative percentage of crest displacement in Karun 3 dam |
|
| Figure 9. Distribution contour of displacement changes in Karun 3 dam crest |
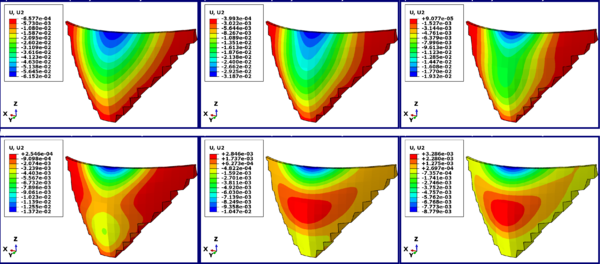
In this section, the distribution of displacements in the Karun 3 crest is illustrated by the software with color distribution contours for the displacement shown by (U, U2) in Figure 11 and in Table 5.
| Maximum pressure altitude of dam crest (m) |
Zero pressure altitude of dam crest (m) |
Type | Displacement index perpendicular to the Karun 3 Dam crest (mm) |
|---|---|---|---|
| -205 | -25 | Northbridge | 61.52 |
| -205 | -25 | Kobe | 31.87 |
| -205 | -25 | Bam | 19.32 |
| -205 | -25 | Hector | 13.72 |
| -205 | -25 | Chi-Chi | 10.47 |
| -205 | -25 | Manjil | 8.779 |
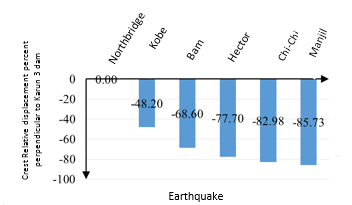
For further non-dimensionalizing the displacement perpendicular to the Karun 3 dam crest in terms of the height of the water behind the dam we targeted the maximum displacement of the dam crest which is 61.52 mm. Each displacement (U2) is then divided by the maximum displacement and multiplied by the number 100 to express the results as a percentage. As shown in Figure 10, then if the Northridge, Kobe, Bam, Hector, Chi-chi, and Manjil earthquakes are applied to the Karun 3 Dam, the percentage of displacement reduction of 48/20, 68/60, 77/70, 82/98 and 85/73% of maximum displacement were obtained.
|
| Figure 10. Crest Relative displacement percent perpendicular to Karun 3 dam |
|
| Figure 11. Distribution contour of crest displacement changes perpendicular to the Karun 3 dam |
Here, the main maximum stress index in Karun 3 Dam is investigated. In this case, changes in earthquake type in the near and far-field were also studied. The position of zero pressure altitude is -25 m and maximum pressure altitude is -205 m.
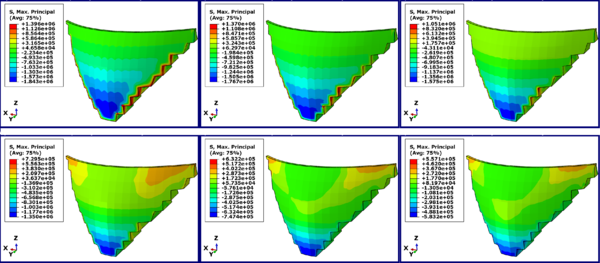
The safety of gravity concrete dams is another important index of maximum stress which is discussed below. The distribution of the maximum stress in the Karun 3 Dam crest is illustrated by the software with the color distribution contour for the maximum stress shown by (S, Max. Principal) in Figure 12 and Table 6.
|
| Figure 12. Distribution Contour of changes in main maximum stress in Karun 3 dam |
| Maximum pressure altitude of dam crest (m) |
Zero pressure altitude of dam crest (m) |
The height of water behind the dam (m) |
Main maximum stress (MPa) |
|---|---|---|---|
| -205 | -25 | Northbridge | 1.84 |
| -205 | -25 | Kobe | 1.77 |
| -205 | -25 | Bam | 1.57 |
| -205 | -25 | Hector | 1.35 |
| -205 | -25 | Chi-Chi | 0.75 |
| -205 | -25 | Manjil | 0.58 |
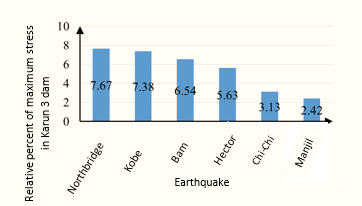
For further non-dimensionalizing the main maximum stress index in the Karun 3 dam in terms of the height of the water behind the dam, we targeted the compressive strength of the dam concrete, which is 24 MPa. In the following, each of the main maximum stress indices in Karun 3 dam was divided by the compressive strength of the dam concrete and multiplied by 100 to give the results as a percentage. As shown in Figure 13, then if the Northridge, Kobe, Bam, Hector, Chi-chi, and Manjil earthquakes are applied to the Karun 3 Dam, the percentage of the main maximum stress reduction will be 7.67, 7.38, 54 6.6, 5.63, 3.13 and 2.42% of the compressive strength of concrete.
|
| Figure 13. Relative percent of maximum stress in Karun 3 dam |
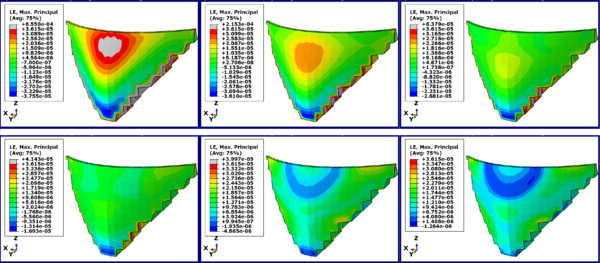
In this section, the main maximum strain index in Karun 3 Dam is investigated. In this case, water level changes in Karun 3 Dam from 223 m to 98 m in 6 states were selected. The position of zero pressure altitude is -7 m and the maximum pressure altitude is-230 m. Another important indicator in controlling the behavior of the dam is the main maximum strain which is discussed below. The maximum strain distribution in Karun 3 dam by software with color distribution contour for main maximum strain in the dam is shown by (LE, Max. Principal) in Figure 15 and in Table 7.
| Maximum pressure altitude of dam crest (m) |
Zero pressure altitude of dam crest (m) |
The height of water behind the dam (m) |
Main maximum stress (MPa) |
|---|---|---|---|
| -205 | -25 | Northbridge | 6.55E-04 |
| -205 | -25 | Kobe | 2.15E-04 |
| -205 | -25 | Bam | 6.38E-05 |
| -205 | -25 | Hector | 4.14E-05 |
| -205 | -25 | Chi-Chi | 4.00E-05 |
| -205 | -25 | Manjil | 3.61E-05 |
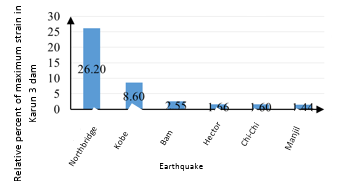
In general, we divided the main strain values on the dam body at each height of water behind the dam to target strain. The number multiplied by 100 to give the results as a percentage. The target strain is selected based on the stress-strain behavior of the concrete, which is 0.0025. At this strain, the concrete has the greatest resistance and then follows a downward trend. As shown in Figures 14 and 15, then if the Northridge, Kobe, Bam, Hector, Chi-Chi and Manjil earthquakes are applied to the Karun 3 Dam, the percentage of main strain reduction is 26/26, 60/60, 2/55, 1/66, 1/60 and 1/44 percent of the dam target strain (0.0025).
|
| Figure 14. Relative percent of maximum strain in Karun 3 dam |
|
| Figure 15. Contour Distribution of Maximum Stress Changes in Karun 3 Dam |
4. Conclusions
Given that the scope of the results and recommendations is limited to the samples considered for the analyses, it is expected that the results will have a more comprehensive application than those considered in the present analyses. The results of the Karun 3 double curvature arch dam are as follows:
-Due to the large amplitude and period of near-fault mappings, under the near-field earthquake, the deformation of the Karun 3 Dam is greater than the far-field zone.
-As the height of the Karun 3 Dam rises, the effectiveness of far-field earthquakes is reduced and near-field earthquakes show more impact on structures. For example, the effect of the Kobe near-field earthquake for a height of 180 meters is almost twice that of the surrounding area. Due to the long Karun 3 Dam period, it has been subject to relative drift and a longer period in near- field earthquakes.
- In far-field earthquakes, stress changes due to the most dynamic acceleration earthquakes, the relative percentage of mises stress changes was 15.5% and for near-field earthquakes was 25% at most.
- In far-field earthquakes, dam crest changes due to the most dynamic acceleration, 68.5 mm maximum and 100 mm maximum for near earthquakes.
- In distant wake earthquakes, with respect to the most dynamic acceleration, for far-field earthquakes, the relative percentage of strain changes was 1.66% and for near-field earthquakes 26% at most.
- Dynamic response and damage severity in near-field earthquakes relative to far-field earthquakes with strain difference of 1.66 to 26% indicate significant damage and failure in near-field earthquakes.
- The general period of the Karun 3 Dam is affected by the deformation of the residue and the length of the loading period, thereby causing various zones of the Karun 3 Dam to suffer. As the loading period length increases, the loss of resistance and damage are transferred from the dam bottom to the middle and crest of the dam.
References
[1] Westergard H.M. Water pressure on dams during earthquakes. Trans. ASCE, 98:418-432, 1933.
[2] Chopra A.K. Hydrodynamic pressure on dams during earthquakes. ASCE Proc. Jour. Engg. Mech., 93:205-223, 1967.
[3] Chopra A.K. Earthquake behavior of reservoir-dam systems. ASCE, 94:1475-1500, 1968.
[4] Chopra A.K. Earthquakes response of concrete gravity dams. Journal of the Engineering Mechanics Division, 96(4):443-454, 1970.
[5] Chakrabarti P., Chopra A.K. Hydrodynamic pressures and response of gravity dams to vertical earthquake component. Earthquake Engineering and Structural Dynamics, 1(4):325-335, 1972.
[6] El-Aidi B., Hall J.F. Non-linear earthquake response of concrete gravity dams. Part 1: Modelling. Earthquake Engineering and Structural Dynamics, 18(6):837-851, 1989.
[7] Calayir Y., Dumanoglu A. Static and dynamic analysis of fluid and fluid-structure systems by the Lagrangian method. Computers and Structures, 49:625-632, 1993.
[8] Ahmadi M.T. New method of analysis for arch dams. Ph.D thesis, 1988.
[9] Navayi Neya B. Mathematical modeling of concrete graviy dams under earthquake loading considering construction joints. Ph.D thesis, Moscow Power Engineering Institute, 1998.
[10] Jamshidi A., Navaeeinia B. Dynamic analysis of weighted concrete dams with reservoir modeling by Lagrangian and Eulerian methods. Journal of the Faculty of Engineering, University of Tehran, 41:724-709, 2007.
[11] Khanmohammadi L. Evaluation of Lagrangian and Eulerian methods in response of weighted concrete dams, including dam-reservoir-foundation interaction under earthquake. Modarres Omran Scientific Journal: 116-107, 2011.
[12] Bogdanoff J.L., Goldberg J.E., Schiff A.J. The Effect of ground transmission time on the response of long structures. Bull. Seism. Soc. Am., 55:627-640, 1965.
[13] Dumanoglu A.A., Severn R.T. Dynamic response of dams and other structures to differential ground motion. Proc. Instn. Civ. Eng., Part 2, 77(3):333-352, 1984.
[14] Santa-Cruz S., Heredia-Zavoni E., Harichandran R.S. Low-frequency behavior coherency for strong ground motion in Mexico City and Japan. 12WCEE, No.0076, 2000.
[15] Chen M.T., Harichandran R.S. Sensitivity of earth dam seismic response to ground motion coherency. Geotechnical Earthquake Engineering and Soil Dynamic III, pp. 914-925, 1998.
[16] Ates S., Dumanoglu A.A., Bayraktar A. Stochastic response of seismically isolated highway bridges with friction pendulum systems to spatially varying earthquake ground motions. Engineering Structures, 27:1843–1858, 2005.
[17] Wang J.T., Chopra A.K. Linear analysis of concrete arch dams including dam-water-foundation rock interaction considering spatially varying ground motion. Earthquake Engineering and Structural Dynamics, 39(7):731-750, 2010.
[18] Moradloo J. Analysis of nonlinear dynamic behavior of arched concrete dams in large displacement range. Ph.D thesis, Tarbiat Modarres University, 2010.
[19] Khatibinia M., Chiti H., Akbarpour A., Naseri H.R. Shape optimization of concrete gravity dams considering dam–water–foundation interaction and nonlinear effects. Iran University of Science & Technology, 6(1):115-134, 2016.
[20] Løkke A., Chopra A.K. Direct finite element method for nonlinear earthquake analysis of 3‐dimensional semi‐unbounded dam–water–foundation rock systems. Earthquake Engineering & Structural Dynamics, 47(5): 1309-1328, 2018.
[21] Wang J.T., Jin A.Y, Du X.L, Wu M.X. Scatter of dynamic response and damage of an arch dam subjected to artificial earthquake accelerograms. Soil Dynamics and Earthquake Engineering, 87:93-100, 2016.
[22] Ouzandja D., Tiliouine B., Ouzandja T. Nonlinear seismic response of concrete gravity dams. In GeoMEast 2017 International Congress and Exhibition, Sustainable Civil Infrastructures: Innovative Infrastructure Geotechnology, Sharm Elsheikh, Egypt, July 15-19, pp. 13-21, Springer, Cham, 2017.
[23] Mirzabozorg H., Varmazyari M., Gharehbaghi S.A. Seismic evaluation of existing arch dams and massed foundation effects. Soils and Foundations, 56(1):19-32, 2016.
[24] Hibbitt, Karlson, Sorenson Inc. ABAQUS version 14/6: theory manual, users' manual, verification manual and example problems manual. Hibbitt, Karlson and Sorenson Inc., 2005.
Document information
Published on 22/12/21
Accepted on 03/01/21
Submitted on 27/09/20
Volume 37, Issue 4, 2021
DOI: 10.23967/j.rimni.2021.12.004
Licence: CC BY-NC-SA license
Share this document
claim authorship
Are you one of the authors of this document?
