(→Nomenclature) |
(→3.4 Effect of Particle MVD) |
||
| (23 intermediate revisions by the same user not shown) | |||
| Line 20: | Line 20: | ||
==Nomenclature== | ==Nomenclature== | ||
| − | {| style="width: | + | {| style="width: 65%;border-collapse: collapse;" |
|- | |- | ||
| LWC: | | LWC: | ||
| Line 90: | Line 90: | ||
==Subscripts== | ==Subscripts== | ||
| − | {| style="width: | + | {| style="width: 65%;border-collapse: collapse;" |
|- | |- | ||
| − | | style="vertical-align: top;width: 11%;"|<math>p</math> | + | | style="vertical-align: top;width: 11%;"|<math>p</math>: |
| style="vertical-align: top;"|particle | | style="vertical-align: top;"|particle | ||
| − | | style="vertical-align: top;width: 8%;"|<math>a</math> | + | | style="vertical-align: top;width: 8%;"|<math>a</math>: |
| style="vertical-align: top;"|air | | style="vertical-align: top;"|air | ||
|- | |- | ||
| − | | style="vertical-align: top;width: 11%;"|<math>l</math> | + | | style="vertical-align: top;width: 11%;"|<math>l</math>: |
| style="vertical-align: top;"|laminar | | style="vertical-align: top;"|laminar | ||
| − | | style="vertical-align: top;width: 8%;"|<math>vap</math> | + | | style="vertical-align: top;width: 8%;"|<math>vap</math>: |
| style="vertical-align: top;"|vapor | | style="vertical-align: top;"|vapor | ||
|- | |- | ||
| − | | style="vertical-align: top;width: 11%;"|<math>conv</math> | + | | style="vertical-align: top;width: 11%;"|<math>conv</math>: |
| style="vertical-align: top;"|convection | | style="vertical-align: top;"|convection | ||
| − | | style="vertical-align: top;width: 8%;"|<math>evap</math> | + | | style="vertical-align: top;width: 8%;"|<math>evap</math>: |
| style="vertical-align: top;"|evaporative | | style="vertical-align: top;"|evaporative | ||
|} | |} | ||
| Line 118: | Line 118: | ||
A three-dimensional particle trajectory calculation model based on Eulerian method is established to obtain the thermodynamic coupling of particles and flow field without considering the solid-liquid mixing phase. NRC small ice tunnel in Ottawa was numerically studied based on the three-dimensional model. And the effects of different initial LWC, relative humidity and MVD were studied. | A three-dimensional particle trajectory calculation model based on Eulerian method is established to obtain the thermodynamic coupling of particles and flow field without considering the solid-liquid mixing phase. NRC small ice tunnel in Ottawa was numerically studied based on the three-dimensional model. And the effects of different initial LWC, relative humidity and MVD were studied. | ||
| − | ==2. Description of the | + | ==2. Description of the model == |
The air flow field is first calculated by the Spalart-Allmaras turbulence model [18], and the calculated results are used as known conditions for particle trajectory calculation. | The air flow field is first calculated by the Spalart-Allmaras turbulence model [18], and the calculated results are used as known conditions for particle trajectory calculation. | ||
| Line 255: | Line 255: | ||
{| style="text-align: center; margin:auto;" | {| style="text-align: center; margin:auto;" | ||
|- | |- | ||
| − | | <math>C_D=\ | + | | <math>C_D=\left\{ \begin{array}{c} |
24\left(1+0.15{Re}_p^{0.687}\right)/{Re}_p,\mbox{ }{Re}_p\leq 1300\\ | 24\left(1+0.15{Re}_p^{0.687}\right)/{Re}_p,\mbox{ }{Re}_p\leq 1300\\ | ||
0.44,{Re}_p>1300 | 0.44,{Re}_p>1300 | ||
| − | \end{array}</math> | + | \end{array}\right.</math> |
|} | |} | ||
| style="width: 5px;text-align: right;white-space: nowrap;" | (12) | | style="width: 5px;text-align: right;white-space: nowrap;" | (12) | ||
| Line 284: | Line 284: | ||
| style="width: 5px;text-align: right;white-space: nowrap;" | (14) | | style="width: 5px;text-align: right;white-space: nowrap;" | (14) | ||
|} | |} | ||
| − | |||
==3. Case study == | ==3. Case study == | ||
| Line 301: | Line 300: | ||
| − | One of the test conditions in paper [16] is as follows: air flow velocity at spray mast is 4.8 m/s; initial temperature is 273.15 K; relative humidity is 31%; particle LWC is 0.99 g/m3; particle MVD is 15.1 | + | One of the test conditions in paper [16] is as follows: air flow velocity at spray mast is 4.8 m/s; initial temperature is 273.15 K; relative humidity is 31%; particle LWC is 0.99 g/m3; particle MVD is 15.1 <math>\mu</math>m; pressure at engine inlet is 101.35 kPa; thermodynamic boundaries at walls are adiabatic. From the experimental results, the MVD of the particles at the engine inlet is 22.8 <math>\mu</math>m. MVD of particles increases in the strong evaporation environment, which seems to violate the law of mass conservation, but the results are in line with the actual engineering. This is because the particles ejected by the spray master are not exactly the same size, with an average diameter of 15.1 <math>\mu</math>m. In the process of evaporation, the diameter of all particles becomes smaller, but the size of smaller particles becomes smaller after evaporation, and then cannot be detected by the [javascript:; measuring] [javascript:; equipment], thus indirectly increasing the MVD value at the engine inlet [16]. However, there is no problem of data acquisition in the numerical simulation. In order to match the relative humidity at the engine inlet, the boundary conditions are the same as those of the experiment, but particles with same diameter which are 20μm are used as the initial condition, and the initial temperature of the particles is defined as 293.15 K. |
It is shown that the calculated results are quite consistent with the experimental results from the comparison of parameters in [[#tab-1|Table 1]]. In addition, from the comparison of temperature fields in [[#img-2|Figure 2]], it can be found that the temperature of the background flow field at the engine inlet decreases significantly due to evaporation. | It is shown that the calculated results are quite consistent with the experimental results from the comparison of parameters in [[#tab-1|Table 1]]. In addition, from the comparison of temperature fields in [[#img-2|Figure 2]], it can be found that the temperature of the background flow field at the engine inlet decreases significantly due to evaporation. | ||
| Line 310: | Line 309: | ||
{| class="wikitable" style="margin: 1em auto 0.1em auto;border-collapse: collapse;font-size:85%;width:auto;" | {| class="wikitable" style="margin: 1em auto 0.1em auto;border-collapse: collapse;font-size:85%;width:auto;" | ||
|-style="text-align:center" | |-style="text-align:center" | ||
| − | ! !! Experimental results !! Numerical results !! Relative error((Numerical results -<br> Experimental results)/ Experimental results) | + | ! !! Experimental<br> results !! Numerical<br> results !! Relative error ((Numerical results -<br> Experimental results)/Experimental results) |
|- | |- | ||
| style="text-align: center;vertical-align: top;"|Speed (m/s) | | style="text-align: center;vertical-align: top;"|Speed (m/s) | ||
| Line 368: | Line 367: | ||
| − | Figure 3 shows the comparison of results for different LWC, in which the comparison data are at the central axis of the engine icing wind tunnel. | + | [[#img-3|Figure 3]] shows the comparison of results for different LWC, in which the comparison data are at the central axis of the engine icing wind tunnel. |
| − | The initial LWC of case 13 is 8 times that of case 11, but the loss of LWC at engine inlet of case 13 is only 4.4 times of that of case 11 ( | + | The initial LWC of case 13 is 8 times that of case 11, but the loss of LWC at engine inlet of case 13 is only 4.4 times of that of case 11 ([[#img-3|Figure 3e]]). This shows that for the same particle diameter, the total evaporation is directly proportional to the initial LWC, but the evaporation of a single particle is proportional to the LWC inversely, which results in the MVD of case 13 being larger than that of the other three cases ([[#img-3|Figure 3d]]), and the final MVD of case 13 is almost 3.3 times that of case 11. Moreover, the changes of temperature and relative humidity in the background flow field are mainly influenced by the total evaporation. The larger total evaporation, the lower temperature of the background flow field ([[#img-3|Figure 3a]]), and the greater relative humidity at engine inlet ([[#img-3|Figure 3f]]). |
| − | In addition, the evaporation capacity of a single particle has a great influence on the particle MVD, but less than 5 times of variation does not have a significant impact on the drag coefficient ( | + | In addition, the evaporation capacity of a single particle has a great influence on the particle MVD, but less than 5 times of variation does not have a significant impact on the drag coefficient (Eqs.(3) and (12)) in the particle motion. Therefore, the particle velocity in the cases of different LWC are almost the same ([[#img-3|Figure 3c]]). Similarly, the evaporation of a single particle has little effect on the particle temperature ([[#img-3|Figure 3b]]). The particle temperature of case 13 at engine inlet is only about 0.5K higher than that of case 11. Therefore, the change of LWC at spray mast has little effect on particle temperature and particle velocity. |
| − | {| style=" | + | <div id='img-3'></div> |
| + | {| style="text-align: center; border: 1px solid #BBB; margin: 1em auto; width: auto;max-width: auto;" | ||
|- | |- | ||
| − | | style="text-align: center; | + | | style="text-align: center;padding:10px;"| [[Image:Review_334534769412-image48-c.png|294px]] |
| − | | style="text-align: center; | + | | style="text-align: center;padding:10px;"| [[Image:Review_334534769412-image49-c.png|288px]] |
|- | |- | ||
| − | | style="text-align: center;"|(a) | + | | style="text-align: center;font-size: 75%;"|(a) |
| − | | style="text-align: center;"|(b) | + | | style="text-align: center;font-size: 75%;"|(b) |
|- | |- | ||
| − | | style="text-align: center; | + | | style="text-align: center;padding:10px;"| [[Image:Review_334534769412-image50-c.png|282px]] |
| − | | style="text-align: center; | + | | style="text-align: center;padding:10px;"| [[Image:Review_334534769412-image51-c.png|306px]] |
|- | |- | ||
| − | | style="text-align: center;"|(c) | + | | style="text-align: center;font-size: 75%;"|(c) |
| − | | style="text-align: center;"|(d) | + | | style="text-align: center;font-size: 75%;"|(d) |
|- | |- | ||
| − | | style="text-align: center; | + | | style="text-align: center;padding:10px;"| [[Image:Review_334534769412-image52-c.png|300px]] |
| − | | style="text-align: center; | + | | style="text-align: center;padding:10px;"| [[Image:Review_334534769412-image53-c.png|288px]] |
|- | |- | ||
| − | | style="text-align: center;"|(e) | + | | style="text-align: center;font-size: 75%;"|(e) |
| − | | style="text-align: center;"|(f) | + | | style="text-align: center;font-size: 75%;"|(f) |
| + | |- style="text-align: center; font-size: 75%;" | ||
| + | | colspan="2" style="padding:10px;"| '''Figure 3'''. Comparison of results for different LWC. (a) Air temperature. (b) Particle temperature. (c) Particle velocity. <br>(d) MVD. (e) LWC. (f) Relative humidity | ||
|} | |} | ||
| + | ===3.3 Effect of relative humidity=== | ||
| − | + | Similarly, to understand the effect of initial RH on the variables at engine inlet, only change the RH value at spray mast and keep the remaining conditions unchanged. The specific cases of different RH are shown in [[#tab-3|Table 3]]. | |
| − | + | ||
| − | ==3. | + | <div class="center" style="font-size: 75%;">'''Table 3'''. Cases of different RH</div> |
| − | + | <div id='tab-1'></div> | |
| − | + | {| class="wikitable" style="margin: 1em auto 0.1em auto;border-collapse: collapse;font-size:85%;width:auto;" | |
| − | <div | + | |-style="text-align:center" |
| − | + | ! !! Case 21 !! Reference Case !! Case 22 !! Case 23 | |
| − | + | ||
| − | {| style=" | + | |
|- | |- | ||
| − | | style=" | + | | style="text-align: center;vertical-align: top;"|LWC (g/m<sup>3</sup>) |
| − | + | | style="text-align: center;vertical-align: top;"|0.99 | |
| − | + | | style="text-align: center;vertical-align: top;"|0.99 | |
| − | + | | style="text-align: center;vertical-align: top;"|0.99 | |
| − | + | | style="text-align: center;vertical-align: top;"|0.99 | |
| − | + | ||
| − | + | ||
| − | | style=" | + | |
| − | | style=" | + | |
| − | | style=" | + | |
| − | | style=" | + | |
|- | |- | ||
| style="text-align: center;vertical-align: top;"|RH (%) | | style="text-align: center;vertical-align: top;"|RH (%) | ||
| Line 426: | Line 420: | ||
| style="text-align: center;vertical-align: top;"|80 | | style="text-align: center;vertical-align: top;"|80 | ||
|- | |- | ||
| − | | style=" | + | | style="text-align: center;vertical-align: top;"|MVD (<math>\mu</math>m) |
| − | | style=" | + | | style="text-align: center;vertical-align: top;"|20 |
| − | | style=" | + | | style="text-align: center;vertical-align: top;"|20 |
| − | | style=" | + | | style="text-align: center;vertical-align: top;"|20 |
| − | | style=" | + | | style="text-align: center;vertical-align: top;"|20 |
|} | |} | ||
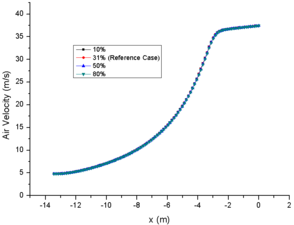
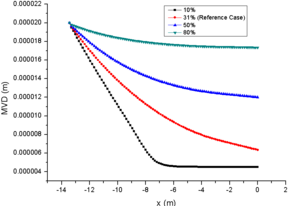
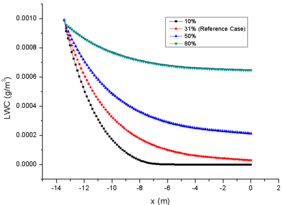
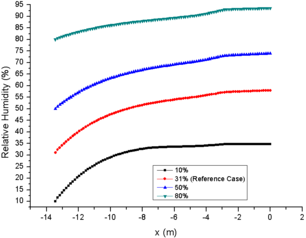
| − | The comparison of results for different RH are shown in Figure 4, in which the comparison data are also at the central axis of the engine icing wind tunnel. | + | The comparison of results for different RH are shown in [[#img-4|Figure 4]], in which the comparison data are also at the central axis of the engine icing wind tunnel. |
| − | As the initial relative humidity at spray mast increases gradually on the premise of the same initial LWC and particle MVD, it is obvious that the evaporation phenomenon in the engine icing wind tunnel is gradually weakened. In general, the initial relative humidity is inversely proportional to the total evaporation and single particle evaporation. The relative humidity of case 23 is 80% at the spray mast, and the total evaporation loss is only 34.6% at the engine inlet, while case 21 is almost evaporated completely at the engine inlet ( | + | As the initial relative humidity at spray mast increases gradually on the premise of the same initial LWC and particle MVD, it is obvious that the evaporation phenomenon in the engine icing wind tunnel is gradually weakened. In general, the initial relative humidity is inversely proportional to the total evaporation and single particle evaporation. The relative humidity of case 23 is 80% at the spray mast, and the total evaporation loss is only 34.6% at the engine inlet, while case 21 is almost evaporated completely at the engine inlet ([[#img-4|Figure 4e]]). Similarly, comparison of particle MVD reflects the evaporation of single particle. The MVD of case 23 is only reduced by 13.5%, while the particles of case 21 is evaporated completely when they moved to half of the wind tunnel ([[#img-4|Figure 4d]]). This also explains the MVD of NRC particles increases during the test. Although all the particles have some degree of evaporation in the strong evaporation environment (31%), some of the smaller particles evaporate completely which improves the statistical value. |
| − | From the comparison of relative humidity changes, it can also be found that the curve of relative humidity changes more smoothly with the increase of initial value, which also reflects the influence of initial relative humidity on evaporation phenomenon ( | + | From the comparison of relative humidity changes, it can also be found that the curve of relative humidity changes more smoothly with the increase of initial value, which also reflects the influence of initial relative humidity on evaporation phenomenon ([[#img-4|Figure 4f]]). Similarly, the change of temperature of the background flow field ([[#img-4|Figure 4a]]) and the particle temperature ([[#img-4|Figure 4b]]) are inversely proportional to the initial relative humidity. It should be noted that the initial temperature of particles (293.15K in this paper) has little effect on the subsequent temperature changes ([[#img-3|Figure 3b]] and [[#img-4|Figure 4b]]). In addition, as the results of different LWC, the initial relative humidity has little effect on the change of particle velocity ([[#img-4|Figure 4c]]). |
| − | {| style=" | + | <div id='img-4'></div> |
| + | {| style="text-align: center; border: 1px solid #BBB; margin: 1em auto; width: auto;max-width: auto;" | ||
|- | |- | ||
| − | | style="text-align: center; | + | | style="text-align: center;padding:10px;"|[[Image:Review_334534769412-image54-c.png|294px]] |
| − | | style="text-align: center; | + | | style="text-align: center;padding:10px;"|[[Image:Review_334534769412-image55-c.png|288px]] |
|- | |- | ||
| − | | | + | | style="text-align: center;font-size: 75%;"|(a) |
| − | | | + | | style="text-align: center;font-size: 75%;"|(b) |
|- | |- | ||
| − | | style="text-align: center; | + | | style="text-align: center;padding:10px;"|[[Image:Review_334534769412-image56-c.png|282px]] |
| − | | style="text-align: center; | + | | style="text-align: center;padding:10px;"|[[Image:Review_334534769412-image57-c.png|306px]] |
|- | |- | ||
| − | | | + | | style="text-align: center;font-size: 75%;"|(c) |
| − | | | + | | style="text-align: center;font-size: 75%;"|(d) |
|- | |- | ||
| − | | style="text-align: center; | + | | style="text-align: center;padding:10px;"|[[Image:Review_334534769412-image58-c.png|300px]] |
| − | | style="text-align: center; | + | | style="text-align: center;padding:10px;"|[[Image:Review_334534769412-image59-c.png|282px]] |
|- | |- | ||
| − | | | + | | style="text-align: center;font-size: 75%;"|(e) |
| − | | | + | | style="text-align: center;font-size: 75%;"|(f) |
| + | |- style="text-align: center; font-size: 75%;" | ||
| + | | colspan="2" style="padding:10px;"| '''Figure 4'''. Comparison of results for different RH. (a) Air temperature. (b) Particle temperature. (c) Particle velocity.<br> (d) MVD. (e) LWC. (f) Relative humidity | ||
|} | |} | ||
| + | ===3.4 Effect of particle MVD=== | ||
| − | + | Finally, the effect of initial particle MVD on variables are obtained. [[#tab-4|Table 4]] shows the cases of different MVD. | |
| − | + | ||
| − | == | + | <div class="center" style="font-size: 75%;">'''Table 4'''. Cases of different MVD</div> |
| − | + | <div id='tab-4'></div> | |
| − | + | {| class="wikitable" style="margin: 1em auto 0.1em auto;border-collapse: collapse;font-size:85%;width:auto;" | |
| − | <div | + | |-style="text-align:center" |
| − | + | ! !! Case 31 !! Reference Case !! Case 32 !! Case 33 | |
| − | + | ||
| − | {| style=" | + | |
|- | |- | ||
| − | | style=" | + | | style="text-align: center;"|LWC (g/m<sup>3</sup>) |
| − | + | | style="text-align: center;"|0.99 | |
| − | + | | style="text-align: center;"|0.99 | |
| − | + | | style="text-align: center;"|0.99 | |
| − | + | | style="text-align: center;"|0.99 | |
| − | + | ||
| − | + | ||
| − | | style=" | + | |
| − | | style=" | + | |
| − | | style=" | + | |
| − | | style=" | + | |
|- | |- | ||
| style="text-align: center;"|RH (%) | | style="text-align: center;"|RH (%) | ||
| Line 492: | Line 481: | ||
| style="text-align: center;"|31 | | style="text-align: center;"|31 | ||
|- | |- | ||
| − | | style=" | + | | style="text-align: center;"|MVD (<math>\mu</math>m) |
| − | | style=" | + | | style="text-align: center;"|10 |
| − | | style=" | + | | style="text-align: center;"|20 |
| − | | style=" | + | | style="text-align: center;"|50 |
| − | | style=" | + | | style="text-align: center;"|100 |
|} | |} | ||
| − | The comparison of results for different MVD are shown in Figure 5, in which the comparison data are also at the central axis of the engine icing wind tunnel. | + | The comparison of results for different MVD are shown in [[#img-5|Figure 5]], in which the comparison data are also at the central axis of the engine icing wind tunnel. |
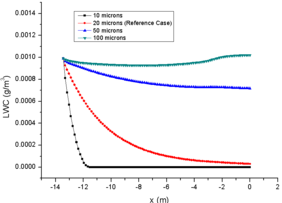
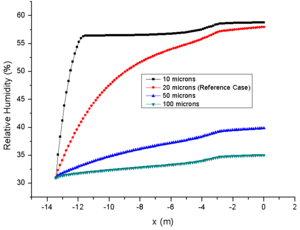
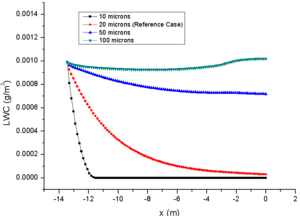
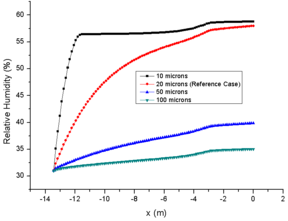
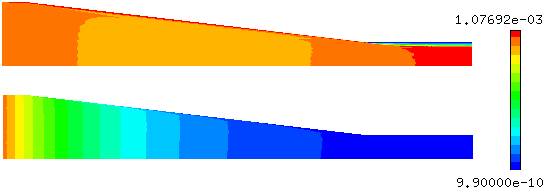
With the same initial LWC, increasing the MVD of particles reduces the amount of particles and the total surface area of contact with air which reduces the total amount of evaporation. | With the same initial LWC, increasing the MVD of particles reduces the amount of particles and the total surface area of contact with air which reduces the total amount of evaporation. | ||
| − | Therefore, the larger the initial MVD of particles, the less LWC loss at the engine inlet ( | + | Therefore, the larger the initial MVD of particles, the less LWC loss at the engine inlet ([[#img-5|Figure 5e]]), and the smaller the change of MVD due to the influence of evaporation on particle diameter ([[#img-5|Figure 5d]]). However, the LWC variation [javascript:; trend] of case 33 in [[#img-5|Figure 5e]] is particularly noteworthy. Which decreases slowly and then increases again. This is caused by the inertia of particles. |
| − | Figure 6 shows the LWC comparison of case 33 and reference case. the particles of case 33 are difficult to change the direction of motion in the straight section of the wind tunnel due to its large particle diameter and large inertia. Therefore, a shadow zone is formed on the wall of the straight section, and the particles concentrate towards the center of the flow field, resulting in an increase of LWC at the central axis. | + | [[#img-6|Figure 6]] shows the LWC comparison of case 33 and reference case. the particles of case 33 are difficult to change the direction of motion in the straight section of the wind tunnel due to its large particle diameter and large inertia. Therefore, a shadow zone is formed on the wall of the straight section, and the particles concentrate towards the center of the flow field, resulting in an increase of LWC at the central axis. |
| − | In fact, case 33 is affected by evaporation, and the average LWC at engine inlet is only 82.5 g/m<sup>3</sup>. The larger the initial MVD of particles, the smaller the total evaporation and single particle evaporation, and the smaller the final relative humidity change. Relative humidity of case33 only increased by 4%, while case 31 increased by nearly 28 % ( | + | In fact, case 33 is affected by evaporation, and the average LWC at engine inlet is only 82.5 g/m<sup>3</sup>. The larger the initial MVD of particles, the smaller the total evaporation and single particle evaporation, and the smaller the final relative humidity change. Relative humidity of case33 only increased by 4%, while case 31 increased by nearly 28 % ([[#img-5|Figure 5f]]), which also had less effect on the temperature of background flow field ([[#img-5|Figure 5a]]). In addition, different from the first two groups of comparison cases, the initial MVD of a particle has a more obvious change on the particle temperature. The larger the MVD of a single particle, the greater the internal energy of the particle, and the slower the particle temperature drops ([[#img-5|Figure 5b]]). The MVD of case 33 at spray mast is 10 times of that of case 31. Due to different evaporation degrees, the proportion of MVD at engine inlet increases to about 43 times, which is enough to influence the drag coefficient of particles. The larger the MVD, the slower the particle velocity. However, in the straight section of the wind tunnel, the particle velocity difference becomes smaller again with the influence of the particle inertia, ([[#img-5|Figure 5c]]). |
| − | {| style=" | + | <div id='img-4'></div> |
| + | {| style="text-align: center; border: 1px solid #BBB; margin: 1em auto; width: auto;max-width: auto;" | ||
|- | |- | ||
| − | | style="text-align: center; | + | | style="text-align: center;padding:10px;"|[[Image:Review_334534769412-image60-c.png|288px]] |
| − | | style="text-align: center; | + | | style="text-align: center;padding:10px;"|[[Image:Review_334534769412-image61-c.png|288px]] |
|- | |- | ||
| − | | style="text-align: center;"|(a) | + | | style="text-align: center;font-size: 75%;"|(a) |
| − | | style="text-align: center;"|(b) | + | | style="text-align: center;font-size: 75%;"|(b) |
|- | |- | ||
| − | | style="text-align: center; | + | | style="text-align: center;padding:10px;"|[[Image:Review_334534769412-image62-c.png|282px]] |
| − | | style="text-align: center; | + | | style="text-align: center;padding:10px;"|[[Image:Review_334534769412-image63-c.png|300px]] |
|- | |- | ||
| − | | style="text-align: center;"|(c) | + | | style="text-align: center;font-size: 75%;"|(c) |
| − | | style="text-align: center;"|(d) | + | | style="text-align: center;font-size: 75%;"|(d) |
|- | |- | ||
| − | | style="text-align: center; | + | | style="text-align: center;padding:10px;"|[[Image:Review_334534769412-image64-c.png|300px]] |
| − | | style="text-align: center; | + | | style="text-align: center;padding:10px;"|[[Image:Review_334534769412-image65-c.png|288px]] |
|- | |- | ||
| − | | style="text-align: center;"|(e) | + | | style="text-align: center;font-size: 75%;"|(e) |
| − | | style="text-align: center;"|(f) | + | | style="text-align: center;font-size: 75%;"|(f) |
| + | |- style="text-align: center; font-size: 75%;" | ||
| + | | colspan="2" style="padding:10px;"| '''Figure 5'''. Comparison of results for different MVD. (a) Air temperature. (b) Particle temperature. (c) Particle velocity.<br> (d) MVD. (e) LWC. (f) Relative humidity | ||
|} | |} | ||
| − | <div | + | <div id='img-1'></div> |
| − | + | {| style="text-align: center; border: 1px solid #BBB; margin: 1em auto; width: auto;max-width: auto;" | |
| − | + | |- | |
| − | + | |style="padding:10px;"| [[Image:Review_334534769412-image66.png|600px]] | |
| − | [[Image:Review_334534769412-image66.png|600px]] | + | |- style="text-align: center; font-size: 75%;" |
| − | + | | colspan="1" style="padding:10px;"| '''Figure 6'''. Comparison of LWC (up: Case 33; down: Reference Case) | |
| − | + | |} | |
| − | Figure 6. Comparison of LWC (up: Case 33; down: Reference Case) | + | |
==4. Conclusions == | ==4. Conclusions == | ||
| Line 551: | Line 542: | ||
(3) The temperature change of particles is greatly affected by relative humidity. The particles with larger initial MVD have a slower cooling rate because of higher initial internal energy. Otherwise, the change of particle temperature is not affected by the initial particle temperature. | (3) The temperature change of particles is greatly affected by relative humidity. The particles with larger initial MVD have a slower cooling rate because of higher initial internal energy. Otherwise, the change of particle temperature is not affected by the initial particle temperature. | ||
| − | + | ==Acknowledgements== | |
| + | |||
| + | This research was funded by the Open Fund of Key Laboratory of Icing and Anti/De-icing (Grant No. 1901IADL20190306). | ||
| + | |||
| + | '''Conflicts of Interest''': The authors declare no conflicts of interest. | ||
| − | + | ==References== | |
| + | <div class="auto" style="text-align: left;width: auto; margin-left: auto; margin-right: auto;font-size: 85%;"> | ||
| − | + | [1] Yuan Q.H., Fan J., Bai G.C. Review of ice crystal icing in aero-engines. J. Propul. Technol., 39:2641-2650, 2018. | |
| − | + | [2] Bravin M., Strapp J.W. A continuing investigation of diurnal and location trends in an ice crystal icing engine event database. SAE Int. J. Advances & Curr. Prac. in Mobility, 2(1):90-105, 2020. | |
| − | + | [3] Mason J.G., Strapp J.W., Chow P. The ice particle threat to engines in flight. 44<sup>th</sup> Aerospace Sciences Meeting and Exhibit, 2006-206, 2006. | |
| − | + | [4] Jiang F.F., Dong W., Zheng M., Guo Z.Q. Phase change heat transfer characteristic of ice crystal ingested into turbofan engine. J. Aerosp. Power, 34:567-575, 2019. | |
| − | + | [5] Villedieu P., Trontin P., Chauvin R. Glaciated and mixed-phase ice accretion modeling using ONERA 2D icing suite. 6<sup>th</sup> AIAA Atmospheric and Space Environments Conference, 2014-2199, 2014. | |
| − | + | [6] Zhang L.F., Liu Z.X., Zhang M.H. Numerical simulation of ice accretion under mixed-phase conditions. | |
| + | Proceedings of the Institution of Mechanical Engineers, Part G: Journal of Aerospace Engineering, 230(13):2473-2483, 2016. | ||
| − | + | [7] Norde E., Weide E.T.A., Hoeijmakers H.W.M. Eulerian method for ice crystal icing. AIAA J., 56:222-234, 2018. | |
| − | + | [8] Nilamdeen S., Habashi W.G. FENSAP-ICE: Modeling of water droplets and ice crystals. 1<sup>st</sup> AIAA Atmospheric and Space Environments Conference, 2009-4128, 2009. | |
| − | + | [9] Bu X.Q., Li H., Huang P. Numerical simulation of mixed phase icing on two-dimensional airfoil. Acta Aeronautica et Astronautica Sinica, 42(3):124085, 2021. | |
| − | + | [10] Currie T.C., Struk P.M., Tsao J.C., Fuleki D., Knezevici D.C. Fundamental study of mixed-phase icing with application to ice crystal accretion in aircraft jet engines. 6<sup>th</sup> AIAA Atmospheric and Space Environments Conference, 2012-3035, 2012. | |
| − | + | [11] Fuleki D.M., Macleod J.D. Ice crystal accretion test rig development for a compressor transition duct. 4<sup>th</sup> AIAA Atmospheric and Space Environments Conference, 2010-7529, 2010. | |
| − | + | [12] Mason J.G., Chow P., Dan M.F. Understanding ice crystal accretion and shedding phenomenon in jet engines using a rig test. Proceedings of ASME Turbo Expo 2010: Power for Land, Sea and Air, GT 2010-22550, 2010. | |
| − | + | [13] Struk P.M., Tsao J.C., Bartkus T.P. Plans and preliminary results of fundamental studies of ice crystal icing physics in the NASA propulsion systems laboratory. 8<sup>th</sup> AIAA Atmospheric and Space Environments Conference, 2016-3738, 2016. | |
| − | + | [14] Wright W., Jorgenson P., Veres J. Mixed phase modeling in GlennICE with application to engine icing. AIAA Atmospheric and Space Environments Conference 2010, Canada, August 2-5, 2010. | |
| − | + | [15] Hauk T., Roisman I., Tropea C. Investigation of the melting behavior of ice particles in an acoustic levitator. In 11<sup>th</sup> AIAA/ASME Joint Thermophysics and Heat Transfer Conference, USA, June 16-20, 2014. | |
| − | + | [16] Davison C.R., MaCleod J.D., Chalmers J.L. Droplet evaporation model for determining liquid water content in engine icing tunnels and examination of the factors affecting liquid water content. 9<sup>th</sup> AIAA Atmospheric and Space Environments Conference, AIAA 2017-4246, | |
| + | Session: Fundamentals of Engine Ice Crystal Icing, 2017. | ||
| − | + | [17] Bartkus T.P., Struk P., Tsao J.C. Development of a coupled air and particle thermal model for engine icing test facilities. SAE Int. J. Aerosp., 8:15-32, 2015. | |
| − | + | [18] Spalart P.R., Allmaras S.R. A one-equation turbulence model for aerodynamic flows. 30<sup>th</sup> AIAA Aerospace Sciences Meeting and Exhibit, 1992-0439, 1992. | |
| − | + | [19] Crowe C., Sommerfeld M., Tsuji Y. Multiphase flows with droplets and particles (2nd edition). CRC Press, New Youk, 2002. | |
| − | + | [20] Zhang Y., Ozcer I., Nilamdeen S., Baruzzi G.S. et al. Numerical demonstration of the humidity effect in engine icing. SAE Technical Paper 2019-01-2015, 2019. https://doi.org/10.4271/2019-01-2015 | |
| − | + | </div> | |
Latest revision as of 16:14, 14 December 2021
Abstract
Research on engine icing is a hot topic among the world. Different from the aircraft wing or airframe icing, the evaporation phenomenon in the internal flow field has a great influence on the engine icing. Moreover, the thermodynamic coupling between droplets and flow field is not available in current particle trajectory calculations, or only for one-dimensional situation. Therefore, a three-dimensional droplet trajectory calculation model based on Eulerian method is used to demonstrate the thermodynamic coupling between droplets and flow field. The model was verified by NRC small engine icing wind tunnel test data and the flow field evolution is obtained which cannot be obtained by the one-dimensional coupling model. In the meanwhile, the effects of different initial LWC, relative humidity and MVD on the internal flow evaporation were studied, and the trends of droplets and flow field affected by evaporation were obtained. The numerical method in this paper can provide guidance for the subsequent research on engine icing.
Keywords: Eulerian method, trajectory calculation, icing, numerical simulation
Nomenclature
| LWC: | Liquid Water Content | MVD: | Median Volume Diameter |
| RH: | Relative Humidity | : | Sherwood number |
| : | diameter | : | diffusivity coefficient |
| : | density | : | Reynolds number |
| : | Schmidt number | : | velocity of flow field |
| : | particle velocity | : | partial vapor pressure |
| : | saturation vapor pressure | : | molar mass |
| : | LWC | : | volume fraction |
| : | volume fraction | : | vapor concentration |
| : | effective mass diffusion coefficient | : | particle internal energy |
| : | air internal energy | : | heat transfer coefficient |
| : | viscous shear stress tensor | : | heat transfer rate |
| : | dynamic viscosity |
Subscripts
| : | particle | : | air |
| : | laminar | : | vapor |
| : | convection | : | evaporative |
1. Introduction
Icing during flight has always been an important threatening to flight safety. An extensive amount of research over the world have carried out and summarized the meteorological conditions of aircraft icing [1]. However, a series of turbofan engine malfunctions characterized by stalling or power loss during high altitude cruise in the past decades [2-4]. As the research moves along, more and more evidences show that the icing at high altitude is the root cause of the above problems. The engine icing is caused by not only supercooled droplets but also ice crystals, which greatly expands the scope of the original aircraft icing meteorological conditions.
At present, engine icing has attracted extensive attention all over the world. The related research has been carried out and some achievements have been made in recent ten years. Under certain assumptions, engine icing process have been simulated by using numerical method and engine icing mechanism have preliminarily explored [5-9]. However, Due to lack of experimental data, the numerical simulation suffered great limitation. Considering experimental research, NRC (National Research Council) of Canada and NASA (National Aeronautics and Space Administration) of America have made great contributions to the experimental study of engine icing mechanism. NRC carried out local flow simulation based on research altitude test facility [10-12]. NASA have established the propulsion system lab (PSL) for full-scale engine icing test [13]. In the experimental study, it is found that the evaporation or sublimation of particles will have a certain impact on the flow field, especially for the internal flow such as engine icing. Therefore, in the study of engine icing, the influence of evaporation on the flow field environment must be considered, and the evaporation phenomenon needs higher requirements for data acquisition.
Although some of the existing particle trajectory calculation models consider the changes of particles which caused by evaporation and sublimation, they are not coupled with the initial flow field [5,14-15], which cannot be used for wind tunnel data verification. For this reason, some scholars have proposed a new coupling model. Davison of NRC proposed an evaporation model for the engine ice wind tunnel. This evaporation model considered the heat and mass transfer and has the capability to run particle distributions for a real time solution [16]. The model proposed by Bartkus takes into account the liquid-solid-gas three-phase thermodynamic coupling and obtains the verification of PSL wind tunnel test results [17]. However, these two models are one-dimensional models, which can quickly calculate the results, but cannot be used in the study of 3D engine icing problem with complex geometry.
A three-dimensional particle trajectory calculation model based on Eulerian method is established to obtain the thermodynamic coupling of particles and flow field without considering the solid-liquid mixing phase. NRC small ice tunnel in Ottawa was numerically studied based on the three-dimensional model. And the effects of different initial LWC, relative humidity and MVD were studied.
2. Description of the model
The air flow field is first calculated by the Spalart-Allmaras turbulence model [18], and the calculated results are used as known conditions for particle trajectory calculation.
According to Fick's Law [19-20], the evaporation rate of single particle resulting from evaporation is defined as:
|
|
(1) |
|
|
(2) |
|
|
(3) |
|
|
(4) |
and are the mass fraction close to and on the particle surface, respectively
|
|
(5) |
The molar mass is 18 g/mol for water vapor and 29 g/mol for air.
Combining Eq.(5) with Eq.(1), results in Eq.(6) for the evaporation rate of single particle
|
|
(6) |
It is assumed that in a finite control volume, all particles have the same physical properties, such as the same density and the same volume. Therefore, the LWC in a control volume can be obtained by integrating the control volume
|
|
(7) |
Therefore,Eq.(8) is the solution of the evaporation rate in a finite control volume
|
|
(8) |
The particle and vapor mass control equations are given by Eqs.(9) and (10) respectively
|
|
(9) |
|
|
(10) |
It is assumed that the velocity and temperature of water vapor and air flow field are consistent, so it is not necessary to establish the momentum and energy governing equations of water vapor, but the momentum conservation equation of droplet particles needs to be re-established and shown by Eq.(11). Here, is drag coefficient
|
|
(11) |
|
|
(12) |
Eq.(13) is the energy governing equation of droplet which is combined with the energy equation in flow field again results in Eq.(14)
|
|
(13) |
|
|
(14) |
3. Case study
3.1 Validation
Based on the NRC small ice wind tunnel in Ottawa shown in Figure 1, a quarter symmetrical mesh model is built with a total of 20 million tetrahedral meshes.
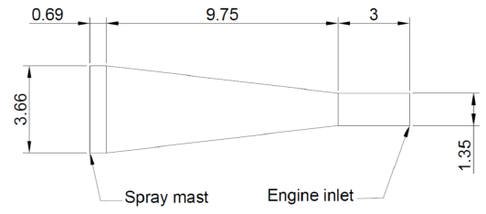
|
| Figure 1. NRC small engine icing wind tunnel geometry (units: m) [16] |
One of the test conditions in paper [16] is as follows: air flow velocity at spray mast is 4.8 m/s; initial temperature is 273.15 K; relative humidity is 31%; particle LWC is 0.99 g/m3; particle MVD is 15.1 m; pressure at engine inlet is 101.35 kPa; thermodynamic boundaries at walls are adiabatic. From the experimental results, the MVD of the particles at the engine inlet is 22.8 m. MVD of particles increases in the strong evaporation environment, which seems to violate the law of mass conservation, but the results are in line with the actual engineering. This is because the particles ejected by the spray master are not exactly the same size, with an average diameter of 15.1 m. In the process of evaporation, the diameter of all particles becomes smaller, but the size of smaller particles becomes smaller after evaporation, and then cannot be detected by the [javascript:; measuring] [javascript:; equipment], thus indirectly increasing the MVD value at the engine inlet [16]. However, there is no problem of data acquisition in the numerical simulation. In order to match the relative humidity at the engine inlet, the boundary conditions are the same as those of the experiment, but particles with same diameter which are 20μm are used as the initial condition, and the initial temperature of the particles is defined as 293.15 K.
It is shown that the calculated results are quite consistent with the experimental results from the comparison of parameters in Table 1. In addition, from the comparison of temperature fields in Figure 2, it can be found that the temperature of the background flow field at the engine inlet decreases significantly due to evaporation.
| Experimental results |
Numerical results |
Relative error ((Numerical results - Experimental results)/Experimental results) | |
|---|---|---|---|
| Speed (m/s) | 35.8 | 35.5 | -0.84% |
| Relative humidity (%) | 57 | 57.78 | 1.36% |
| Temperature (K) | 271.55 | 271.21 | -0.13% |
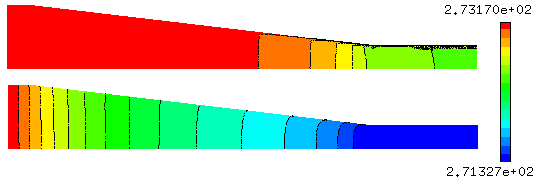
|
| Figure 2. Comparison of temperature (up: Pre- evaporation model coupling; down: Post -evaporation model coupling) |
3.2 Effect of LWC
In order to study the effect of LWC on the variables at engine inlet, the simulations take the above test conditions as reference, and only change the LWC value at spray mast and keep the remaining conditions unchanged. The calculation cases are shown in Table 2.
| Case 11 | Reference Case | Case 12 | Case 13 | |
|---|---|---|---|---|
| LWC (g/m3) | 0.5 | 0.99 | 2 | 4 |
| RH (%) | 31 | 31 | 31 | 31 |
| MVD (m) | 20 | 20 | 20 | 20 |
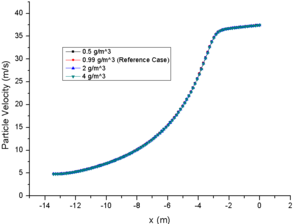
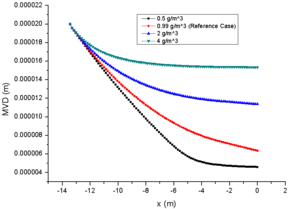
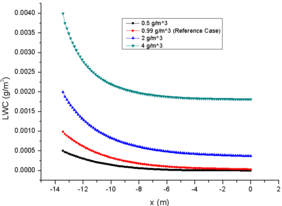
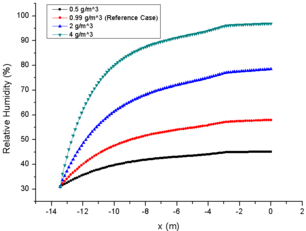
Figure 3 shows the comparison of results for different LWC, in which the comparison data are at the central axis of the engine icing wind tunnel.
The initial LWC of case 13 is 8 times that of case 11, but the loss of LWC at engine inlet of case 13 is only 4.4 times of that of case 11 (Figure 3e). This shows that for the same particle diameter, the total evaporation is directly proportional to the initial LWC, but the evaporation of a single particle is proportional to the LWC inversely, which results in the MVD of case 13 being larger than that of the other three cases (Figure 3d), and the final MVD of case 13 is almost 3.3 times that of case 11. Moreover, the changes of temperature and relative humidity in the background flow field are mainly influenced by the total evaporation. The larger total evaporation, the lower temperature of the background flow field (Figure 3a), and the greater relative humidity at engine inlet (Figure 3f).
In addition, the evaporation capacity of a single particle has a great influence on the particle MVD, but less than 5 times of variation does not have a significant impact on the drag coefficient (Eqs.(3) and (12)) in the particle motion. Therefore, the particle velocity in the cases of different LWC are almost the same (Figure 3c). Similarly, the evaporation of a single particle has little effect on the particle temperature (Figure 3b). The particle temperature of case 13 at engine inlet is only about 0.5K higher than that of case 11. Therefore, the change of LWC at spray mast has little effect on particle temperature and particle velocity.
|
|
| (a) | (b) |
|
|
| (c) | (d) |
|
|
| (e) | (f) |
| Figure 3. Comparison of results for different LWC. (a) Air temperature. (b) Particle temperature. (c) Particle velocity. (d) MVD. (e) LWC. (f) Relative humidity | |
3.3 Effect of relative humidity
Similarly, to understand the effect of initial RH on the variables at engine inlet, only change the RH value at spray mast and keep the remaining conditions unchanged. The specific cases of different RH are shown in Table 3.
| Case 21 | Reference Case | Case 22 | Case 23 | |
|---|---|---|---|---|
| LWC (g/m3) | 0.99 | 0.99 | 0.99 | 0.99 |
| RH (%) | 10 | 31 | 50 | 80 |
| MVD (m) | 20 | 20 | 20 | 20 |
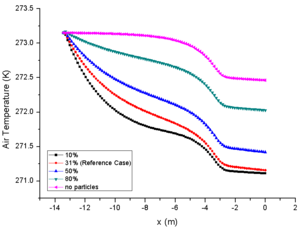
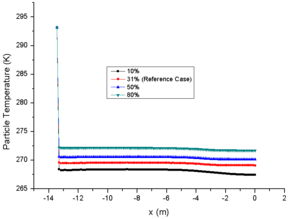
The comparison of results for different RH are shown in Figure 4, in which the comparison data are also at the central axis of the engine icing wind tunnel.
As the initial relative humidity at spray mast increases gradually on the premise of the same initial LWC and particle MVD, it is obvious that the evaporation phenomenon in the engine icing wind tunnel is gradually weakened. In general, the initial relative humidity is inversely proportional to the total evaporation and single particle evaporation. The relative humidity of case 23 is 80% at the spray mast, and the total evaporation loss is only 34.6% at the engine inlet, while case 21 is almost evaporated completely at the engine inlet (Figure 4e). Similarly, comparison of particle MVD reflects the evaporation of single particle. The MVD of case 23 is only reduced by 13.5%, while the particles of case 21 is evaporated completely when they moved to half of the wind tunnel (Figure 4d). This also explains the MVD of NRC particles increases during the test. Although all the particles have some degree of evaporation in the strong evaporation environment (31%), some of the smaller particles evaporate completely which improves the statistical value.
From the comparison of relative humidity changes, it can also be found that the curve of relative humidity changes more smoothly with the increase of initial value, which also reflects the influence of initial relative humidity on evaporation phenomenon (Figure 4f). Similarly, the change of temperature of the background flow field (Figure 4a) and the particle temperature (Figure 4b) are inversely proportional to the initial relative humidity. It should be noted that the initial temperature of particles (293.15K in this paper) has little effect on the subsequent temperature changes (Figure 3b and Figure 4b). In addition, as the results of different LWC, the initial relative humidity has little effect on the change of particle velocity (Figure 4c).
|
|
| (a) | (b) |
|
|
| (c) | (d) |
|
|
| (e) | (f) |
| Figure 4. Comparison of results for different RH. (a) Air temperature. (b) Particle temperature. (c) Particle velocity. (d) MVD. (e) LWC. (f) Relative humidity | |
3.4 Effect of particle MVD
Finally, the effect of initial particle MVD on variables are obtained. Table 4 shows the cases of different MVD.
| Case 31 | Reference Case | Case 32 | Case 33 | |
|---|---|---|---|---|
| LWC (g/m3) | 0.99 | 0.99 | 0.99 | 0.99 |
| RH (%) | 31 | 31 | 31 | 31 |
| MVD (m) | 10 | 20 | 50 | 100 |
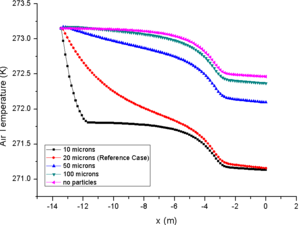
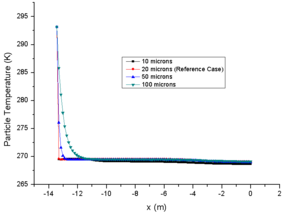
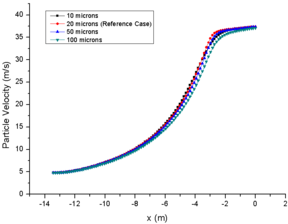
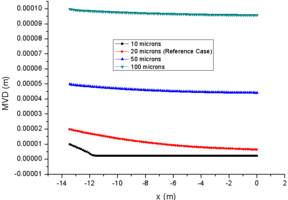
The comparison of results for different MVD are shown in Figure 5, in which the comparison data are also at the central axis of the engine icing wind tunnel.
With the same initial LWC, increasing the MVD of particles reduces the amount of particles and the total surface area of contact with air which reduces the total amount of evaporation.
Therefore, the larger the initial MVD of particles, the less LWC loss at the engine inlet (Figure 5e), and the smaller the change of MVD due to the influence of evaporation on particle diameter (Figure 5d). However, the LWC variation [javascript:; trend] of case 33 in Figure 5e is particularly noteworthy. Which decreases slowly and then increases again. This is caused by the inertia of particles.
Figure 6 shows the LWC comparison of case 33 and reference case. the particles of case 33 are difficult to change the direction of motion in the straight section of the wind tunnel due to its large particle diameter and large inertia. Therefore, a shadow zone is formed on the wall of the straight section, and the particles concentrate towards the center of the flow field, resulting in an increase of LWC at the central axis.
In fact, case 33 is affected by evaporation, and the average LWC at engine inlet is only 82.5 g/m3. The larger the initial MVD of particles, the smaller the total evaporation and single particle evaporation, and the smaller the final relative humidity change. Relative humidity of case33 only increased by 4%, while case 31 increased by nearly 28 % (Figure 5f), which also had less effect on the temperature of background flow field (Figure 5a). In addition, different from the first two groups of comparison cases, the initial MVD of a particle has a more obvious change on the particle temperature. The larger the MVD of a single particle, the greater the internal energy of the particle, and the slower the particle temperature drops (Figure 5b). The MVD of case 33 at spray mast is 10 times of that of case 31. Due to different evaporation degrees, the proportion of MVD at engine inlet increases to about 43 times, which is enough to influence the drag coefficient of particles. The larger the MVD, the slower the particle velocity. However, in the straight section of the wind tunnel, the particle velocity difference becomes smaller again with the influence of the particle inertia, (Figure 5c).
|
|
| (a) | (b) |
|
|
| (c) | (d) |
|
|
| (e) | (f) |
| Figure 5. Comparison of results for different MVD. (a) Air temperature. (b) Particle temperature. (c) Particle velocity. (d) MVD. (e) LWC. (f) Relative humidity | |
|
| Figure 6. Comparison of LWC (up: Case 33; down: Reference Case) |
4. Conclusions
A three-dimensional particle trajectory calculation model based on Eulerian description was developed. The NRC small wind tunnel is taken as the research object and the calculation results are verified by the experimental results. In addition, the effects of LWC, relative humidity and MVD at spray mast on the variables at engine inlet were analyzed.
(1) The results show that increasing the initial LWC will greatly increase the total evaporation, but will reduce the evaporation of single particle, while simply increasing the initial relative humidity or initial MVD will reduce the total evaporation and single particle evaporation.
(2) The particle with larger MVD has higher resistance and is affected by inertia. The flow field in the straight section of the wind tunnel concentrates to the center of the wind tunnel and forms a shielding area on the wall of the straight section, which may cause data acquisition error.
(3) The temperature change of particles is greatly affected by relative humidity. The particles with larger initial MVD have a slower cooling rate because of higher initial internal energy. Otherwise, the change of particle temperature is not affected by the initial particle temperature.
Acknowledgements
This research was funded by the Open Fund of Key Laboratory of Icing and Anti/De-icing (Grant No. 1901IADL20190306).
Conflicts of Interest: The authors declare no conflicts of interest.
References
[1] Yuan Q.H., Fan J., Bai G.C. Review of ice crystal icing in aero-engines. J. Propul. Technol., 39:2641-2650, 2018.
[2] Bravin M., Strapp J.W. A continuing investigation of diurnal and location trends in an ice crystal icing engine event database. SAE Int. J. Advances & Curr. Prac. in Mobility, 2(1):90-105, 2020.
[3] Mason J.G., Strapp J.W., Chow P. The ice particle threat to engines in flight. 44th Aerospace Sciences Meeting and Exhibit, 2006-206, 2006.
[4] Jiang F.F., Dong W., Zheng M., Guo Z.Q. Phase change heat transfer characteristic of ice crystal ingested into turbofan engine. J. Aerosp. Power, 34:567-575, 2019.
[5] Villedieu P., Trontin P., Chauvin R. Glaciated and mixed-phase ice accretion modeling using ONERA 2D icing suite. 6th AIAA Atmospheric and Space Environments Conference, 2014-2199, 2014.
[6] Zhang L.F., Liu Z.X., Zhang M.H. Numerical simulation of ice accretion under mixed-phase conditions. Proceedings of the Institution of Mechanical Engineers, Part G: Journal of Aerospace Engineering, 230(13):2473-2483, 2016.
[7] Norde E., Weide E.T.A., Hoeijmakers H.W.M. Eulerian method for ice crystal icing. AIAA J., 56:222-234, 2018.
[8] Nilamdeen S., Habashi W.G. FENSAP-ICE: Modeling of water droplets and ice crystals. 1st AIAA Atmospheric and Space Environments Conference, 2009-4128, 2009.
[9] Bu X.Q., Li H., Huang P. Numerical simulation of mixed phase icing on two-dimensional airfoil. Acta Aeronautica et Astronautica Sinica, 42(3):124085, 2021.
[10] Currie T.C., Struk P.M., Tsao J.C., Fuleki D., Knezevici D.C. Fundamental study of mixed-phase icing with application to ice crystal accretion in aircraft jet engines. 6th AIAA Atmospheric and Space Environments Conference, 2012-3035, 2012.
[11] Fuleki D.M., Macleod J.D. Ice crystal accretion test rig development for a compressor transition duct. 4th AIAA Atmospheric and Space Environments Conference, 2010-7529, 2010.
[12] Mason J.G., Chow P., Dan M.F. Understanding ice crystal accretion and shedding phenomenon in jet engines using a rig test. Proceedings of ASME Turbo Expo 2010: Power for Land, Sea and Air, GT 2010-22550, 2010.
[13] Struk P.M., Tsao J.C., Bartkus T.P. Plans and preliminary results of fundamental studies of ice crystal icing physics in the NASA propulsion systems laboratory. 8th AIAA Atmospheric and Space Environments Conference, 2016-3738, 2016.
[14] Wright W., Jorgenson P., Veres J. Mixed phase modeling in GlennICE with application to engine icing. AIAA Atmospheric and Space Environments Conference 2010, Canada, August 2-5, 2010.
[15] Hauk T., Roisman I., Tropea C. Investigation of the melting behavior of ice particles in an acoustic levitator. In 11th AIAA/ASME Joint Thermophysics and Heat Transfer Conference, USA, June 16-20, 2014.
[16] Davison C.R., MaCleod J.D., Chalmers J.L. Droplet evaporation model for determining liquid water content in engine icing tunnels and examination of the factors affecting liquid water content. 9th AIAA Atmospheric and Space Environments Conference, AIAA 2017-4246, Session: Fundamentals of Engine Ice Crystal Icing, 2017.
[17] Bartkus T.P., Struk P., Tsao J.C. Development of a coupled air and particle thermal model for engine icing test facilities. SAE Int. J. Aerosp., 8:15-32, 2015.
[18] Spalart P.R., Allmaras S.R. A one-equation turbulence model for aerodynamic flows. 30th AIAA Aerospace Sciences Meeting and Exhibit, 1992-0439, 1992.
[19] Crowe C., Sommerfeld M., Tsuji Y. Multiphase flows with droplets and particles (2nd edition). CRC Press, New Youk, 2002.
[20] Zhang Y., Ozcer I., Nilamdeen S., Baruzzi G.S. et al. Numerical demonstration of the humidity effect in engine icing. SAE Technical Paper 2019-01-2015, 2019. https://doi.org/10.4271/2019-01-2015
Document information
Published on 25/01/21
Accepted on 03/01/21
Submitted on 25/10/20
Volume 37, Issue 1, 2021
DOI: 10.23967/j.rimni.2021.01.001
Licence: CC BY-NC-SA license
Share this document
Keywords
claim authorship
Are you one of the authors of this document?