| (7 intermediate revisions by the same user not shown) | |||
| Line 1: | Line 1: | ||
| − | <!-- | + | <!--The erosion wear mechanism of liquid-solid two-phase high pressure manifold tee pipes== |
<div class="center" style="width: auto; margin-left: auto; margin-right: auto;"> | <div class="center" style="width: auto; margin-left: auto; margin-right: auto;"> | ||
| Line 6: | Line 6: | ||
1. School of Mechatronic Engineering, Southwest Petroleum University, Chengdu, 610500, China | 1. School of Mechatronic Engineering, Southwest Petroleum University, Chengdu, 610500, China | ||
| − | + | 2. National Joint Engineering Research Center for Abrasion Control and Molding of Metal Materials, Luoyang, 471003, China | |
| − | 3. School of Thermal Engineering, Chengde Petroleum College, Cheng de, 067000, China--> | + | 3. School of Thermal Engineering, Chengde Petroleum College, Cheng de, 067000, China |
| − | == | + | --> |
| + | ==Abstract== | ||
The wall thickness of pressure pipe is often thinned due to the erosion wear, which leads to pipe failure and even safety accidents. In particular, the tee pipe is more prone to be erosive as a key component of transferring fluid with particles. Therefore, the erosion wear mechanism of high pressure manifold tee pipe based on liquid-solid two-phase flow is studied in this paper. Firstly, the standard tee pipe geometry model is established and the grid is divided. And then grid number independence is verified by the percentage difference. According to the structural characteristics of tee pipe, the wear of the inner wall under four different port combinations is predicted. In addition, the relationship between erosion rate and wall shear stress is further analyzed by fluid velocity, particle diameter and mass flow rate. Double tee pipes geometry model was established to explore the erosion wear on the inner walls. The effects of assembly length and different port combinations on erosion wear were discussed respectively. When the inlets are fixed, the wall shear stress distribution of the downstream tee pipe is mainly affected by the outlets. The assembly length mainly affects the erosion rate of the downstream tee pipe. | The wall thickness of pressure pipe is often thinned due to the erosion wear, which leads to pipe failure and even safety accidents. In particular, the tee pipe is more prone to be erosive as a key component of transferring fluid with particles. Therefore, the erosion wear mechanism of high pressure manifold tee pipe based on liquid-solid two-phase flow is studied in this paper. Firstly, the standard tee pipe geometry model is established and the grid is divided. And then grid number independence is verified by the percentage difference. According to the structural characteristics of tee pipe, the wear of the inner wall under four different port combinations is predicted. In addition, the relationship between erosion rate and wall shear stress is further analyzed by fluid velocity, particle diameter and mass flow rate. Double tee pipes geometry model was established to explore the erosion wear on the inner walls. The effects of assembly length and different port combinations on erosion wear were discussed respectively. When the inlets are fixed, the wall shear stress distribution of the downstream tee pipe is mainly affected by the outlets. The assembly length mainly affects the erosion rate of the downstream tee pipe. | ||
| Line 46: | Line 47: | ||
{| style="text-align: center; margin:auto;" | {| style="text-align: center; margin:auto;" | ||
|- | |- | ||
| − | | <math>\rho \frac{\partial \epsilon }{\partial t}=\frac{d}{dx_j}\left[\left(\mu + | + | | <math>\rho \frac{\partial \epsilon }{\partial t}=\frac{d}{dx_j}\left[\left(\mu + \frac{{\mu }_t}{{\sigma }_{\epsilon }}\right)\frac{\partial \epsilon }{\partial x_j}\right]+</math><math>\rho C_1E_{\epsilon }-\rho C_2\frac{{\epsilon }^2}{k+\sqrt{v\epsilon }}-</math><math>\rho \frac{\partial \left(\epsilon u_i\right)}{\partial x_i}</math> |
|} | |} | ||
| style="width: 5px;text-align: right;white-space: nowrap;" | (2) | | style="width: 5px;text-align: right;white-space: nowrap;" | (2) | ||
| Line 102: | Line 103: | ||
{| style="text-align: center; margin:auto;" | {| style="text-align: center; margin:auto;" | ||
|- | |- | ||
| − | | <math>F_{VM}=C_{VM}\frac{\rho }{{\rho }_p}\left[u_p\left(u- | + | | <math>F_{VM}=C_{VM}\frac{\rho }{{\rho }_p}\left[u_p\left(u- u_p\right)-\frac{du_p}{dt}\right]</math> |
|} | |} | ||
| style="width: 5px;text-align: right;white-space: nowrap;" | (7) | | style="width: 5px;text-align: right;white-space: nowrap;" | (7) | ||
| Line 264: | Line 265: | ||
| colspan="1" style="padding:10px;"| '''Figure 6'''. Erosion rate and wall shear stress | | colspan="1" style="padding:10px;"| '''Figure 6'''. Erosion rate and wall shear stress | ||
|} | |} | ||
| − | |||
===4.2 Effect of flow velocity === | ===4.2 Effect of flow velocity === | ||
| Line 337: | Line 337: | ||
==5. Effect of double tee tubes== | ==5. Effect of double tee tubes== | ||
| − | In the process of fracturing, multiple tee pipes are often arranged and connected to multiple fracturing trucks in order to increase the flow rate of the main pipe. As shown in | + | In the process of fracturing, multiple tee pipes are often arranged and connected to multiple fracturing trucks in order to increase the flow rate of the main pipe. As shown in [[#img-13|Figure 13]], the geometry model of double tee pipe is established. The assembly lengths are 1100 mm, 1200mm, 1300mm, 1400mm and 1500 mm, respectively. For example, port A and port B as imports, port c and port d as exports to study the effect of different combinations on erosion. The inlet velocity is 15 m/s or 7.5m/s. |
| − | + | <div id='img-13'></div> | |
| − | + | {| style="text-align: center; border: 1px solid #BBB; margin: 1em auto; width: auto;max-width: auto;" | |
| − | <div id= | + | |- |
| − | + | |style="padding:10px;"| [[Image:Draft_Z_532072942-image24.jpeg|600px]] | |
| + | |- style="text-align: center; font-size: 75%;" | ||
| + | | colspan="1" style="padding:10px;"| '''Figure 13'''. Geometry model of double tee pipe | ||
| + | |} | ||
===5.1 Effect of assembly length=== | ===5.1 Effect of assembly length=== | ||
| − | + | The flow mode of port A as a inlet and port c and d as two outlets is chosen. And the fluid flow velocity is 15 m/s. With the increase of assembly length, the erosion dent of upstream tee pipe is no change, as shown in [[#img-14|Figure 14]]. Due to the port B is set to the rebound wall, the erosion area at the junction of the upstream tee pipe occurs only on one side. The erosion dent of downstream tee pipe occurred on the corners and port c section pipe. However, with the assembly length increases, the erosion dent of upper corner disappeared gradually. This is consistent with the results in a single tee pipe (Type-B). | |
| − | + | The high wall shear stress mainly occurs in the downstream section of the upstream tee pipe and a branch pipe of the downstream tee pipe ([[#img-15|Figure 15]]). The wall shear stress decreases in the transitional pipe. The longer the assembly length, the longer the transitional area of wall shear stress. | |
| − | + | The maximum erosion rate and the maximum wall shear stress decrease first and then increase and decrease late with the increase of assembly length, and the minimum value is obtained at <math>H=1300</math>mm ([[#img-16|Figure 16]]). However, the average erosion rate decreases with the increase of assembly length and remains basically unchanged. Changes of average wall shear stress is similar to the maximum wall shear stress, but its minimum value is obtained at <math>H=1200</math>mm. | |
| − | [[Image:Draft_Z_532072942-image25.jpeg|528px]] | + | <div id='img-14'></div> |
| + | {| style="text-align: center; border: 1px solid #BBB; margin: 1em auto; width: auto;max-width: auto;" | ||
| + | |- | ||
| + | |style="padding:10px;"| [[Image:Draft_Z_532072942-image25.jpeg|528px]] | ||
| + | |- style="text-align: center; font-size: 75%;" | ||
| + | | colspan="1" style="padding:10px;"| '''Figure 14'''. Erosion contours | ||
| + | |} | ||
| − | |||
| − | |||
| − | [[Image:Draft_Z_532072942-image26.jpeg|486px]] | + | <div id='img-15'></div> |
| + | {| style="text-align: center; border: 1px solid #BBB; margin: 1em auto; width: auto;max-width: auto;" | ||
| + | |- | ||
| + | |style="padding:10px;"| [[Image:Draft_Z_532072942-image26.jpeg|486px]] | ||
| + | |- style="text-align: center; font-size: 75%;" | ||
| + | | colspan="1" style="padding:10px;"| '''Figure 15'''. Wall shear stress | ||
| + | |} | ||
| − | |||
| − | |||
| − | + | <div id='img-16'></div> | |
| − | + | {| style="text-align: center; border: 1px solid #BBB; margin: 1em auto; width: auto;max-width: auto;" | |
| − | <div id= | + | |- |
| − | + | |style="padding:10px;"| [[Image:Draft_Z_532072942-image27.jpeg|498px]] | |
| + | |- style="text-align: center; font-size: 75%;" | ||
| + | | colspan="1" style="padding:10px;"| '''Figure 16'''. Erosion rate and wall shear stress | ||
| + | |} | ||
===5.2 Effect of port combinations=== | ===5.2 Effect of port combinations=== | ||
| − | In order to study the erosion wear mechanism of double tee pipe under different port combinations, 6 combination methods are set up. Such as type-a of port a and b as inlets and port c and d as outlets, type-b of port a and b as inlets and port c as outlet, type-c of port a and b as inlets and port d as outlet, type-d of port a as inlet and port c and d as outlets, type-e of port a as inlet and port c as outlet and type-f of port a as inlet and port d as outlet. The inlet velocity is 7.5 m/s as fluid flow through two ports, and the inlet velocity is 15 m/s as the fluid flow through one port. | + | In order to study the erosion wear mechanism of double tee pipe under different port combinations, 6 combination methods are set up. Such as type-a of port a and b as inlets and port c and d as outlets, type-b of port a and b as inlets and port c as outlet, type-c of port a and b as inlets and port d as outlet, type-d of port a as inlet and port c and d as outlets, type-e of port a as inlet and port c as outlet and type-f of port a as inlet and port d as outlet. The inlet velocity is 7.5 m/s as fluid flow through two ports, and the inlet velocity is 15 m/s as the fluid flow through one port. The erosion dent of the upstream tee pipe mainly occurs at the junction and downstream ([[#img-17|Figure 17]]). However, the erosion area of the downstream tee pipe varies with the outlet position. The most prone to erosive is the two corners of the downstream tee pipe. |
| − | + | The distribution of wall shear stress is mainly related to the direction of fluid flow, as shown in [[#img-18|Figure 18]]. If only the port a is inlet, there will be seen obviously the shear stress distribution on the pipe wall. The wall shear stress distribution on the transitional pipe section is similar, and the shear stress decreases gradually from upstream to downstream. The wall shear stress distribution of the downstream tee pipe is mainly related to the opening and closing of the port c. As the opening of the port c, the shear stress of the downstream tee pipe is mainly distributed in the branch pipe. | |
| − | + | When the port a and b are inlets, the maximum erosion rate changes greatly, and the maximum erosion rate is obtained at type-b ([[#img-19|Figure 19]]). However, the distribution of wall shear stress under the same inlet is more uniform. The wall shear stress at two inlets is larger than that at one inlet. | |
| − | [[Image:Draft_Z_532072942-image28.jpeg|504px]] | + | <div id='img-17'></div> |
| + | {| style="text-align: center; border: 1px solid #BBB; margin: 1em auto; width: auto;max-width: auto;" | ||
| + | |- | ||
| + | |style="padding:10px;"| [[Image:Draft_Z_532072942-image28.jpeg|504px]] | ||
| + | |- style="text-align: center; font-size: 75%;" | ||
| + | | colspan="1" style="padding:10px;"| '''Figure 17'''. Erosion contours | ||
| + | |} | ||
| − | |||
| − | |||
| − | [[Image:Draft_Z_532072942-image29.jpeg|492px]] | + | <div id='img-18'></div> |
| + | {| style="text-align: center; border: 1px solid #BBB; margin: 1em auto; width: auto;max-width: auto;" | ||
| + | |- | ||
| + | |style="padding:10px;"| [[Image:Draft_Z_532072942-image29.jpeg|492px]] | ||
| + | |- style="text-align: center; font-size: 75%;" | ||
| + | | colspan="1" style="padding:10px;"| '''Figure 18'''. Wall shear stress | ||
| + | |} | ||
| − | |||
| − | |||
| − | + | <div id='img-19'></div> | |
| − | + | {| style="text-align: center; border: 1px solid #BBB; margin: 1em auto; width: auto;max-width: auto;" | |
| − | <div id= | + | |- |
| − | + | |style="padding:10px;"| [[Image:Draft_Z_532072942-image30.jpeg|468px]] | |
| + | |- style="text-align: center; font-size: 75%;" | ||
| + | | colspan="1" style="padding:10px;"| '''Figure 19'''. The maximum erosion rate and wall shear stress | ||
| + | |} | ||
==6. Conclusion== | ==6. Conclusion== | ||
| Line 402: | Line 427: | ||
==References== | ==References== | ||
| − | < | + | <div class="auto" style="text-align: left;width: auto; margin-left: auto; margin-right: auto;font-size: 85%;"> |
| + | |||
| + | [1] Finnie I. Erosion of surfaces by solid particles. Wear, 3(2):87-103, 1960. | ||
| + | |||
| + | [2] Sheldon G.L., Finnie I. On the ductile behavior of nominally brittle materials during erosive cutting. Journal of Engineering for Industry, 88(4):387, 1966. | ||
| − | [ | + | [3] Shirazi S.A., Shadley J.R., Mclaury B.S., Rybicki E.F. A procedure to predict solid particle erosion in elbows and tees. Journal of Pressure Vessel Technology, 117(1):45-52, 1995. |
| − | [ | + | [4] Shirazi S.A., Mclaury B.S., Shadley J.R., Rybicki E.F. Generalization of the API RP 14E guideline for erosive services. Journal of Petroleum Technology, 47(8):693-698, 1995. |
| − | [ | + | [5] Whalley Y.C.B . Gas-liquid annular flow at a vertical tee junction—Part I. Flow separation. International Journal of Multiphase Flow, 21(4):569-589, 1995. |
| − | [ | + | [6] Edwards J.K., McLaury B.S, Shirazi S.A. Modeling solid particle erosion in elbows and plugged tees. Journal of Energy Resources Technology, 2001, 123(4):277-284. |
| − | [ | + | [7] Mansouri A., Arabnejad H., Karimi S., et al. Improved CFD modeling and validation of erosion damage due to fine sand particles. Wear, 2015:339-350. |
| − | [ | + | [8] Parsi M., Kara M., Agrawal M., Kesana N., Jatale A., Sharma P., Shirazi S. CFD simulation of sand particle erosion under multiphase flow conditions. Wear, 376–377:1176-1184, Part B, 2017. |
| − | [ | + | [9] Chen X., Mclaury B.S., Shirazi S.A. A comprehensive procedure to estimate erosion in elbows for gas/liquid/sand multiphase flow. Journal of Energy Resources Technology, 128(1):70-78, 2006. |
| − | [ | + | [10] Zhang Y., Mclaury B.S., Shirazi S.A. Improvements of particle near-wall velocity and erosion predictions using a commercial CFD code. Journal of Fluids Engineering, 131(3):031303, 2009. |
| − | [ | + | [11] Zhang J., Yi H., Huang Z., Du J. Erosion mechanism and sensitivity parameter analysis of natural gas bending pipeline. Journal of Pressure Vessel Technology, 4:1-43, 2019. |
| − | [ | + | [12] Vieira R.E., Mansouri A., Mclaury B.S., Shirazi S.A. Experimental and computational study of erosion in elbows due to sand particles in air flow. Powder Technology, 288:339-353, 2016. |
| − | + | [13] Zhang J.X., Bai Y.Q., Kang J., Wu X. Failure analysis and erosion prediction of tee junction in fracturing operation. Journal of Loss Prevention in the Process Industries, 46:94-107, 2017. | |
| − | [ | + | [14] Zhang J., Fan J., Wang T., Wang X. Experimental study and numerical simulation of erosion wear on high-pressure pipe and tee. International Conference on Pipelines and Trenchless Technology, 2013:927-934. |
| − | + | [15] Masud A., Calderer R. A variational multiscale stabilized formulation for the incompressible Navier–Stokes equations. Computational Mechanics, 44(2):145-160, 2009. | |
| − | [ | + | [16] Sedano-de la Rosa C., Vite-Torres M., Godínez-Salcedo J.G., Gallardo-Hernández E.A., Cuamatzi-Melendez R., Farfán-Cabrera L.I. Erosion-corrosion of X-52 steel pipe under turbulent swirling impinging jets. Wear, 376–377:549-556, Part A, 2017. |
| − | [ | + | [17] Chucri Pereira G., de Souza F.J., Martins D.A.d.M . Numerical prediction of the erosion due to particles in elbows. Powder Technology, 261:105-117, 2014. |
| − | [ | + | [18] Forder A., Thew M., Harrison D. A numerical investigation of solid particle erosion experienced within oilfield control valves. Wear, 216(2):184-193, 1998. |
| − | [ | + | [19] Sommerfeld M., Huber N. Experimental analysis and modelling of particle-wall collisions. International Journal of Multiphase Flow, 25(6-7):1457-1489, 1999. |
| − | [ | + | [20] Oka Y.I., Okamura K., Yoshida T. Practical estimation of erosion damage caused by solid particle impact. Part 1: Effects of impact parameters on a predictive equation. Wear, 2005, 259(1–6):95-101. |
| − | [ | + | [21] Oka Y.I., Yoshida T. Practical estimation of erosion damage caused by solid particle impact. Part 2: Mechanical properties of materials directly associatedwith erosion damage. Wear, 259(1–6):102-109, 2005. |
| − | + | </div> | |
Latest revision as of 15:57, 14 December 2021
Abstract
The wall thickness of pressure pipe is often thinned due to the erosion wear, which leads to pipe failure and even safety accidents. In particular, the tee pipe is more prone to be erosive as a key component of transferring fluid with particles. Therefore, the erosion wear mechanism of high pressure manifold tee pipe based on liquid-solid two-phase flow is studied in this paper. Firstly, the standard tee pipe geometry model is established and the grid is divided. And then grid number independence is verified by the percentage difference. According to the structural characteristics of tee pipe, the wear of the inner wall under four different port combinations is predicted. In addition, the relationship between erosion rate and wall shear stress is further analyzed by fluid velocity, particle diameter and mass flow rate. Double tee pipes geometry model was established to explore the erosion wear on the inner walls. The effects of assembly length and different port combinations on erosion wear were discussed respectively. When the inlets are fixed, the wall shear stress distribution of the downstream tee pipe is mainly affected by the outlets. The assembly length mainly affects the erosion rate of the downstream tee pipe.
Keywords: High pressure manifold, tee pipe, liquid-solid two-phase flow, erosion wear
1. Introduction
High pressure manifold plays an important role in the development of unconventional oil and gas such as shale gas, dense gas and heavy oil. Due to the uneven force of the high pressure fracturing fluid, the vibration and erosion of the high pressure pipe will be caused when entering the high pressure pipe sink. The fracturing fluid enters the main pipe through each inlet branch pipe and changes the flow direction at the junction. The solid support carried by the fluid is easier to hit the wall and cause erosion dent. Due to the support in fracturing fluid is indispensable, it is necessary to analyze the erosion mechanism of the tee pipe in the high pressure manifold.
From the existing failure samples of high pressure pipe, it can be seen that the solid support scratches the angle cutting of the inner wall, which leads to the thinning of the pipe wall, which is the main reason for the failure of the pipe. Finnie [1,2] suggested the relationship between impact angle and wear amount of erosion under low impact angle is described. The erosion wear mechanism of plastic particles at low impact angle is micro-cutting. According to the viewpoint of energy conservation before and after erosion process, the cutting-deformation theory is put forward [3]. After a variety of monitoring methods, it is proved that the two wear modes act on the inner wall of the pipeline [4-6].
After many experiments and simulation, it is very effective to calculate the wear rate of pipe inner wall by CFD method. The establishment of fluid domain model and grid division, the setting of reasonable boundary conditions and initial conditions, the selection of appropriate solutions, and finally the correct simulation results. The erosion mechanism of the pipeline is predicted by tracking the trajectory of the particles and the erosion cloud map. Both CFD-DPM and CFD-DEM methods are often used to solve two-phase flows [7,8]. CFD-DPM method neglects the interaction between particles and the volume of particles itself, so it is suitable for dilute phase flow with solid phase volume fraction less than 10%. CFD-DEM method takes into account the interaction between particles and fluids, so it is suitable for two-phase flow with large solid concentration [9,10]. The volume fraction of solid support in sand fracturing is small and belongs to dilute phase flow. Hence, the CFD-DPM method is chosen in this paper.
The structure of the tee tube is more complex than the bend pipe, and the flow state is more complex. In the past time, a large number of simulation calculations and experiments have been completed, which fully prove the accuracy of the erosion rate prediction equation and provide great convenience for predicting the erosion rate of the three-way pipe. Zhang [11] analyzed the erosion wear mechanism and sensitivity parameter of elbow, and the effect of assembly angle and distance of double elbow was further explored. Vieira [12] proposed a comprehensive modeling and computational research method to determine elbow erosion due to entrained sand particles in the air. Zhang [13] discussed the erosion of tee tubes under different flow types during fracturing operations. Zhang [14] studied experimentally the main factors affecting the impact angle and impact velocity of high pressure tube and three-way pipe.
In this paper, the Computational Fluid Dynamics-Discrete Phase Model (CFD-DPM)is used to predict the erosion dent of a single tee pipe. The erosion rate and wall shear stress under various parameters (based on port combination, flow velocity, particle diameter and mass flow rate) is calculated. Otherwise, the erosion wear mechanism of double tee pipes (based on different port combinations, assembly length) is discussed.
2. Mathematical model
Water as a continuous phase is described by the Euler method. The solid supports in water flow are described as discrete phases by the Lagrangian method. Calculation of turbulent field in pipe is mostly done by solving Average Navier-Stokes Equations (ANSE) [15]. Due to the Average N-S equations are not closed, it is necessary to introduce turbulence model to close the equations. Hence, the achievable k-ε model is selected in this work, which performs better when calculating flow separation and complex secondary flow [16]
|
|
(1) |
|
|
(2) |
where is turbulent kinetic energy (J), is the production of turbulent kinetic energy, is the dissipation rate, is the number of Prandtl corresponding to turbulent kinetic energy, is laminar viscosity coefficient, is turbulent viscosity coefficient. is the number of Prandtl corresponding dissipation rates, and are empirical constant. is kinematic viscosity, .
In dilute phase flow, the interaction between particles and the rotation of particles themselves are not considered. According to Newton's second law, the resultant force acting on the particles is:
|
|
(3) |
while,
|
|
(4) |
|
|
(5) |
|
|
(6) |
|
|
(7) |
|
|
(8) |
where is continuous phase velocity, is particles velocity, is gravity acceleration, is density, is continuous phase dynamic viscosity, is particle diameter, is relative Reynolds number, is lift constant, is virtual quality factor of 0.5.
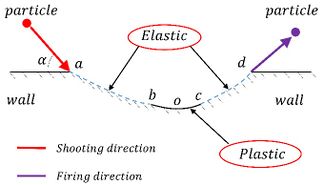
Tracking the trajectory of solid particles is a key step in predicting erosion by the Euler-Lagrange method. The important point is the momentum loss after the collision between the particles and the wall. The collision relationship between particles and walls is shown in Figure 1. There are several particle wall rebound models [17-19]. Particle-wall collision rebound model proposed by Forder is selected in this paper
|
|
(9) |
|
|
(10) |
|
| Figure 1. The collision of particles and wall |
Based on different collision materials and fluid properties, many scholars have proposed a variety of erosion wear models [2,20,21]. But the application of these models is narrow. In this paper, a widely used erosion model is selected
|
|
(11) |
where is the particle diameter function of solid phase particle, is the impact angle function, is the velocity exponent function; represents pipeline wall surface area. When the boundary condition is set, it is necessary to set the wall properties. Then general taking constant of 1.8e-9, general taking constant of 2.6.
3. Problem description
3.1 Geometry model and grid
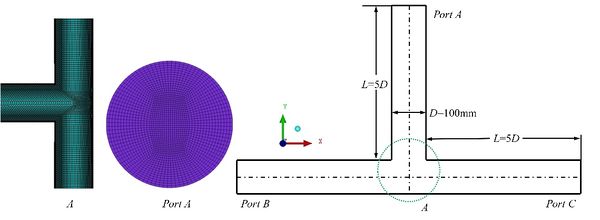
As shown in Figure 2, there are XOY plane of the tee pipe, grids of local and port A. The pipe is made of carbon steel, density of 7000 kg/m3, Young's modulus of 210 GPa and Poisson's ratio of 0.3. Pipe diameter is 100 mm, all three branches are 5D. The density of water and the viscosity keep constant. The particles are inert particles, which is no shape change occurs. The inlet velocity of particles and water is consistent. The form of inlet and outlet is set to escape. The wall is a fixed non-slip wall, and roughness constant is 0.5. The wall form is rebound. The flow rate of water is 15m/s or 7.5 m/s, which depending on the change of inlet quantity. The mass flow rate of solid support is 0.01kg/s to 0.06kg/s. The diameter of supports varies 0.2mm to 0.6 mm. A pressure-based SIMPLI algorithm is used to solve the problem.
|
| Figure 2. Geometry model and grid |
3.2 Grid validation
Reasonable mesh type and size help to improve the accuracy of simulation results. In order to deal with the problem of viscous flow near the wall, the boundary layer mesh is needed. Therefore, the grid boundary layer is divided into 8 layers to adapt to the boundary fluid flow. The mesh size is refined until the mesh size changes and the calculation results are basically unchanged. Therefore, five different numbers of grids are divided, namely 192645,306451,452611,684615 and 845613. The effect of grid number on calculation results is eliminated by comparing the result difference caused by the increase of grid number. As shown in Table 1, the percentage difference between mesh 1 and mesh 2 is 9.03%. However, the percentage difference between mesh 4 and mesh 5 is only 0.7%. The mesh 4 is selected to reduce computational time and effort with the minimum orthogonal quality close to 6.8.
| Mesh | Mesh number | emax | Percentage difference |
|---|---|---|---|
| 1 | 192645 | 1.69e-7 | / |
| 2 | 306451 | 1.55e-7 | 9.03% |
| 3 | 452611 | 1.47e-7 | 5.44% |
| 4 | 684615 | 1.43e-7 | 2.8% |
| 5 | 845613 | 1.42e-7 | 0.7% |
4. Calculation results and discussion
4.1 Effect of port combinations
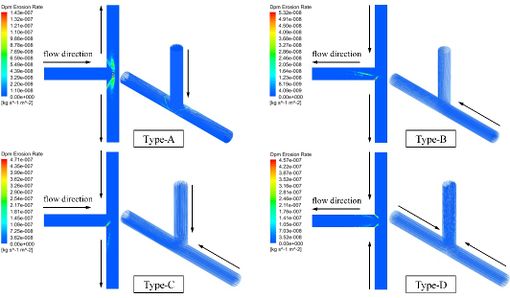
According to the symmetry of the tee pipe, there are 4 different port combinations in total. For example: type-A of port A as inlet and port B and C as outlets, type-B of port C as inlets and port A and B as outlets, type-C of port A and C as inlets and port B as outlet and type-D of port B and C as inlets and port A as outlet. On Type-A and Type-B, with only one inlet, so it is set the inlet velocity to 15 m/s. while the inlet velocity of Type-C and Type-D is set to 7.5 m/s. The particle diameter is 0.2 mm and the particle mass flow rate is 0.01 kg/s.
Figure 3 shows that the flow of water in the upstream section is relatively stable with no vortex, so there is no erosion dent occurred. When the fluid flows through the pipe junction, the flow direction changes and the eddy current region is formed downstream. The direction of particle motion also changes, so the frequency of impact wall increases, resulting in erosion indentation at pipe junction and downstream pipe section.
Due to the branches are perpendicular to each other, the water is easy to directly impact on the wall and cause momentum loss (Figure 4). Under different port combinations, tee pipes may play the role of confluence or diversion. The greater the maximum velocity is in the pipe. Due to the different action of pipe junction on fluid, the fluid is told to be distributed in the downstream section. However, with the appearance of high speed flow, eddy current appears in the same pipe section position.
The shear stress on the wall is mainly caused by fluid flow. Because of the carrying capacity of fluid to solid particles, the part with large shear stress is also the main impact part of particles. As shown in Figure 5, high wall shear stress is mainly concentrated in the downstream section. When the fluid flows through the junction of the pipe, the flow direction changes, and the fluid after the diversion or confluence will flow along one side of the pipe wall, which intensifies the shear of the pipe wall.
|
| Figure 3. Erosion contours and particles |

|
| Figure 4. Velocity distributions |

|
| Figure 5. Wall shear stress |
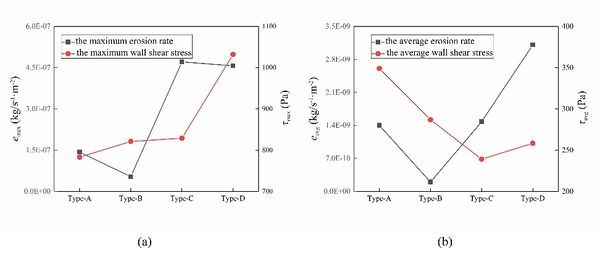
The erosion rate and wall shear stress of 4 different port combinations are shown in Figure 6. The erosion rate after confluence is larger than that after shunting, and the wall shear stress is larger. However, the distribution of average erosion rate and average shear stress varies. Type-a average shear stress is the largest. Type-d has the largest average erosion rate.
|
| Figure 6. Erosion rate and wall shear stress |
4.2 Effect of flow velocity
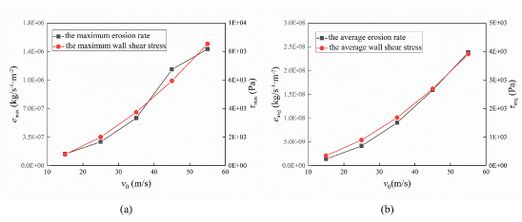
Type-a is chosen to explain the effect of flow velocity on erosion wear of tee pipes. The flow velocity increases from 15 m/s to 55 m/s with increment of 10m/s. The particle diameter and particle mass flow rate remain 0.2 mm and 0.01 kg/s. as shown in the Figure 7, both the erosion rate and wall shear stress increase with the increases of flow velocity. The average erosion rate varies and average wall shear stress is consistent with the change of maximum erosion rate and maximum wall shear stress.
|
| Figure 7. Erosion rate and wall shear stress |
The erosion area increases with the increases of flow velocity (Figure 8). The main erosion area is still concentrated at the junction of the tee pipe. The inlet velocity increases and the kinetic energy carried by the particles increases, so the erosion of the pipe wall becomes more and more serious.

|
| Figure 8. Erosion contours |
4.3 Effect of particle mass flow
Figure 9 shows that the size of the erosion area did not change significantly. The increases of particle mass flow did not change the movement of particles. With the increase of particle concentration, the number of particles impinging at the same position increases, which exacerbates the loss of wall mass. Therefore, the increase of particle mass flow rate intensifies the wear degree of pipe wall.
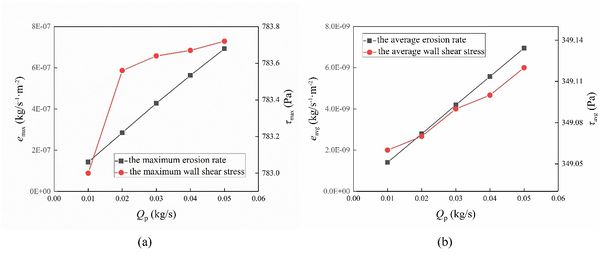
Both the erosion rate and wall shear stress increase with particle mass flow, as shown in Figure 10. However, the variation of wall shear stress is small. The maximum erosion rate and the average erosion rate increase linearly with the increase of particle mass flow rate.

|
| Figure 9. Erosion contours |
|
| Figure 10. Erosion rate and wall shear stress |
4.4 Effect of particle diameter
Figure 11 shows that the erosion region changes with increasing particle diameter. The erosion area at the junction of the pipe is gradually transferred from the side to the bottom. There is still no erosion dent at the bottom of the intersection facing the inlet section. This is due to the flow of fluid to the bottom of the pipe, forming a slow flow layer with a fluid velocity of almost 0. And because of the carrying capacity of the fluid to the particles, the particles did not hit the bottom of the pipe junction.
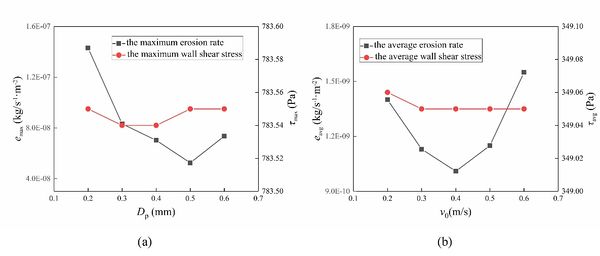
The maximum erosion rate and the average erosion rate increase first and then decrease with the increases of solid particle diameter (Figure 12). A change in the maximum erosion rate occurs at particle diameter of 0.5 mm. While the average erosion rate changes at 0.4 mm. However, the wall shear stress does not change, so the diameter of the particles does not affect the wall shear.

|
| Figure 11. Erosion contours |
|
| Figure 12. Erosion rate and wall shear stress |
5. Effect of double tee tubes
In the process of fracturing, multiple tee pipes are often arranged and connected to multiple fracturing trucks in order to increase the flow rate of the main pipe. As shown in Figure 13, the geometry model of double tee pipe is established. The assembly lengths are 1100 mm, 1200mm, 1300mm, 1400mm and 1500 mm, respectively. For example, port A and port B as imports, port c and port d as exports to study the effect of different combinations on erosion. The inlet velocity is 15 m/s or 7.5m/s.

|
| Figure 13. Geometry model of double tee pipe |
5.1 Effect of assembly length
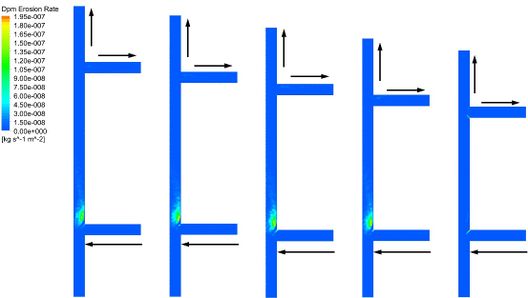
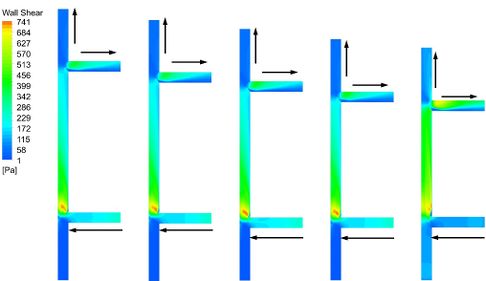
The flow mode of port A as a inlet and port c and d as two outlets is chosen. And the fluid flow velocity is 15 m/s. With the increase of assembly length, the erosion dent of upstream tee pipe is no change, as shown in Figure 14. Due to the port B is set to the rebound wall, the erosion area at the junction of the upstream tee pipe occurs only on one side. The erosion dent of downstream tee pipe occurred on the corners and port c section pipe. However, with the assembly length increases, the erosion dent of upper corner disappeared gradually. This is consistent with the results in a single tee pipe (Type-B).
The high wall shear stress mainly occurs in the downstream section of the upstream tee pipe and a branch pipe of the downstream tee pipe (Figure 15). The wall shear stress decreases in the transitional pipe. The longer the assembly length, the longer the transitional area of wall shear stress.
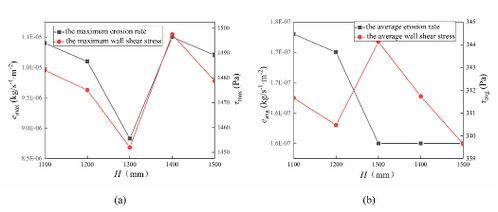
The maximum erosion rate and the maximum wall shear stress decrease first and then increase and decrease late with the increase of assembly length, and the minimum value is obtained at mm (Figure 16). However, the average erosion rate decreases with the increase of assembly length and remains basically unchanged. Changes of average wall shear stress is similar to the maximum wall shear stress, but its minimum value is obtained at mm.
|
| Figure 14. Erosion contours |
|
| Figure 15. Wall shear stress |
|
| Figure 16. Erosion rate and wall shear stress |
5.2 Effect of port combinations
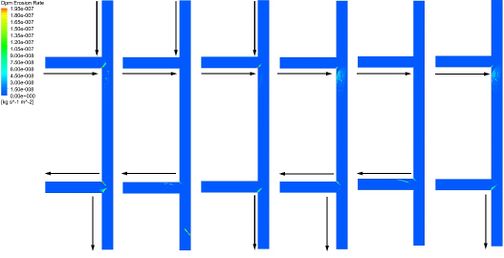
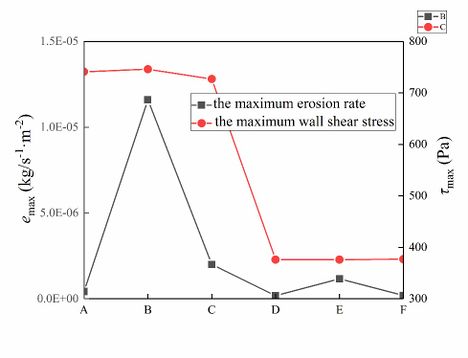
In order to study the erosion wear mechanism of double tee pipe under different port combinations, 6 combination methods are set up. Such as type-a of port a and b as inlets and port c and d as outlets, type-b of port a and b as inlets and port c as outlet, type-c of port a and b as inlets and port d as outlet, type-d of port a as inlet and port c and d as outlets, type-e of port a as inlet and port c as outlet and type-f of port a as inlet and port d as outlet. The inlet velocity is 7.5 m/s as fluid flow through two ports, and the inlet velocity is 15 m/s as the fluid flow through one port. The erosion dent of the upstream tee pipe mainly occurs at the junction and downstream (Figure 17). However, the erosion area of the downstream tee pipe varies with the outlet position. The most prone to erosive is the two corners of the downstream tee pipe.
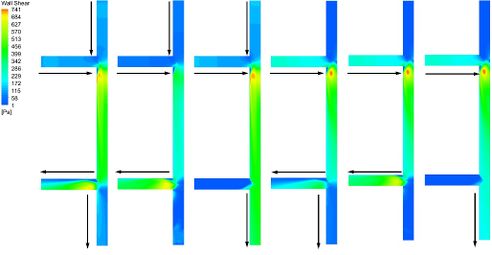
The distribution of wall shear stress is mainly related to the direction of fluid flow, as shown in Figure 18. If only the port a is inlet, there will be seen obviously the shear stress distribution on the pipe wall. The wall shear stress distribution on the transitional pipe section is similar, and the shear stress decreases gradually from upstream to downstream. The wall shear stress distribution of the downstream tee pipe is mainly related to the opening and closing of the port c. As the opening of the port c, the shear stress of the downstream tee pipe is mainly distributed in the branch pipe.
When the port a and b are inlets, the maximum erosion rate changes greatly, and the maximum erosion rate is obtained at type-b (Figure 19). However, the distribution of wall shear stress under the same inlet is more uniform. The wall shear stress at two inlets is larger than that at one inlet.
|
| Figure 17. Erosion contours |
|
| Figure 18. Wall shear stress |
|
| Figure 19. The maximum erosion rate and wall shear stress |
6. Conclusion
- 1. By analyzing the influence of four combinations on erosion wear, it is found that the erosion rate in confluence state is larger than that in shunt state. With the increase of flow rate, the erosion rate and shear stress of the wall increase. With the increase of particle mass flow rate, the erosion rate and shear stress of the wall increase, but the value of maximum shear stress and average shear stress does not change much. With the increase of particle diameter, the maximum erosion rate and average rate of the wall decrease first and then increase, but the inflection point is different, and the shear stress of the wall remains basically unchanged.
- 2. Due to the port B is set to the rebound wall, the erosion area at the junction of the upstream tee pipe occurs only on one side. The erosion dent of downstream tee pipe occurred on the corners and port c section pipe. However, with the assembly length increases, the erosion dent of upper corner disappeared gradually. The longer the assembly length, the longer the transitional area of wall shear stress. The most prone to be erosive is the two corners of the downstream tee pipe under different port combinations. In addition, the wall shear stress distribution of the downstream tee pipe is mainly related to the opening and closing of the port c.
Acknowledgements
This work is supported by Open Fund of National Joint Engineering Research Center for Abrasion Control and Molding of Metal Materials (HKDNM201806).
References
[1] Finnie I. Erosion of surfaces by solid particles. Wear, 3(2):87-103, 1960.
[2] Sheldon G.L., Finnie I. On the ductile behavior of nominally brittle materials during erosive cutting. Journal of Engineering for Industry, 88(4):387, 1966.
[3] Shirazi S.A., Shadley J.R., Mclaury B.S., Rybicki E.F. A procedure to predict solid particle erosion in elbows and tees. Journal of Pressure Vessel Technology, 117(1):45-52, 1995.
[4] Shirazi S.A., Mclaury B.S., Shadley J.R., Rybicki E.F. Generalization of the API RP 14E guideline for erosive services. Journal of Petroleum Technology, 47(8):693-698, 1995.
[5] Whalley Y.C.B . Gas-liquid annular flow at a vertical tee junction—Part I. Flow separation. International Journal of Multiphase Flow, 21(4):569-589, 1995.
[6] Edwards J.K., McLaury B.S, Shirazi S.A. Modeling solid particle erosion in elbows and plugged tees. Journal of Energy Resources Technology, 2001, 123(4):277-284.
[7] Mansouri A., Arabnejad H., Karimi S., et al. Improved CFD modeling and validation of erosion damage due to fine sand particles. Wear, 2015:339-350.
[8] Parsi M., Kara M., Agrawal M., Kesana N., Jatale A., Sharma P., Shirazi S. CFD simulation of sand particle erosion under multiphase flow conditions. Wear, 376–377:1176-1184, Part B, 2017.
[9] Chen X., Mclaury B.S., Shirazi S.A. A comprehensive procedure to estimate erosion in elbows for gas/liquid/sand multiphase flow. Journal of Energy Resources Technology, 128(1):70-78, 2006.
[10] Zhang Y., Mclaury B.S., Shirazi S.A. Improvements of particle near-wall velocity and erosion predictions using a commercial CFD code. Journal of Fluids Engineering, 131(3):031303, 2009.
[11] Zhang J., Yi H., Huang Z., Du J. Erosion mechanism and sensitivity parameter analysis of natural gas bending pipeline. Journal of Pressure Vessel Technology, 4:1-43, 2019.
[12] Vieira R.E., Mansouri A., Mclaury B.S., Shirazi S.A. Experimental and computational study of erosion in elbows due to sand particles in air flow. Powder Technology, 288:339-353, 2016.
[13] Zhang J.X., Bai Y.Q., Kang J., Wu X. Failure analysis and erosion prediction of tee junction in fracturing operation. Journal of Loss Prevention in the Process Industries, 46:94-107, 2017.
[14] Zhang J., Fan J., Wang T., Wang X. Experimental study and numerical simulation of erosion wear on high-pressure pipe and tee. International Conference on Pipelines and Trenchless Technology, 2013:927-934.
[15] Masud A., Calderer R. A variational multiscale stabilized formulation for the incompressible Navier–Stokes equations. Computational Mechanics, 44(2):145-160, 2009.
[16] Sedano-de la Rosa C., Vite-Torres M., Godínez-Salcedo J.G., Gallardo-Hernández E.A., Cuamatzi-Melendez R., Farfán-Cabrera L.I. Erosion-corrosion of X-52 steel pipe under turbulent swirling impinging jets. Wear, 376–377:549-556, Part A, 2017.
[17] Chucri Pereira G., de Souza F.J., Martins D.A.d.M . Numerical prediction of the erosion due to particles in elbows. Powder Technology, 261:105-117, 2014.
[18] Forder A., Thew M., Harrison D. A numerical investigation of solid particle erosion experienced within oilfield control valves. Wear, 216(2):184-193, 1998.
[19] Sommerfeld M., Huber N. Experimental analysis and modelling of particle-wall collisions. International Journal of Multiphase Flow, 25(6-7):1457-1489, 1999.
[20] Oka Y.I., Okamura K., Yoshida T. Practical estimation of erosion damage caused by solid particle impact. Part 1: Effects of impact parameters on a predictive equation. Wear, 2005, 259(1–6):95-101.
[21] Oka Y.I., Yoshida T. Practical estimation of erosion damage caused by solid particle impact. Part 2: Mechanical properties of materials directly associatedwith erosion damage. Wear, 259(1–6):102-109, 2005.
Document information
Published on 15/04/21
Accepted on 06/04/21
Submitted on 17/10/20
Volume 37, Issue 2, 2021
DOI: 10.23967/j.rimni.2021.04.001
Licence: CC BY-NC-SA license
Share this document
Keywords
claim authorship
Are you one of the authors of this document?