Liqiaoyang (talk | contribs) |
|||
| (7 intermediate revisions by one other user not shown) | |||
| Line 235: | Line 235: | ||
{| style="text-align: center; border: 1px solid #BBB; margin: 1em auto; width: auto;max-width: auto;" | {| style="text-align: center; border: 1px solid #BBB; margin: 1em auto; width: auto;max-width: auto;" | ||
|- | |- | ||
| − | |style="padding:10px;"| [[File:Li_2021a_6472_Fig3.png| | + | |style="padding:10px;"| [[File:Li_2021a_6472_Fig3.png|350px]] |
<!--|style="padding:10px;"| [[Image:Draft_Li_471341650-image2.png|500px]]--> | <!--|style="padding:10px;"| [[Image:Draft_Li_471341650-image2.png|500px]]--> | ||
|- style="text-align: center; font-size: 75%;" | |- style="text-align: center; font-size: 75%;" | ||
| Line 1,042: | Line 1,042: | ||
{| style="text-align: center; border: 1px solid #BBB; margin: 1em auto; width: auto;max-width: auto;" | {| style="text-align: center; border: 1px solid #BBB; margin: 1em auto; width: auto;max-width: auto;" | ||
|- | |- | ||
| − | |style="padding:10px;"| [[File:Review_525570410955_1307_f9.png]] | + | | style="padding:10px;"| [[File:Li_2021a_5334_Fig9.png|450px]] |
| + | <!--|style="padding:10px;"| [[File:Review_525570410955_1307_f9.png]]--> | ||
|- style="text-align: center; font-size: 75%;" | |- style="text-align: center; font-size: 75%;" | ||
| colspan="1" style="padding:10px;"| '''Figure 9'''. Histogram of the frequency of the total consumption | | colspan="1" style="padding:10px;"| '''Figure 9'''. Histogram of the frequency of the total consumption | ||
| Line 1,051: | Line 1,052: | ||
{| style="text-align: center; border: 1px solid #BBB; margin: 1em auto; width: auto;max-width: auto;" | {| style="text-align: center; border: 1px solid #BBB; margin: 1em auto; width: auto;max-width: auto;" | ||
|- | |- | ||
| − | |style="padding:10px;"| [[File:Review_525570410955_2251_f10.png]] | + | |style="padding:10px;"| [[File:Li_2021a_3722_Fig10.png|450px]] |
| + | <!--|style="padding:10px;"| [[File:Review_525570410955_2251_f10.png]]--> | ||
|- style="text-align: center; font-size: 75%;" | |- style="text-align: center; font-size: 75%;" | ||
| colspan="1" style="padding:10px;"| '''Figure 10'''. Percentage graph of the total consumption | | colspan="1" style="padding:10px;"| '''Figure 10'''. Percentage graph of the total consumption | ||
| Line 1,113: | Line 1,115: | ||
{| style="text-align: center; border: 1px solid #BBB; margin: 1em auto; width: auto;max-width: auto;" | {| style="text-align: center; border: 1px solid #BBB; margin: 1em auto; width: auto;max-width: auto;" | ||
|- | |- | ||
| − | |style="padding:10px;"| [[File:Review_525570410955_2843_f11.png]] | + | |style="padding:10px;"| [[File:Li_2021a_1700_Fig11.png|450px]] |
| + | <!--|style="padding:10px;"| [[File:Review_525570410955_2843_f11.png]]--> | ||
|- style="text-align: center; font-size: 75%;" | |- style="text-align: center; font-size: 75%;" | ||
| colspan="1" style="padding:10px;"| '''Figure 11'''. Histogram of the frequency of the total wave | | colspan="1" style="padding:10px;"| '''Figure 11'''. Histogram of the frequency of the total wave | ||
| Line 1,122: | Line 1,125: | ||
{| style="text-align: center; border: 1px solid #BBB; margin: 1em auto; width: auto;max-width: auto;" | {| style="text-align: center; border: 1px solid #BBB; margin: 1em auto; width: auto;max-width: auto;" | ||
|- | |- | ||
| − | |style="padding:10px;"| [[File:Review_525570410955_2387_f12.png]] | + | |style="padding:10px;"| [[File:Li_2021a_9985_Fig12.png|450px]] |
| + | <!--|style="padding:10px;"| [[File:Review_525570410955_2387_f12.png]]--> | ||
|- style="text-align: center; font-size: 75%;" | |- style="text-align: center; font-size: 75%;" | ||
| colspan="1" style="padding:10px;"| '''Figure 12'''. Percentage graph of the total wave | | colspan="1" style="padding:10px;"| '''Figure 12'''. Percentage graph of the total wave | ||
| Line 1,139: | Line 1,143: | ||
==References== | ==References== | ||
| + | <div class="auto" style="text-align: left;width: auto; margin-left: auto; margin-right: auto;font-size: 85%;"> | ||
| − | 1. | + | [1] Sennaroglu B., Celebi G.V. A military airport location selection by ahp integrated promethee and vikor methods. Transportation Research Part D: Transport and Environment, 59:160-173, 2018. |
| − | 2 | + | [2] Li X., Luo M., Wang M. Composite strike method of conventional missile. Tactical Missile Technology, 02:46-48+74, 2008. |
| − | 3 | + | [3] Zhen Z., Feng J. A study on aim points selection method for attacking airport runway. Informatization Research, 43(01),19-21+28, 2017. |
| − | 4 | + | [4] Gao X. Application of computer-simulation in the study of bomblet dispersion. Acta Armamentarii, 02:12-18, 1989. |
| − | 5 | + | [5] Wang T., Yang P., Ouyang H. Investigation into multi-time missile warfare based on markov chain. Tactical Missile Technology, 4:20-22, 2011. |
| − | 6 | + | [6] Guangzhi B., Bin Z., Shuai S. Aimpoints Selection Method Multiwave Attack Runway with Ballistic Missiles. Fire Control & Command Control, 39(11):66-64+71, 2014. |
| − | 7 | + | [7] Zhang K., Liu Y.C., Guan S.Y. Investigation into the problem of evaluating combat effectiveness for missile weapon systems. Journal of Astronautics, 02:58-66, 2002. |
| − | + | [8] Kim J., Kim W. Simulation analysis on the effectiveness of missile defense. Journal of Peace Research, 58(03):510-522, 2020. | |
| − | 9 | + | [9] Ma B., Zhou C., Lou L., Zhang T. Automatic assessment of the attacked airports based on image analysis. Journal of Huazhong University of ence and Technology, 07:13-15, 2004. |
| − | 10 | + | [10] Miao Q.G., Liu J., Ning S.T. Battle damage assessment of airport based on fuzzy comprehensive evaluation. Systems Engineering and Electronics, 34(7):1395-1399, 2012. |
| − | 11 | + | [11] Zou H. Application of iterative learning algorithm based on data driving to the evaluation of missile penetration capability. Shipboard Electronic Countermeasure, 42(01):42-45+51, 2019. |
| − | 12 | + | [12] Feng L.P., Fan Z.E., Nie Y.F. Simulation on terminal penetration trajectory of anti-ship missile under interception conditions. DEStech Transactions on Engineering and Technology Research, 1:1-7, 2019. |
| − | 13 | + | [13] Zhang X.Y., Song G.B. Design and realization of anti-ship missile penetration simulation system based on HLA. Journal of System Simulation, 08:2350+2354. 2006. |
| − | 14 | + | [14] Xia J., Xie L.Y., Wang X.Q. Research on optimal penetration strategies of ballistic missile. Journal of Ballistics, 20(08):65-68, 2008. |
| − | 15 | + | [15] Feng D.J., Wang X.S., Liu J.Q. Jamming effect analysis of chaff cloud on ground-based radar and its application. Modern Radar, 32(06):22-26, 2010. |
| − | 16 | + | [16] Zhou Y., Wang X.S., Wang G.Y., Wang L.D., Liu Y.H. Fuzzy evaluation on radar jamming effect based on ballistic missile penetration. Systems Engineering and Electronics, 07:807-809, 2003. |
| − | 17 | + | [17] Zhao F., Li D., Wang X.S., Xiao S.P. Missile defense radar simulation system. Journal of System Simulation, 05:1190-1194, 2006. |
| − | 18 | + | [18] Yin L., Liu H., Zhao X., Shufang L.I. Research on AN/TPY-2 radar range and jamming based on radar equation. Systems Engineering and Electronics, 40(01):50-57, 2018. |
| − | 19 | + | [19] Lee J.S. Optimal sam defense system: an application of optimal control concept to operations research. IEEE Transactions on Automatic Control, 18(5):485-489, 1973. |
| − | 20 | + | [20] Hecht Jeff. Is there any way to defend against a ballistic missile?. New Scientist, 206(2762):12-12, 2010. |
| − | 21 | + | [21] Dutta D. Probabilistic analysis of anti-ship missile defence effectiveness. Defence Science Journal, 64(2):123-129, 2014. |
| − | 22 | + | [22] Bethe H.A., Garwin R.L., Gottfried K., Kendall H.W. Space-based ballistic-missile defense. Scientific American, 4(4):39-49, 1984. |
| − | 23 | + | [23] Ron N. How organizations learn: post-flight reviews in an F-16 fighter squadron. Organization Studies, 27(8):1069-1089, 2006. |
| − | 24 | + | [24] Jones D. This systems architect builds the most advanced F-16 combat simulators. IEEE Spectrum, 51(6):24-24, 2014. |
| − | 25 | + | [25] Farhat C., Geuzaine P., Brown G. Application of a three-field nonlinear fluid–structure formulation to the prediction of the aeroelastic parameters of an F-16 fighter. Computers & Fluids, 32(1):3-29, 2003. |
| − | 26 | + | [26] Holland O.T., Wallace S.E. Using agents to model the kill chain of the ballistic missile defense system. Naval Engineers Journal, 123(3):141-151, 2012. |
| − | 27 | + | [27] Marshall E. Patriot's effectiveness challenged. Science, 254(5033):791-791, 1991. |
Latest revision as of 10:20, 29 September 2021
Abstract
To solve the problem of insufficient research on missile consumption in wartime with the airport runway as the target, this paper takes the airport runway as the target, taking the invalidation probability as the expected target, and adopting conventional missiles with submunitions. In combination with penetration and anti-missile countermeasures, this paper publicly proposes the consumption calculation method and model for the first time, and the multi-wave strikes strategy and calculation method are proposed either. The model is verified by combining the specific airport runway, fighter jet model and missile parameters. The experiment calculates the total consumption and the corresponding probability of destroying the target, as well as the total strike wave and the corresponding probability of destroying the target. The results prove the effectiveness and accuracy of the method and model, and provide an important basis for the sufficient amount of missiles to attack airport runways in wartime.
Keywords: Airport runway, consumption in wartime, conventional missile, multi-wave strikes
1. Introduction
With the development of science and technology and the continuous improvement of weapons and equipment, modern warfare has increasingly shown the characteristics of high technology, high strength, and high synthesis. In a complex and changeable modern war, effectively weakening the enemy’s air military capabilities and sustained combat capabilities are of great significance to gaining the commanding heights of the war. As the main site of air raid operations, military airport is one of the key targets of the enemy. The airport runway is an important place for the fighter aircraft to take off, land, taxi and organize and guarantee aircraft activities. It is an important support for air operations and military training activities [1]. The airport runway area is large, while conventional missiles carrying submunitions are powerful, wide-ranging, accurate, and have a certain degree of intelligence [2], therefore, using conventional missiles carrying submunitions to attack airport runways is one of the important ways to block enemy airpower support and seize battlefield air supremacy. The research on missile consumption in wartime with the airport runway as the target provides an important basis for ensuring sufficient ammunition to strike the target in wartime.
At present, the related research on missile consumption in wartime with the airport runway as the target is highly confidential, and there are few published documents. When studying conventional missiles attacking airport runways, the main focus is on the impact of the aiming point on the invalidation probability with the known number of missiles [3]. Therefore, it is necessary to further study how to calculate the number of missiles that should be prepared based on the preset invalidation probability before the battle. For the research on the dispersion of sub-warheads of conventional missiles, analytical methods, statistical test methods, and simulation methods are generally used [4]. However, the analysis method cannot solve the randomness problem in the dispersion, and the statistical test method needs a large amount of data as support, which is difficult to solve. Therefore, in the dispersion study of submunitions, the simulation method is the most widely used.
Since the airport runway belongs to large military targets, it is difficult to successfully destroy it at one time. The attack on the airport usually requires multi-waves strikes [5]. How to rationally plan the various operational links of multi-wave strikes, clarify the tasks of each combat stage, and formulate scientific and reasonable multi-wave strike plans [6], which is conducive to improving the combat effectiveness of conventional missiles against the airport runway [7,8].
The main innovations of this paper are as follows:
(1) This paper publicly proposes a method for calculating the missile consumption in wartime with the airport runway as the target for the first time.
(2) Different from the traditional research of judging whether the strike effect meets the invalidation probability when the number of missiles is known, the invalidation probability is used as a preset condition, and the minimum consumption that meets the condition is calculated through the gradual increase of the strike azimuth.
(3) Incorporate penetration and anti-missile countermeasures into the consumption calculation model.
(4) Through a large number of multi-wave strike simulation experiments, calculate the maximum and minimum consumption, strike waves and the probability of destroying the target.
The main structure of this paper is as follows: Section 1 introduces the related research work and the innovative points and structure of the paper; Section 2 establishes a missile consumption simulation model in wartime with the airport runway as the target; Section 3 verifies the model through simulation experiments for the specific airport runway, and the optimal consumption, strike wave and destruction probability are calculated; Section 4 summarizes the work and conclusions of the paper.
2. A simulation model of missile consumption in wartime with the airport runway as target
Figure 1 shows the simulation process of missile consumption in wartime with the airport runway as the target.
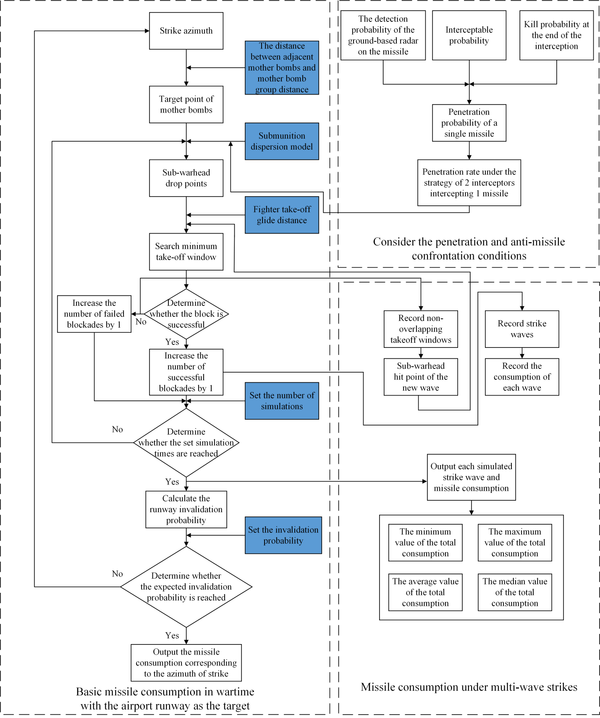
|
| Figure 1. The simulation flow chart of missile consumption in wartime with the airport runway as the target |
The simulation model is based on the following basic assumptions:
(1) Defining the opposing parties: the missile striker is the red side, and the airport party is the blue side;
(2) Regardless of the changes in the guidance process of the missile of the red side, only the final guidance accuracy of the guidance method, that is, the circular error probable (CEP), is considered;
(3) Assume that there are no dumb bombs or failures in the missiles of the red side;
(4) The launch reliability and flight reliability of the missile of the red side are not considered;
(5) Assume that the crater area of the missile of the red side is equal to the average crater area and is a perfect circle;
(6) Assuming that the airport runway of the blue side is within range;
(7) Assume that the target of the blue side is consistent with the intelligence.
2.1 Basic missile consumption in wartime with the airport runway as target
Conventional missiles carrying submunitions are generally used to strike airport runways, and In the traditional simulation process, the invalidation probability of the runway is generally used to evaluate the runway strike effect [9,10]. In order to calculate the basic consumption of missiles in wartime, this paper takes the invalidation probability of the runway as the expected condition, that is, the input index. Then calculate the minimum consumption of missiles under the predetermined invalidation probability.
2.1.1 Traditional simulation model
Use simulation method to calculate the invalidation probability of the runway. That is, by simulating the drop points of mother bombs and the drop points of each sub-warhead, the craters formed by the sub-warheads on the runway are obtained, then determine whether the runway has the smallest window for the fighter to take off. If it exists, the blockade fails, otherwise the blockade is successful. In the same way, after simulations, the number of successful simulation blockades is . Then, the invalidation probability of the runway is as follows.
|
|
(1) |
Suppose a conventional missile with sub-warheads is used to strike a single airport runway. For the -th missile (), its weapon parameters and target parameters are shown in Table 1.
| Weapon parameters | Target parameters | ||
|---|---|---|---|
| Weapon accuracy | Half length of the runway | ||
| The number of mother bombs | Half width of the runway | ||
| The throwing radius of the sub-warhead | Length of the minimum take-off window | ||
| Aiming points | (,) | Width of the minimum take-off window | |
| The average crater area (corresponding to the airport level), is the radius |
The airport level | Special grade | |
| Level I | |||
| Level II | |||
| Asphalt airport | |||
| The number of sub-warheads of each mother bomb | |||
The schematic diagram of the airport runway is shown as Figure 2.

|
| Figure 2. Schematic diagram of the airport runway |
The mathematical model of the simulation process is as follows.
(1) The coordinate of the aiming point of the mother bomb
|
|
(2) |
where and are uniformly distributed random numbers.
(2) The coordinate of the drop point of the sub-warhead
Suppose the coordinate of the drop point of the -th sub-warhead of the -th mother bomb is (, )
|
|
(3) |
where and are uniformly distributed random numbers.
If
|
|
(4) |
then
|
|
(5) |
If
|
|
(6) |
then regenerate and to get the position of a sub-warhead in the scatter circle.
(3) Search for the smallest take-off window
Combining all craters with a radius of , it is required that in a runway with a length of and width of , there is no minimum take-off window of length and width . Here only consider the case that the fighter of the blue side takes off along the long side of the runway.
(4) Perform multiple simulations to ensure that the invalidation probability is basically stable
In this way, we record all simulation results, the total number of runway blockades and the total number of simulations , the invalidation probability of the runway is:
|
|
(7) |
2.1.2 Improved simulation model
First, define the missile strike azimuth as the angle between the line of a set of aiming points and the long side of the runway, as shown in Figure 3; if the azimuth is 0, as shown in Figure 4.

|
| Figure 3. Schematic diagram of strike azimuth |

|
| Figure 4. Schematic diagram of 0-degree strike azimuth |
The selection of the aiming point for hitting the airport runway is shown in Figure 5. Among them, the distance between adjacent mother bombs of each group of mother bombs and the mother bomb group distance are both inputable values, as shown in Figure 6.

|
| Figure 5. Schematic diagram of aiming point selection |
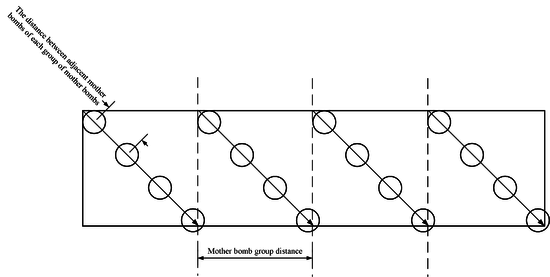
|
| Figure 6. Schematic diagram of the distance between adjacent mother bombs and mother bomb group distance |
Description:
(1) It is required to achieve full coverage of the end sprinkling circle in the direction of the arrow, and the radius of the circle is , that is, the throwing radius of the sub-warhead;
(2) The center of each circle is the desired aiming point.
The normal simulation process takes the number of missiles as the input and the invalidation probability as the output, the goal of this paper is to take the invalidation probability as the input and the consumption as the output. And if the strike azimuth is fixed, the number of missiles can be directly determined.
Therefore, the improved simulation process is as follows. Set different strike azimuths in steps from small to large (that is, determine the number of corresponding missiles), calculate the invalidation probability at different azimuths, and stop the increment if the set invalidation probability is reached, and the azimuth angle and the number of missiles are the best azimuth angle and the minimum missile consumption required.
2.2 Missile consumption under the penetration
In the actual combat process, the blue target will not be undefended, so it is necessary to consider the penetration process of the red missile [11-14], calculate the missile's penetration probability, and then calculate the consumption of the red missile under the condition of a single penetration.
The penetration probability of a single missile is
|
|
(8) |
where is the detection probability of the blue ground-based radar on the red missile [15-18], is the interceptable probability and is the kill probability of the blue missile on the red ballistic missile [19-22].
2.2.1 The detection probability of the blue ground-based radar on the red missile
(1) Calculation of signal-to-noise ratio
The search radar equation is
|
|
(9) |
The parameter explanation in the equation is shown in Table 2.
| Parameter | Explanation |
|---|---|
| Radar detection range | |
| Antenna transmit average power | |
| Radar effective area | |
| Time to scan the entire airspace | |
| Solid angle spanned the entire airspace | |
| Target radar cross-sectional area | |
| Video pulse cumulative efficiency | |
| Boltzmann constant (J/K) | |
| Standard room temperature (Generally K) | |
| Noise figure | |
| Signal-to-noise ratio | |
| System loss |
Equation (9) can be converted to
|
|
(10) |
where is the parameter that determines the performance of the radar, which can be obtained from Eq. (10)
|
|
(11) |
(2) Calculation of detection probability
The equation of detection probability is
|
|
(12) |
where is the distribution density of the mixture of signal and noise of the pulse group in one scan.
is the determined value of detection, when the false alarm is justified as , can be approximated as
|
|
(13) |
where is the pulse accumulation number of one scan.
Under certain circumstances, has the following expression
|
|
(14) |
Substituting Eq. (7) into Eq. (5), and the probability of false alarms is very small, so generally approximate results can be obtained
|
|
(15) |
2.2.2 Interceptable probability
|
|
(16) |
where is the flight time of the red missile being tracked steadily to the vicinity of the blue missile interception zone; is the process time from the blue radar stably tracking the red ballistic missile to the identification, judgment, task assignment and determination of the predicted interceptor to the preparation for launch; is the flight time of the blue missile from launch to the near boundary of the interception zone; is the reaction time from when the blue missile receives the launch order to the first missile.
Equation (9) is equivalent to
|
|
(17) |
where is the radar detection range and is the critical range.
2.2.3 The killing probability of the blue missile to the red ballistic missile at the end of interception
The blue side's probability of detonating the red missile's re-entry warhead is
|
|
(18) |
where is the radius of the blind zone and is the angle between the relative speed of the red and blue missiles and the line between them.
2.2.4 Consumption under penetration strategy
Combining Eq. (8), it can be obtained that the penetration probability of a single tactical ballistic missile of the red side against two missiles of the blue side is
|
|
(19) |
Based on the following assumptions:
(1) The blue side adopts the strategy of 2 interception and 1 for the red side missiles;
(2) The different mother bombs of the red side can be regarded as facing different small targets, so the overall penetration rate of all the red side missiles can be regarded as .
Therefore, to calculate the consumption in the case of penetration, it is necessary to randomly remove of the sub-warheads of all the mother bombs in the strike planning in the simulation in Section 2.1 (that is, the total number of missiles successfully striking the runway is the number of missiles under the determined attack azimuth angle multiplied by ). Repeat the process of searching the minimum take-off window and calculating the invalidation probability in Section 2.1.
2.3 Consumption under the multi-wave strikes
In combat, the red missile will be intercepted by the blue anti-missile defense system under a single wave of strikes. Therefore, multi-wave strikes are required to achieve the established blockade rate requirement.
In Figure 7, the red box represents the minimum take-off window searched for when evaluating the results after the first wave of strikes.

|
| Figure 7. Schematic diagram of the minimum take-off window |
Assuming the penetration rate is , in a simulated multi-wave strike,
(1) The total number of red missiles in the first wave of strikes is . Next, judge whether there is a minimum take-off window after the first wave of strikes. If it does not exist, there is no need to conduct multi-wave strikes. The strike wave is recorded as 1, the consumption of the red missiles is denoted as ;
(2) If there is a minimum take-off window, search and count the total number of non-overlapping windows. The result is marked as . The window arrangement and number results are non-unique. Just consider a random result here. If there is a minimum take-off window , the total number of red missiles in the second wave of strikes is , and the aiming point of each missile's simulated strike is the geometric center of the minimum take-off window. After penetration (round the result), the evaluation is carried out. Judge whether there is a take-off window, if not, the consumption of the red missile is recorded as ;
(3) If there is a minimum take-off window, continue to strike and search according to (2);
(4) Finally get the number of strike waves, the number of waves of the red missile and the total consumption of the red missile;
(5) Carry out multiple multi-wave strikes simulations to find the strike wave and missile consumption for each simulation. Finally, output the minimum, maximum, average, and median of the total consumption.
3. Simulation experiment
3.1 Experimental process
According to the simulation model and process, based on the C# development environment, a simulation software is developed to facilitate rapid simulation and calculation of results.
Select the I-level airport runway in a certain area as the strike target, suppose the fighter model is F-16 [22-25], combined with the parameters of a certain type of missile, the weapon parameters, target parameters and simulation parameters are shown in Table 3.
| Weapon parameters | Target parameters | Simulation parameters | |||
|---|---|---|---|---|---|
| Weapon accuracy CEP/m | 60 | Length of the runway/m | 3000 | The minimum invalidation probability | 0.75 |
| The throwing radius of the sub-warhead/m | 80 | Width of the runway/m | 50 | Increasing azimuth | 5° |
| The average radius of the crater (the airport level:Level I)/m | 2.5 | Length of the minimum take-off window/m | 533 | The distance between adjacent mother bomb/m | 533 |
| The number of sub-warheads of each mother bomb | 30 | Width of the minimum take-off window/m | 20 | Mother bomb group distance/m | 533 |
When setting up the penetration and anti-missile countermeasure module, assuming that the anti-missile system is the "Patriot" and its supporting system [26,27], the final penetration probability of a single missile is 0.8. Combine Eq. (19) to perform a single-wave penetration simulation to obtain a simulation diagram. Since the original simulation diagram is too slender, the local interception is explained, as shown in Figure 8.
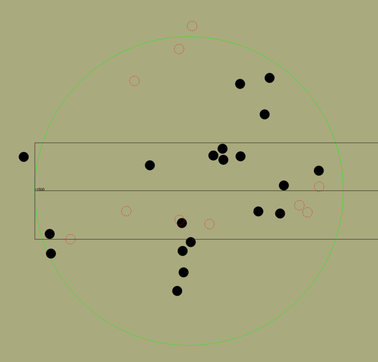
|
| Figure 8. A partial diagram of a single-wave penetration simulation |
As shown in Figure 8, the green circle represents the sub-warhead throwing circle, the black solid circle represents the crater left after the sub-warhead strikes the airport, and the red dotted circle represents the sub-warhead that was successfully intercepted.
Based on the single-wave penetration simulation, 1000 multi-wave penetration simulations were performed respectively. The results are shown in Table 4.
| Number of simulations | First wave consumption | Second wave consumption | Third wave consumption | Fourth wave consumption | Fifth wave consumption | Sixth wave consumption | Total consumption | Total strike wave |
|---|---|---|---|---|---|---|---|---|
| 1 | 6 | 3 | 3 | 1 | 13 | 4 | ||
| 2 | 6 | 4 | 10 | 2 | ||||
| 3 | 6 | 4 | 10 | 2 | ||||
| 4 | 6 | 3 | 1 | 10 | 3 | |||
| 5 | 6 | 3 | 1 | 10 | 3 | |||
| 6 | 6 | 8 | 1 | 15 | 3 | |||
| 7 | 6 | 6 | 1 | 13 | 3 | |||
| 8 | 6 | 3 | 1 | 10 | 3 | |||
| 9 | 6 | 4 | 3 | 1 | 14 | 4 | ||
| 10 | 6 | 5 | 1 | 12 | 3 | |||
| 11 | 6 | 7 | 2 | 1 | 16 | 4 | ||
| 12 | 6 | 5 | 1 | 12 | 3 | |||
| 13 | 6 | 7 | 2 | 15 | 3 | |||
| 14 | 6 | 4 | 2 | 1 | 1 | 14 | 5 | |
| 15 | 6 | 1 | 1 | 1 | 9 | 4 | ||
| 16 | 6 | 4 | 2 | 12 | 3 | |||
| 17 | 6 | 7 | 5 | 2 | 20 | 4 | ||
| 18 | 6 | 4 | 1 | 11 | 3 | |||
| 19 | 6 | 4 | 2 | 12 | 3 | |||
| 20 | 6 | 6 | 12 | 2 | ||||
| 21 | 6 | 3 | 1 | 10 | 3 | |||
| 22 | 6 | 3 | 9 | 2 | ||||
| 23 | 6 | 7 | 2 | 1 | 16 | 4 | ||
| 24 | 6 | 3 | 2 | 11 | 3 | |||
| 25 | 6 | 7 | 1 | 14 | 3 | |||
| 26 | 6 | 5 | 1 | 12 | 3 | |||
| 27 | 6 | 4 | 2 | 2 | 1 | 1 | 16 | 6 |
| 28 | 6 | 5 | 11 | 2 | ||||
| 29 | 6 | 6 | 1 | 13 | 3 | |||
| 30 | 6 | 5 | 1 | 1 | 13 | 4 | ||
| …… | ||||||||
| 998 | 6 | 5 | 1 | 1 | 13 | 4 | ||
| 999 | 6 | 3 | 1 | 1 | 1 | 12 | 5 | |
| 1000 | 6 | 4 | 4 | 1 | 1 | 16 | 5 |
3.2 Analysis of experimental results
Through 1000 multi-wave penetration strike simulations, the minimum total consumption is 6, the maximum is 20, the average is 12, and the median is 12. It can be concluded that to strike the set target airport runway, it is necessary to prepare at least about 6 missiles and at most about 20 missiles.
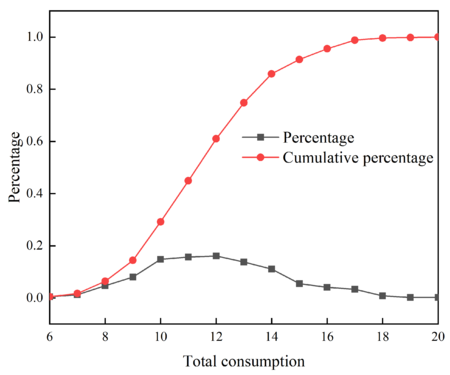
The following is a further analysis of the experimental results, the frequency, percentages and cumulative percentages of different total consumption in 1000 simulation experiments are counted, and Table 5 is obtained. For a more intuitive comparison, the histogram of the frequency of the total consumption and the percentage graph of the total consumption are made, as shown in Figures 9 and 10 respectively.
| Total consumption | Frequency | Percentage | Cumulative percentage |
|---|---|---|---|
| 6 | 5 | 0.005 | 0.005 |
| 7 | 12 | 0.012 | 0.017 |
| 8 | 47 | 0.047 | 0.064 |
| 9 | 80 | 0.080 | 0.144 |
| 10 | 148 | 0.148 | 0.292 |
| 11 | 157 | 0.157 | 0.449 |
| 12 | 161 | 0.161 | 0.610 |
| 13 | 138 | 0.138 | 0.748 |
| 14 | 111 | 0.111 | 0.859 |
| 15 | 55 | 0.055 | 0.914 |
| 16 | 41 | 0.041 | 0.955 |
| 17 | 33 | 0.033 | 0.988 |
| 18 | 8 | 0.008 | 0.996 |
| 19 | 2 | 0.002 | 0.998 |
| 20 | 2 | 0.002 | 1.000 |
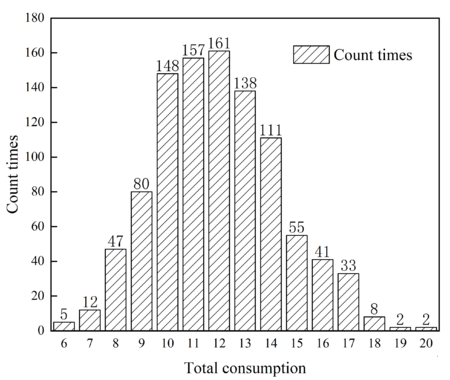
|
| Figure 9. Histogram of the frequency of the total consumption |
|
| Figure 10. Percentage graph of the total consumption |
It can be seen from Table 5 and Figure 9 that the total number of consumption of 10, 11, 12, 13 and 14 have the most occurrences, all exceeding 100 times, and they account for 71.5% of the total number of simulations. And from Table 5 and Figure 10, if the striker prepares 14 missiles, there is an 85.9% chance of destroying the target airport runway; if the striker prepares 15 missiles, there is a 91.4% chance of destroying the target airport runway.
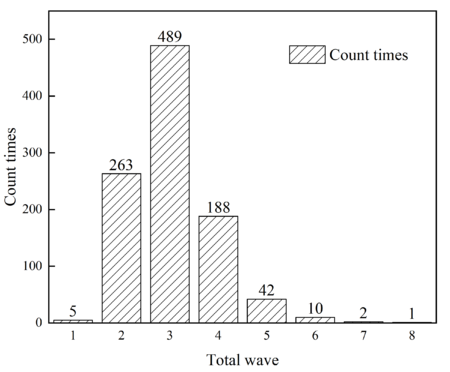
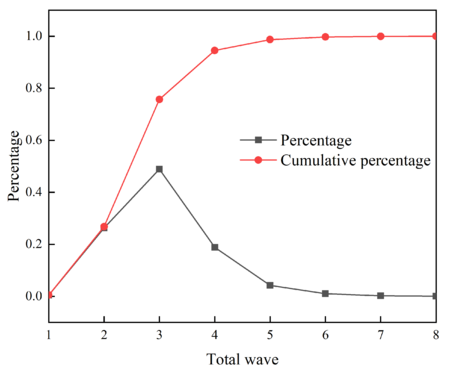
The frequency, percentages, and cumulative percentages of different total waves in 1000 simulation experiments are calculated, and Table 6 is obtained. Make the histogram of the frequency of the total wave and the percentage graph of the total wave, as shown in Figures 11 and 12 respectively.
| Total consumption | Frequency | Percentage | Cumulative percentage |
|---|---|---|---|
| 1 | 5 | 0.005 | 0.005 |
| 2 | 263 | 0.263 | 0.268 |
| 3 | 489 | 0.489 | 0.757 |
| 4 | 188 | 0.188 | 0.945 |
| 5 | 42 | 0.042 | 0.987 |
| 6 | 10 | 0.010 | 0.997 |
| 7 | 2 | 0.002 | 0.999 |
| 8 | 1 | 0.001 | 1.000 |
|
| Figure 11. Histogram of the frequency of the total wave |
|
| Figure 12. Percentage graph of the total wave |
It can be seen from Table 6 and Figure 11 that the total wave number of 3 appears the most, which is 489, reaching 48.9% of the total number of simulations. From Table 6 and Figure 12, it can be seen that with sufficient missiles, the striker has a 94.5% probability of destroying the target airport runway within 4 waves.
4. Conclusion
To solve the problem of insufficient research on missile consumption in wartime with the airport runway as the target, this paper takes the airport runway as the target, taking the invalidation probability as the expected target, and adopting conventional missiles with submunitions. In combination with penetration and anti-missile countermeasures, this paper publicly proposes the consumption calculation method and model for the first time, and the multi-wave strikes strategy and calculation method are proposed either. The model is verified by combining the specific airport runway, fighter jet model and missile parameters. In the end, under the target airport and related parameters given in this paper, if 14 missiles are prepared, there is an 85.9% probability of destroying the target airport runway; if 15 missiles are prepared, there is a 91.4% probability of destroying the target airport runway; There is a 94.5% probability that the target airport runway will be destroyed within 4 waves with sufficient missiles. In the next step, combined with the maintenance rate and timeliness, the model is further optimized.
Funding Statement: This work was supported in part by the National Natural Science Foundation of China under Grant 71601180.
Conflicts of Interest: The authors declare that they have no conflicts of interest to report regarding the present study.
References
[1] Sennaroglu B., Celebi G.V. A military airport location selection by ahp integrated promethee and vikor methods. Transportation Research Part D: Transport and Environment, 59:160-173, 2018.
[2] Li X., Luo M., Wang M. Composite strike method of conventional missile. Tactical Missile Technology, 02:46-48+74, 2008.
[3] Zhen Z., Feng J. A study on aim points selection method for attacking airport runway. Informatization Research, 43(01),19-21+28, 2017.
[4] Gao X. Application of computer-simulation in the study of bomblet dispersion. Acta Armamentarii, 02:12-18, 1989.
[5] Wang T., Yang P., Ouyang H. Investigation into multi-time missile warfare based on markov chain. Tactical Missile Technology, 4:20-22, 2011.
[6] Guangzhi B., Bin Z., Shuai S. Aimpoints Selection Method Multiwave Attack Runway with Ballistic Missiles. Fire Control & Command Control, 39(11):66-64+71, 2014.
[7] Zhang K., Liu Y.C., Guan S.Y. Investigation into the problem of evaluating combat effectiveness for missile weapon systems. Journal of Astronautics, 02:58-66, 2002.
[8] Kim J., Kim W. Simulation analysis on the effectiveness of missile defense. Journal of Peace Research, 58(03):510-522, 2020.
[9] Ma B., Zhou C., Lou L., Zhang T. Automatic assessment of the attacked airports based on image analysis. Journal of Huazhong University of ence and Technology, 07:13-15, 2004.
[10] Miao Q.G., Liu J., Ning S.T. Battle damage assessment of airport based on fuzzy comprehensive evaluation. Systems Engineering and Electronics, 34(7):1395-1399, 2012.
[11] Zou H. Application of iterative learning algorithm based on data driving to the evaluation of missile penetration capability. Shipboard Electronic Countermeasure, 42(01):42-45+51, 2019.
[12] Feng L.P., Fan Z.E., Nie Y.F. Simulation on terminal penetration trajectory of anti-ship missile under interception conditions. DEStech Transactions on Engineering and Technology Research, 1:1-7, 2019.
[13] Zhang X.Y., Song G.B. Design and realization of anti-ship missile penetration simulation system based on HLA. Journal of System Simulation, 08:2350+2354. 2006.
[14] Xia J., Xie L.Y., Wang X.Q. Research on optimal penetration strategies of ballistic missile. Journal of Ballistics, 20(08):65-68, 2008.
[15] Feng D.J., Wang X.S., Liu J.Q. Jamming effect analysis of chaff cloud on ground-based radar and its application. Modern Radar, 32(06):22-26, 2010.
[16] Zhou Y., Wang X.S., Wang G.Y., Wang L.D., Liu Y.H. Fuzzy evaluation on radar jamming effect based on ballistic missile penetration. Systems Engineering and Electronics, 07:807-809, 2003.
[17] Zhao F., Li D., Wang X.S., Xiao S.P. Missile defense radar simulation system. Journal of System Simulation, 05:1190-1194, 2006.
[18] Yin L., Liu H., Zhao X., Shufang L.I. Research on AN/TPY-2 radar range and jamming based on radar equation. Systems Engineering and Electronics, 40(01):50-57, 2018.
[19] Lee J.S. Optimal sam defense system: an application of optimal control concept to operations research. IEEE Transactions on Automatic Control, 18(5):485-489, 1973.
[20] Hecht Jeff. Is there any way to defend against a ballistic missile?. New Scientist, 206(2762):12-12, 2010.
[21] Dutta D. Probabilistic analysis of anti-ship missile defence effectiveness. Defence Science Journal, 64(2):123-129, 2014.
[22] Bethe H.A., Garwin R.L., Gottfried K., Kendall H.W. Space-based ballistic-missile defense. Scientific American, 4(4):39-49, 1984.
[23] Ron N. How organizations learn: post-flight reviews in an F-16 fighter squadron. Organization Studies, 27(8):1069-1089, 2006.
[24] Jones D. This systems architect builds the most advanced F-16 combat simulators. IEEE Spectrum, 51(6):24-24, 2014.
[25] Farhat C., Geuzaine P., Brown G. Application of a three-field nonlinear fluid–structure formulation to the prediction of the aeroelastic parameters of an F-16 fighter. Computers & Fluids, 32(1):3-29, 2003.
[26] Holland O.T., Wallace S.E. Using agents to model the kill chain of the ballistic missile defense system. Naval Engineers Journal, 123(3):141-151, 2012.
[27] Marshall E. Patriot's effectiveness challenged. Science, 254(5033):791-791, 1991.Document information
Published on 29/09/21
Accepted on 20/09/21
Submitted on 20/07/21
Volume 37, Issue 3, 2021
DOI: 10.23967/j.rimni.2021.09.007
Licence: CC BY-NC-SA license
Share this document
claim authorship
Are you one of the authors of this document?