| (24 intermediate revisions by the same user not shown) | |||
| Line 133: | Line 133: | ||
In this paper, the icing process of symmetrical wedge airfoil was calculated based on Eulerian method. The phase transformation and particle rebound were taken into account. The numerical results also were compared with the NRC’s experimental results. The effects of pressure and the ratio LWC/TWC on icing also were analyzed. | In this paper, the icing process of symmetrical wedge airfoil was calculated based on Eulerian method. The phase transformation and particle rebound were taken into account. The numerical results also were compared with the NRC’s experimental results. The effects of pressure and the ratio LWC/TWC on icing also were analyzed. | ||
| − | ==2. Numerical | + | ==2. Numerical methods == |
It could be considered that the effect of carrier phase on the dispersed phase is unidirectional, because the value of particle loading (<math>PL={\alpha }_d{\rho }_d/{\alpha }_c{\rho }_c</math>) is less than 0.1. Here, the flow field is simulated based on Palart-Allmaras turbulence model [13]. Then the above results are used to calculate the particle trajectory. At last, the Messinger model is used to obtain the results of icing process. | It could be considered that the effect of carrier phase on the dispersed phase is unidirectional, because the value of particle loading (<math>PL={\alpha }_d{\rho }_d/{\alpha }_c{\rho }_c</math>) is less than 0.1. Here, the flow field is simulated based on Palart-Allmaras turbulence model [13]. Then the above results are used to calculate the particle trajectory. At last, the Messinger model is used to obtain the results of icing process. | ||
| − | ===2.1. Model of | + | ===2.1. Model of particle motion and phase change=== |
Since the mixed phase is a necessary condition for ice crystal icing. The volume fraction of dispersed phase <math>\alpha </math> should be divided into solid phase <math>{\alpha }_i</math> and liquid phase <math>{\alpha }_w</math>. The momentum conservation equation is extended from one to two | Since the mixed phase is a necessary condition for ice crystal icing. The volume fraction of dispersed phase <math>\alpha </math> should be divided into solid phase <math>{\alpha }_i</math> and liquid phase <math>{\alpha }_w</math>. The momentum conservation equation is extended from one to two | ||
| Line 286: | Line 286: | ||
The above governing equations are solved by Streamline-Upwind Petrov- Galerkin method [15]. | The above governing equations are solved by Streamline-Upwind Petrov- Galerkin method [15]. | ||
| − | + | <div id='img-1'></div> | |
{| style="text-align: center; border: 1px solid #BBB; margin: 1em auto; width: auto;max-width: auto;" | {| style="text-align: center; border: 1px solid #BBB; margin: 1em auto; width: auto;max-width: auto;" | ||
|- | |- | ||
| Line 301: | Line 301: | ||
| − | ===2.2 Model of | + | ===2.2 Model of ice accretion === |
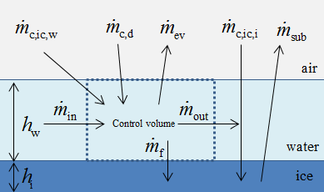
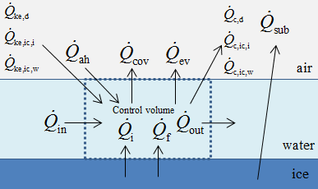
| − | In this paper, the classical Messinger model is used to calculate the icing process. The mass and energy conservation equations are established based on a control volume in this model [11]. The masses enter into the control volume are the melted part of ice crystal <math>{\dot{m}}_{c,ic,w}</math>, droplet <math>{\dot{m}}_{c,d}</math> and runback water <math>{\dot{m}}_{in}</math> from theneighboring upstream control volume. The outgoing masses are evaporating water <math>{\dot{m}}_{ev}</math>, icing mass <math>{\dot{m}}_f</math> and runback water <math>{\dot{m}}_{out}</math> (Figure 1). Therefore the mass conservation equation of control volume is shown as: | + | In this paper, the classical Messinger model is used to calculate the icing process. The mass and energy conservation equations are established based on a control volume in this model [11]. The masses enter into the control volume are the melted part of ice crystal <math>{\dot{m}}_{c,ic,w}</math>, droplet <math>{\dot{m}}_{c,d}</math> and runback water <math>{\dot{m}}_{in}</math> from theneighboring upstream control volume. The outgoing masses are evaporating water <math>{\dot{m}}_{ev}</math>, icing mass <math>{\dot{m}}_f</math> and runback water <math>{\dot{m}}_{out}</math> ([[#img-1|Figure 1]]). Therefore the mass conservation equation of control volume is shown as: |
{| class="formulaSCP" style="width: 100%; text-align: left;" | {| class="formulaSCP" style="width: 100%; text-align: left;" | ||
| Line 412: | Line 412: | ||
|} | |} | ||
| − | ==3. Case | + | ==3. Case study== |
| − | + | ||
| − | + | ||
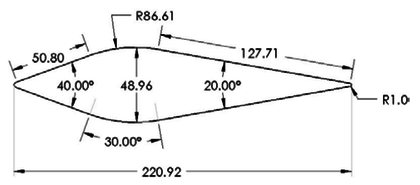
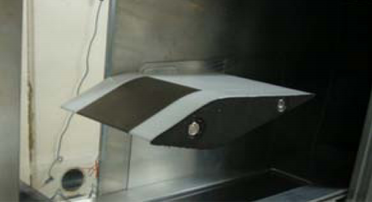
| + | In this paper, a symmetrical wedge airfoil in NRC’s experiment [5,16] is taken as the research object. The front angel of this airfoil is 40°, and the rear angel is 20°. The chord length is 220.92 mm ([[#img-2|Figure 2]]a). The grinder used in NRC’s experiment could produce ice crystals with an estimated median mass diameter (MMD) of between 100-200 μm, and the air-assist atomization nozzles could produce droplets with a median volume diameter (MVD) of 40 μm. Here, the ice crystal size is set as 150 μm in calculation. The whole flow field model (154, 064 hexahedral grids) is shown in [[#img-3|Figure 3]], and the inlet is about 1.27 m away from the leading edge of the wedge airfoil. | ||
| + | <div id='img-2'></div> | ||
{| style="text-align: center; border: 1px solid #BBB; margin: 1em auto; width: auto;max-width: auto;" | {| style="text-align: center; border: 1px solid #BBB; margin: 1em auto; width: auto;max-width: auto;" | ||
|- | |- | ||
| Line 429: | Line 429: | ||
|} | |} | ||
| − | + | <div id='img-3'></div> | |
{| style="text-align: center; border: 1px solid #BBB; margin: 1em auto; width: auto;max-width: auto;" | {| style="text-align: center; border: 1px solid #BBB; margin: 1em auto; width: auto;max-width: auto;" | ||
|- | |- | ||
| Line 444: | Line 444: | ||
| − | ===3.1 Experiment | + | ===3.1 Experiment verification=== |
| − | In order to verify the accuracy of the numerical method in this paper, the run 139 of NRC experiment is used to compare with the numerical results. The operating conditions are shown in Table 1. | + | In order to verify the accuracy of the numerical method in this paper, the run 139 of NRC experiment is used to compare with the numerical results. The operating conditions are shown in [[#tab-1|Table 1]]. |
<div class="center" style="font-size: 75%;">'''Table 1. '''Run 139 operating conditions [16] | <div class="center" style="font-size: 75%;">'''Table 1. '''Run 139 operating conditions [16] | ||
</div> | </div> | ||
| − | + | <div id='tab-1'></div> | |
| − | {| style="width: | + | {| style="width: 100%;margin: 1em auto 0.1em auto;border-collapse: collapse;font-size:85%;" |
|- | |- | ||
| − | | style="border-top: 1pt solid black;border-bottom: 1pt solid black;text-align: center;"|'''Angle of attack ''' <math>{\alpha }_{attack}</math> | + | | style="border-top: 1pt solid black;border-bottom: 1pt solid black;text-align: center;"|'''Angle of attack ''' |
| − | | style="border-top: 1pt solid black;border-bottom: 1pt solid black;text-align: center;"|'''Mach number ''' <math>M_{\infty }</math> | + | |
| − | | style="border-top: 1pt solid black;border-bottom: 1pt solid black;text-align: center;"|'''Total air pressure ''' <math>P_{total,\infty }</math> | + | <math>{\alpha }_{attack}</math> |
| − | | style="border-top: 1pt solid black;border-bottom: 1pt solid black;text-align: center;"|'''Total air temperature ''' <math>T_{total,\infty }</math> | + | | style="border-top: 1pt solid black;border-bottom: 1pt solid black;text-align: center;"|'''Mach number ''' |
| − | | style="border-top: 1pt solid black;border-bottom: 1pt solid black;text-align: center;"|'''Initial particle temperature ''' <math>T_{d,\infty }</math> | + | |
| − | | style="border-top: 1pt solid black;border-bottom: 1pt solid black;text-align: center;"|'''Relative humidity ''' <math>H_{relative}</math> | + | <math>M_{\infty }</math> |
| − | | style="border-top: 1pt solid black;border-bottom: 1pt solid black;text-align: center;"|'''Accretion time ''' <math>t_{accretion}</math> | + | | style="border-top: 1pt solid black;border-bottom: 1pt solid black;text-align: center;"|'''Total air pressure ''' |
| + | |||
| + | <math>P_{total,\infty }</math> | ||
| + | | style="border-top: 1pt solid black;border-bottom: 1pt solid black;text-align: center;"|'''Total air temperature ''' | ||
| + | |||
| + | <math>T_{total,\infty }</math> | ||
| + | | style="border-top: 1pt solid black;border-bottom: 1pt solid black;text-align: center;"|'''Initial particle''' | ||
| + | |||
| + | '''temperature ''' <math>T_{d,\infty }</math> | ||
| + | | style="border-top: 1pt solid black;border-bottom: 1pt solid black;text-align: center;"|'''Relative humidity ''' | ||
| + | |||
| + | <math>H_{relative}</math> | ||
| + | | style="border-top: 1pt solid black;border-bottom: 1pt solid black;text-align: center;"|'''Accretion time ''' | ||
| + | |||
| + | <math>t_{accretion}</math> | ||
| style="border-top: 1pt solid black;border-bottom: 1pt solid black;text-align: center;"|'''LWC''' | | style="border-top: 1pt solid black;border-bottom: 1pt solid black;text-align: center;"|'''LWC''' | ||
| style="border-top: 1pt solid black;border-bottom: 1pt solid black;text-align: center;"|'''IWC''' | | style="border-top: 1pt solid black;border-bottom: 1pt solid black;text-align: center;"|'''IWC''' | ||
| Line 475: | Line 489: | ||
| − | The abundant flow field data are obtained by the above numerical method. It could be found that the numerical results are basically the same as the experimental results (Figure 4 | + | The abundant flow field data are obtained by the above numerical method. It could be found that the numerical results are basically the same as the experimental results ([[#img-4|Figure 4]]). |
| − | + | <div id='img-4'></div> | |
{| style="text-align: center; border: 1px solid #BBB; margin: 1em auto; width: auto;max-width: auto;" | {| style="text-align: center; border: 1px solid #BBB; margin: 1em auto; width: auto;max-width: auto;" | ||
|- | |- | ||
| Line 491: | Line 505: | ||
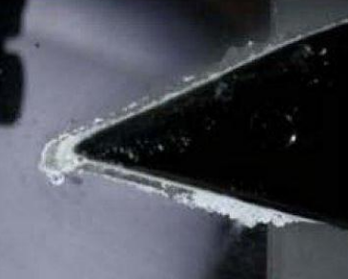
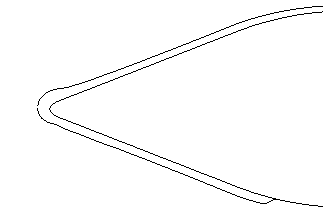
| − | Although the total temperature is 12.5 ℃, the wet bulb temperature is negative. The intense evaporation process absorbs a large amount of heat, which results in the droplets temperature decreasing gradually. When the droplets reach the stagnation point, the temperature of droplets decrease from the initial temperature of 10℃ to -8℃ (Figure | + | Although the total temperature is 12.5 ℃, the wet bulb temperature is negative. The intense evaporation process absorbs a large amount of heat, which results in the droplets temperature decreasing gradually. When the droplets reach the stagnation point, the temperature of droplets decrease from the initial temperature of 10℃ to -8℃ ([[#img-5|Figure 5]]a), and the diameter decrease from 40 μm to 39.3 μm ([[#img-5|Figure 5]]b). After 402 s exposure under this condition, the numerical results are basically consistent with the experimental results ([[#img-6|Figure 6]]). |
| − | + | <div id='img-5'></div> | |
{| style="text-align: center; border: 1px solid #BBB; margin: 1em auto; width: auto;max-width: auto;" | {| style="text-align: center; border: 1px solid #BBB; margin: 1em auto; width: auto;max-width: auto;" | ||
|- | |- | ||
| Line 506: | Line 520: | ||
|} | |} | ||
| − | + | <div id='img-6'></div> | |
{| style="text-align: center; border: 1px solid #BBB; margin: 1em auto; width: auto;max-width: auto;" | {| style="text-align: center; border: 1px solid #BBB; margin: 1em auto; width: auto;max-width: auto;" | ||
|- | |- | ||
| Line 520: | Line 534: | ||
|} | |} | ||
| − | ===3.2 Effect of | + | ===3.2 Effect of pressure on icing=== |
| − | In order to study the effect of pressure on icing, the calculations of the following conditions are carried out (Table 2, the conditions of Model A is the same as that of run 543 of NRC’s experiment [16]). In all models, the angle of attack are 0°, the MMD of ice crystal is 150 μm, the MVD of droplet is 40 μm, and the ice accretion time is 60 s. | + | In order to study the effect of pressure on icing, the calculations of the following conditions are carried out ([[#tab-2|Table 2]], the conditions of Model A is the same as that of run 543 of NRC’s experiment [16]). In all models, the angle of attack are 0°, the MMD of ice crystal is 150 μm, the MVD of droplet is 40 μm, and the ice accretion time is 60 s. |
<div class="center" style="font-size: 75%;">'''Table 2. '''Calculation conditions І | <div class="center" style="font-size: 75%;">'''Table 2. '''Calculation conditions І | ||
</div> | </div> | ||
| − | + | <div id='tab-2'></div> | |
| − | {| style="width: | + | {| style="width: 88%;margin: 1em auto 0.1em auto;border-collapse: collapse;font-size:85%;" |
|- | |- | ||
| style="border-top: 1pt solid black;border-bottom: 1pt solid black;text-align: center;"| | | style="border-top: 1pt solid black;border-bottom: 1pt solid black;text-align: center;"| | ||
| − | | style="border-top: 1pt solid black;border-bottom: 1pt solid black;text-align: center;"|'''Mach number ''' <math>M_{\infty }</math> | + | | style="border-top: 1pt solid black;border-bottom: 1pt solid black;text-align: center;"|'''Mach number ''' |
| − | | style="border-top: 1pt solid black;border-bottom: 1pt solid black;text-align: center;"|'''Total air pressure ''' <math>P_{total,\infty }</math> | + | |
| − | | style="border-top: 1pt solid black;border-bottom: 1pt solid black;text-align: center;"|'''Total air temperature ''' <math>T_{total,\infty }</math> | + | <math>M_{\infty }</math> |
| − | | style="border-top: 1pt solid black;border-bottom: 1pt solid black;text-align: center;"|'''Initial particle temperature ''' <math>T_{d,\infty }</math> / | + | | style="border-top: 1pt solid black;border-bottom: 1pt solid black;text-align: center;"|'''Total air pressure ''' |
| − | | style="border-top: 1pt solid black;border-bottom: 1pt solid black;text-align: center;"|'''Relative humidity ''' <math>H_{relative}</math> | + | |
| − | | style="border-top: 1pt solid black;border-bottom: 1pt solid black;text-align: center;"|'''LWC''' | + | <math>P_{total,\infty }</math> |
| − | | style="border-top: 1pt solid black;border-bottom: 1pt solid black;text-align: center;"|'''IWC''' | + | | style="border-top: 1pt solid black;border-bottom: 1pt solid black;text-align: center;"|'''Total air''' |
| + | |||
| + | '''temperature ''' <math>T_{total,\infty }</math> | ||
| + | | style="border-top: 1pt solid black;border-bottom: 1pt solid black;text-align: center;"|'''Initial particle''' | ||
| + | |||
| + | '''temperature ''' <math>T_{d,\infty }</math>/<math>T_{c,\infty }</math> | ||
| + | | style="border-top: 1pt solid black;border-bottom: 1pt solid black;text-align: center;"|'''Relative humidity ''' | ||
| + | |||
| + | <math>H_{relative}</math> | ||
| + | | style="border-top: 1pt solid black;border-bottom: 1pt solid black;text-align: center;vertical-align: top;"|'''LWC''' | ||
| + | | style="border-top: 1pt solid black;border-bottom: 1pt solid black;text-align: center;vertical-align: top;"|'''IWC''' | ||
|- | |- | ||
| style="border-top: 1pt solid black;text-align: center;"|Model A | | style="border-top: 1pt solid black;text-align: center;"|Model A | ||
| Line 567: | Line 591: | ||
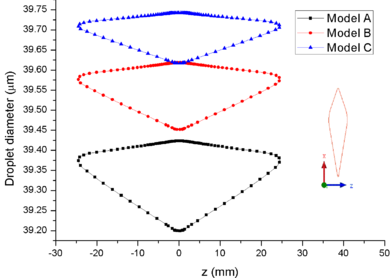
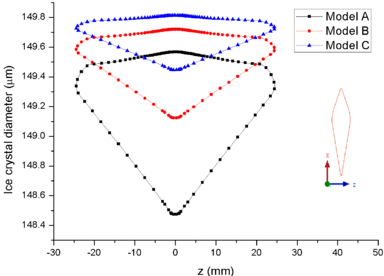
| − | Figure 7 shows the comparison of droplet (Figure | + | [[#img-7|Figure 7]] shows the comparison of droplet ([[#img-7|Figure 7]]a) and ice crystal ([[#img-7|Figure 7]]b) diameters on the airfoil surface. It could be found that the droplet and ice crystal diameters of Model A are obviously smaller than the other two models. The results show that the decrease of total pressure will lead to the increase of evaporation rate and the further decrease of wet bulb temperature under the same conditions. Therefore, under the influence of evaporation rate, the mass loss of ice crystal or droplet is the greatest under low pressure (Model A). |
| − | + | <div id='img-7'></div> | |
{| style="text-align: center; border: 1px solid #BBB; margin: 1em auto; width: auto;max-width: auto;" | {| style="text-align: center; border: 1px solid #BBB; margin: 1em auto; width: auto;max-width: auto;" | ||
|- | |- | ||
| Line 583: | Line 607: | ||
| − | Figure 8 shows the comparison of mass collection rate (Figure | + | [[#img-8|Figure 8]] shows the comparison of mass collection rate ([[#img-8|Figure 8]]a) and ice thickness (Figure 8b) on the airfoil surface. It could be found that droplets (or ice crystal) are most likely to impact the leading edge of the airfoil (<math> z=\pm 2 mm</math>), and there is little difference in particle collection between the three models ([[#img-8|Figure 8]]a). However, in the other parts of the airfoil windward, the mass collection rate under low pressure condition (Model A) is higher than that under high pressure conditions (Mode B and Model C). Because the larger the particle size, the higher the probability of rebound or breakup after impacting on the surface. From the comparison of ice thickness ([[#img-8|Figure 8]]b), it could be found that the pressure has a great influence on icing. It is easier to freeze under low pressure condition (the ice thickness of Model A at stagnation point is 4.6 mm, while that of experiment is 4.5 mm). On the one hand, the mass collection rate is higher under the lower pressure condition ([[#img-8|Figure 8]]a). On the other hand, the wet bulb temperature is lower under the lower pressure condition (the wet bulb temperature of Model A, B and C are -3℃, -1℃, and 1℃ respectively), which is more conductive to freeze. |
In summary, the lower the pressure, the lower the wet bulb temperature and the stronger the evaporation, the easier the formation of icing conditions, which also explains why the engine internal icing usually occurs at high altitude. | In summary, the lower the pressure, the lower the wet bulb temperature and the stronger the evaporation, the easier the formation of icing conditions, which also explains why the engine internal icing usually occurs at high altitude. | ||
| − | + | <div id='img-8'></div> | |
{| style="text-align: center; border: 1px solid #BBB; margin: 1em auto; width: auto;max-width: auto;" | {| style="text-align: center; border: 1px solid #BBB; margin: 1em auto; width: auto;max-width: auto;" | ||
|- | |- | ||
| Line 600: | Line 624: | ||
|} | |} | ||
| − | ===3.3 Effect of the | + | ===3.3 Effect of the ratio of LWC/ TWC on icing=== |
| − | The calculation of working conditions shown in Table 3 is also carried out. The web bulb temperature is -3℃, the angle of attack are 0°, the MMD of ice crystal is 150 μm, the MVD of droplet is 40 μm, and the ice accretion time is 120 s. Here, the total water content TWC is 4 g/m<sup>3 </sup>(TWC=IWC+LWC). | + | The calculation of working conditions shown in [[#tab-3|Table 3]] is also carried out. The web bulb temperature is -3℃, the angle of attack are 0°, the MMD of ice crystal is 150 μm, the MVD of droplet is 40 μm, and the ice accretion time is 120 s. Here, the total water content TWC is 4 g/m<sup>3 </sup>(TWC=IWC+LWC). |
<div class="center" style="font-size: 75%;">'''Table 3. '''Calculation conditions IІ | <div class="center" style="font-size: 75%;">'''Table 3. '''Calculation conditions IІ | ||
</div> | </div> | ||
| − | + | <div id='tab-3'></div> | |
| − | {| style="width: | + | {| style="width: 90%;margin: 1em auto 0.1em auto;border-collapse: collapse;font-size:85%;" |
|- | |- | ||
| style="border-top: 1pt solid black;border-bottom: 1pt solid black;text-align: center;"| | | style="border-top: 1pt solid black;border-bottom: 1pt solid black;text-align: center;"| | ||
| Line 625: | Line 649: | ||
<math>H_{relative}</math> | <math>H_{relative}</math> | ||
| − | | style="border-top: 1pt solid black;border-bottom: 1pt solid black;text-align: center;"|'''LWC''' | + | | style="border-top: 1pt solid black;border-bottom: 1pt solid black;text-align: center;vertical-align: top;"|'''LWC''' |
| − | | style="border-top: 1pt solid black;border-bottom: 1pt solid black;text-align: center;"|'''IWC''' | + | | style="border-top: 1pt solid black;border-bottom: 1pt solid black;text-align: center;vertical-align: top;"|'''IWC''' |
|- | |- | ||
| style="text-align: center;"|Model D | | style="text-align: center;"|Model D | ||
| Line 655: | Line 679: | ||
| style="text-align: center;"|2 g/m<sup>3</sup> | | style="text-align: center;"|2 g/m<sup>3</sup> | ||
|- | |- | ||
| − | | style="border-bottom: 1pt solid black;text-align: center;"| | + | | style="text-align: center;"|Model G |
| − | + | | style="text-align: center;"|0.25 | |
| − | Model H | + | | style="text-align: center;"|44.8 kPa |
| + | | style="text-align: center;"|13 ℃ | ||
| + | | style="text-align: center;"|10 ℃/-15℃ | ||
| + | | style="text-align: center;"|8% | ||
| + | | style="text-align: center;"|3 g/m<sup>3</sup> | ||
| + | | style="text-align: center;"|1 g/m<sup>3</sup> | ||
| + | |- | ||
| + | | style="border-bottom: 1pt solid black;text-align: center;"|Model H | ||
| style="border-bottom: 1pt solid black;text-align: center;"|0.25 | | style="border-bottom: 1pt solid black;text-align: center;"|0.25 | ||
| − | |||
| − | |||
| style="border-bottom: 1pt solid black;text-align: center;"|44.8 kPa | | style="border-bottom: 1pt solid black;text-align: center;"|44.8 kPa | ||
| − | |||
| − | |||
| style="border-bottom: 1pt solid black;text-align: center;"|13 ℃ | | style="border-bottom: 1pt solid black;text-align: center;"|13 ℃ | ||
| − | |||
| − | |||
| style="border-bottom: 1pt solid black;text-align: center;"|10 ℃/-15℃ | | style="border-bottom: 1pt solid black;text-align: center;"|10 ℃/-15℃ | ||
| − | |||
| − | |||
| style="border-bottom: 1pt solid black;text-align: center;"|8% | | style="border-bottom: 1pt solid black;text-align: center;"|8% | ||
| + | | style="border-bottom: 1pt solid black;text-align: center;"|4 g/m<sup>3</sup> | ||
| + | | style="border-bottom: 1pt solid black;text-align: center;"|0 g/m<sup>3</sup> | ||
| − | |||
| − | |||
| − | |||
| − | |||
| − | |||
| − | |||
| − | |||
|} | |} | ||
| − | Figure 9 shows the comparison of ice accretion, and Figure 10 shows the velocity magnitude contour of different models. The Model D has no liquid water (LWC=0 g/m<sup>3</sup>), and doesn’t form mixed phase. The dry airfoil surface can’t stick any ice crystals to form ice layer. Model E contains less liquid water, and only liquid film and ice layer appear on the windward side of airfoil. However, with the increase the LWC, the liquid film on the surface begin to flow to the leeward side (Model F, Model G and Model H) and form ice layer on the leeward side. When the ratio of LWC/TWC is 0.5, the ice layer at stagnation point is the thickest (Figure 9). When there is less liquid water, the ice layer is thinner and the sticking ability of film is weaker. When there is less ice crystal, it is not conducive to the formation of icing conditions. | + | [[#img-9|Figure 9]] shows the comparison of ice accretion, and [[#img-10|Figure 10]] shows the velocity magnitude contour of different models. The Model D has no liquid water (LWC=0 g/m<sup>3</sup>), and doesn’t form mixed phase. The dry airfoil surface can’t stick any ice crystals to form ice layer. Model E contains less liquid water, and only liquid film and ice layer appear on the windward side of airfoil. However, with the increase the LWC, the liquid film on the surface begin to flow to the leeward side (Model F, Model G and Model H) and form ice layer on the leeward side. When the ratio of LWC/TWC is 0.5, the ice layer at stagnation point is the thickest ([[#img-9|Figure 9]]). When there is less liquid water, the ice layer is thinner and the sticking ability of film is weaker. When there is less ice crystal, it is not conducive to the formation of icing conditions. |
| − | + | <div id='img-9'></div> | |
{| style="text-align: center; border: 1px solid #BBB; margin: 1em auto; width: auto;max-width: auto;" | {| style="text-align: center; border: 1px solid #BBB; margin: 1em auto; width: auto;max-width: auto;" | ||
|- | |- | ||
| Line 691: | Line 709: | ||
|} | |} | ||
| − | + | <div id='img-10'></div> | |
{| style="text-align: center; border: 1px solid #BBB; margin: 1em auto; width: auto;max-width: auto;" | {| style="text-align: center; border: 1px solid #BBB; margin: 1em auto; width: auto;max-width: auto;" | ||
|- | |- | ||
| Line 708: | Line 726: | ||
==References== | ==References== | ||
| + | <div class="auto" style="text-align: left;width: auto; margin-left: auto; margin-right: auto;font-size: 85%;"> | ||
| − | 1 | + | [1] Yuan Q.H., Fan J., Bai G.C. Review of ice crystal icing in aero-engines. J. Propul. Technol., 39:2641-2650, 2018. |
| − | 2 | + | [2] Mason J.G., Strapp J.W., Chow P. The ice particle threat to engines in flight. AIAA Aerospace Sciences Meeting and Exhibit, January 2006-206. |
| − | 3 | + | [3] Pasztor A. Airline regulators grapple with engine-shutdown peril. Wall Street Journal, 251, 2008. |
| − | 4 | + | [4] Grzych M.L., Mason J. Weather conditions associated with jet engine power-loss and damage due to ingestion of ice particles: what we’ ve learned through 2009. 14th Conference on Aviation, Range and Aerospace Meteorology, Washington, DC, U.S., 2010. |
| − | 5 | + | [5] Currie T.C., Struk P.M., Tsao J.C., Fuleki D., Knezevici D.C. Fundamental study of mixed-phase icing with application to ice crystal accretion in aircraft jet engines. AIAA Aerospace Sciences Meeting and Exhibit, 2012-3035. |
| − | 6 | + | [6] Fuleki D.M., Macleod J.D. Ice crystal accretion test rig development for a compressor transition duct. AIAA Aerospace Sciences Meeting and Exhibit, 2010-7529. |
| − | 7 | + | [7] Mason J.G., Chow P., Dan M.F. Understanding ice crystal accretion and shedding phenomenon in jet engines using a rig test. ASME rep. ASME GT, 2010-22550. |
| − | 8 | + | [8] Struk P.M., Tsao J.C., Bartkus T.P. Plans and preliminary results of fundamental studies of ice crystal icing physics in the NASA propulsion systems laboratory. AIAA Aerospace Sciences Meeting and Exhibit, 2016-3738. |
| − | 9 | + | [9] Villedieu P., Trontin P., Chauvin R. Glaciated and mixed-phase ice accretion modeling using ONERA 2D icing suite. AIAA Aerospace Sciences Meeting and Exhibit, 2014-2199. |
| − | 10 | + | [10] Zhang L.F., Liu Z.X., Zhang M.H. Numerical simulation of ice accretion under mixed-phase conditions. P I Mech. Eng. G. J. Aer., 230:2473-2483, 2016. |
| − | 11 | + | [11] Norde E., Weide E.T.A., Hoeijmakers H.W.M. Eulerian method for ice crystal icing. AIAA J., 1-13, 2017. |
| − | 12 | + | [12] Nilamdeen S., Habashi W.G. FENSAP-ICE: Modeling of water droplets and ice crystals. AIAA Aerospace Sciences Meeting and Exhibit, 2009-4128. |
| − | 13 | + | [13] Spalart P.R., Allmaras S.R. A one-equation turbulence model for aerodynamic Flows. AIAA Aerospace Sciences Meeting and Exhibit, 1992-0439. |
| − | 14 | + | [14] Bourgault Y., Boutanios Z., Habashi W.G. Three-dimensional Eulerian approach to droplet impingement simulation using FENSAP-ICE. Part 1: Model, algorithm, and validation. J. Aircraft, 37:95-103, 2000. |
| − | 15 | + | [15] Hughes T.J.R., Brooks A. A theoretical framework for Petrov-Galerkin methods with discontinuous weighting functions: Application to the streamline-upwind procedure. Wiley press, pp. 647, 1982. |
| − | 16 | + | [16] Struk P., Currie T., Wright W.B., Knezevici D.C., Fuleki D., Broeren A., Vargas M., Tsao J.C. Fundamental ice crystal accretion physics studies. SAE rep., 2011-38-0018. |
| + | </div> | ||
Latest revision as of 12:56, 28 May 2021
Abstract
Ice crystals mainly cause compressor blades icing, and it is difficult to reveal the icing mechanism by experimental methods. Therefore, an Eulerian method was used to study ice crystal icing on a wedge airfoil in this paper. The calculation process was divided into three parts. First, the air flow field was calculated by Spalart-Allmaras turbulence model. Then the Eulerian method was used to obtain the trajectory of ice crystal and droplet. At last, the Messinger model was used to calculate the ice shape. The feasibility of the numerical method was verified by the NRC’s experiments. Then the effect of pressure on icing was analyzed. It could be found that the lower the pressure, the stronger the sublimation (evaporation) of ice crystals (droplets), and the more obvious the icing was. In addition, the ratio of LWC/TWC (Liquid Water Content/ Total Water Content) had a great effect on icing. It also could be found that too little or too much liquid water was not conductive for icing. The conclusions obtained by calculation were basically consistent with the NRC’s. The method in this paper could provide some reference for the subsequent study of engine icing mechanism or the design of anti-icing system.
Keywords: Eulerian method, mixed phase, numerical simulation
Nomenclature
| volume fraction | vapor diffusivity | ||
| density | mass fraction | ||
| velocity vector | Sherwood number | ||
| temperature | Nusselt number | ||
| spercific heat capacity | particle sphericity | ||
| diameter | time | ||
| heat transfer rate | mass flow rate | ||
| latent heat | dynamic viscosity | ||
| drag coefficient | Particle Reynolds number | ||
| gravitational acceleration vector | number density | ||
| sticking efficency | unit normal vector | ||
| Mach number | relative humidity |
Subscripts
| dispersed phase | carrier phase/collected | ||
| ice | vapor | ||
| air | surface | ||
| sublimation | convection | ||
| evaporation | melting | ||
| water | particle | ||
| control volume | incoming | ||
| outgoing | freezing | ||
| ice crystal | kinetic energy | ||
| aerodynamic heating | Wet bulb |
1. Introduction
Since the 1990s, more than one hundred events of engine power loss have been reported in the worldwide [1-2]. In 2006, a jet plane (Airbus 330) of Qatar Airlines appeared two engines flameout at 6437 m, which was the most serious event [3]. Finally, it was found that the ice crystals caused the ice accretion in engines led to the above accidents by investigation [2, 4]. The ice crystals enter the compressor absorb heat would melt partially, impact on the compressor blades and form a wet surface. Then wetted surface begin to stick more ice crystals and form liquid film. Under given environmental conditions, the liquid water release latent heat and freeze again. Ice crystals could even cause ice accretion in high pressure compressor, which would lead to air flow distortion, engine surge, and even flameout. In addition, the shedding ice would enter into the core machine, which could cause further blades damage.
The problem of ice accretion in aeroengine has attracted the attention of many countries. NASA (National Aeronautics and Space Administration) and NRC (National Research Council, Canada) played a leading role in this research field. NRC carried out experimental researches of ice accretion on local structure by using RATFac (Research Altitude Test Facility) [5-6]. In 2010, Mason first simulated ice crystal icing by RATFac under the condition that the total temperature was higher than 0℃, and pointed out that the formation of solid-liquid mixtures was the necessary condition for ice crystal icing [7]. However, this test platform could only produce ice crystals with an average diameter of 45-200 μm by grinding, and the ice crystals which usually caused compressor icing were less than 40 μm. The PSL (Propulsions System Lab) established by NASA could obtain ice crystals with diameter of 15 μm by heat transfer, and which could be used for full-scale engine ice accretion test [8]. Although the experiments were the most important methods for ice crystal research, the existing data collection methods can hardly be applied due to the bad and complex internal environment of the engine. In addition, it was also very challenging to produce micron-scale ice crystals by existing test platforms. Because of the above reasons, it was very difficult to study the ice crystal icing mechanism by experimental method. Therefore, the scholars have begun to use numerical methods to study icing phenomena. The calculation process of ice crystal icing is similar to that of supercooled droplet, which can be divided into three parts to obtain results of flow field, particle trajectory and ice layer separately. Here, the calculation of particle trajectory could be divided into Lagrange method [9-10] and Euler method [11-12]. Villedieu developed the prediction tool of ONERA 2D which took into accounts the effect of particle’s sphericity and rebounding, and this tool was calibrated by NASA-NARC’s experimental results [9]. Zhang used UDF based on FLUENT software to calculate ice accretion on NACA 0012 airfoil [10]. Norde [11] and Nilamdeen [12] took Eulerian method with less computation to simulate the icing process on NACA 0012. It could be found that the research results of ice crystal icing were much less than that of supercooled droplet.
In this paper, the icing process of symmetrical wedge airfoil was calculated based on Eulerian method. The phase transformation and particle rebound were taken into account. The numerical results also were compared with the NRC’s experimental results. The effects of pressure and the ratio LWC/TWC on icing also were analyzed.
2. Numerical methods
It could be considered that the effect of carrier phase on the dispersed phase is unidirectional, because the value of particle loading () is less than 0.1. Here, the flow field is simulated based on Palart-Allmaras turbulence model [13]. Then the above results are used to calculate the particle trajectory. At last, the Messinger model is used to obtain the results of icing process.
2.1. Model of particle motion and phase change
Since the mixed phase is a necessary condition for ice crystal icing. The volume fraction of dispersed phase should be divided into solid phase and liquid phase . The momentum conservation equation is extended from one to two
|
|
Although the calculation method of ice crystal icing is similar to that of supercooled droplet, there are changes in mass, energy and phase during particle moving. Therefore, the original mass and energy control equations [14] are not suitable. The mass and heat transfer should be considered in the conservation equations.
When the temperature is lower than the melting temperature , the volume fraction of liquid water is zero , and Ice crystals are entirely solid phase. The mass loss term on the right-hand (Eq. (3)) side is caused by sublimation. The energy transformations shown on right-hand side of Eq. (4) are caused by convection and sublimation separately
|
|
When the temperature reach the melting temperature , the volume fraction of dispersed phase equals the sum of liquid phase and solid phase . The ice crystals are solid in the interior and liquid in the exterior. The mixed phase particles obtain the heat is used for surface evaporation and melting. Therefore, the melting rate of ice crystals (Eq. (6)) can be deduced from the energy conservation (Eq. (5)) [11]:
|
|
The mass loss of ice crystals’ solid phase is mainly caused by melting (Eq. (7)), while the liquid phase receives the new melting mass (the first term on the right-hand side of Eq. (8)) and loses the mass caused by evaporation (the second term on the right-hand side of Eq. (8)). The energy equation is shown in Eq. (9)
|
|
|
When the temperature is higher than the melting temperature , the particles are fully liquid . The mass loss is mainly caused by evaporation (Eq. (10)), while energy change is caused by convective heat transfer and evaporation (Eq. (11))
|
|
The unknown variables (volume fraction , velocity and temperature ) could be solved by the control equations above. But the control equations can’t obtain the change of particle diameter . The number density of particles is constant unless particles are completely evaporated, therefore the change of particle diameter can be monitored by the conservation equation of number density
|
|
The above governing equations are solved by Streamline-Upwind Petrov- Galerkin method [15].
|
| (a) |
|
| (b) |
| Figure 1. Schematic diagram of Messinger model. (a) Mass conservation. (b) Energy conservation |
2.2 Model of ice accretion
In this paper, the classical Messinger model is used to calculate the icing process. The mass and energy conservation equations are established based on a control volume in this model [11]. The masses enter into the control volume are the melted part of ice crystal , droplet and runback water from theneighboring upstream control volume. The outgoing masses are evaporating water , icing mass and runback water (Figure 1). Therefore the mass conservation equation of control volume is shown as:
|
|
(14) |
The mass conservation equation of ice layer is shown as Eq. (15). When there is a liquid film, the ice sublimation is zero
|
where and is the sticking efficiency [12].
The energy governing equation is shown as:
|
|
(16) |
When the icing mass is less than the liquid mass entered into the control volume . It indicates that the ice crystals and droplets would immediately freeze on the surface and form the rime ice (, ). There is no liquid water film on surface, therefore the mass loss caused by evaporation is zero () and the energy loss caused by ice sublimation would replace by the evaporation in Eq. (16). Consequently, the mass and energy conservation equations of ice layer are shown as:
|
|
(17) |
|
|
(18) |
where , .
When the icing mass is less than the solid part of ice crystal collected by surface , it is indicated that the ice crystals and droplets only cause surface’s wetting. There is no icing occurred (, ). The mass and energy conservation equations of ice layer are shown as:
|
|
(19) |
|
|
(20) |
where , .
When , it is indicted that ice crystals and droplets impacted on surface partly freeze and partly form liquid film. That is to say, glaze ice forms on the surface (, , ). The mass conservation equations of control volume and ice layer remain unchanged (Eqs. (14) and (15)). However, the energy equation (Eq. (16)) is simplified as follows:
|
|
(21) |
3. Case study
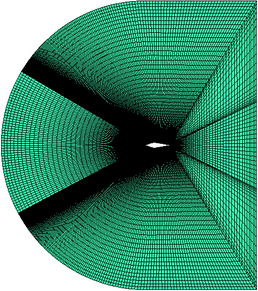
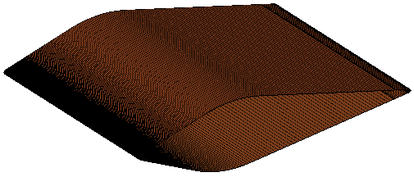
In this paper, a symmetrical wedge airfoil in NRC’s experiment [5,16] is taken as the research object. The front angel of this airfoil is 40°, and the rear angel is 20°. The chord length is 220.92 mm (Figure 2a). The grinder used in NRC’s experiment could produce ice crystals with an estimated median mass diameter (MMD) of between 100-200 μm, and the air-assist atomization nozzles could produce droplets with a median volume diameter (MVD) of 40 μm. Here, the ice crystal size is set as 150 μm in calculation. The whole flow field model (154, 064 hexahedral grids) is shown in Figure 3, and the inlet is about 1.27 m away from the leading edge of the wedge airfoil.
|
| (a) |
|
| (b) |
| Figure 2. Symmetrical wedge airfoil in NRC’s experiment. (a) Dimensions. (b) Actual photo |
|
| (a) |
|
| (b) |
| Figure 3. Mesh model. (a) Flow field model. (b) Symmetrical wedge airfoil |
3.1 Experiment verification
In order to verify the accuracy of the numerical method in this paper, the run 139 of NRC experiment is used to compare with the numerical results. The operating conditions are shown in Table 1.
| Angle of attack
|
Mach number
|
Total air pressure
|
Total air temperature
|
Initial particle
temperature |
Relative humidity
|
Accretion time
|
LWC | IWC |
| -6 ° | 0.2 | 45 kPa | 12.5 ℃ | 10 ℃ | 8% | 402 s | 1 g/m3 | 0 g/m3 |
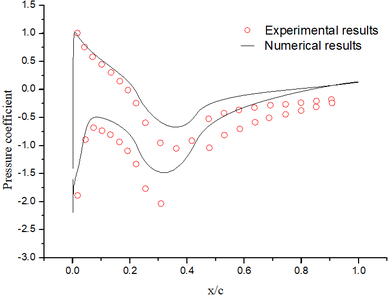
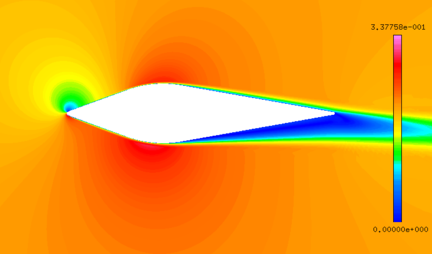
The abundant flow field data are obtained by the above numerical method. It could be found that the numerical results are basically the same as the experimental results (Figure 4).
|
| (a) |
|
| (b) |
| Figure 4. Flow field results. (a) Pressure coefficient. (b) Mach number contour |
Although the total temperature is 12.5 ℃, the wet bulb temperature is negative. The intense evaporation process absorbs a large amount of heat, which results in the droplets temperature decreasing gradually. When the droplets reach the stagnation point, the temperature of droplets decrease from the initial temperature of 10℃ to -8℃ (Figure 5a), and the diameter decrease from 40 μm to 39.3 μm (Figure 5b). After 402 s exposure under this condition, the numerical results are basically consistent with the experimental results (Figure 6).

|
| (a) |

|
| (b) |
| Figure 5. Numerical results of particle trajectory. (a) Droplet temperature contour. (b) Droplet diameter contour |
|
| (a) |
|
| (b) |
| Figure 6. Comparison of ice layer after 402 s. (a) Experimental results. (b) Numerical results |
3.2 Effect of pressure on icing
In order to study the effect of pressure on icing, the calculations of the following conditions are carried out (Table 2, the conditions of Model A is the same as that of run 543 of NRC’s experiment [16]). In all models, the angle of attack are 0°, the MMD of ice crystal is 150 μm, the MVD of droplet is 40 μm, and the ice accretion time is 60 s.
| Mach number
|
Total air pressure
|
Total air
temperature |
Initial particle
temperature / |
Relative humidity
|
LWC | IWC | |
| Model A | 0.25 | 44.8 kPa | 13 ℃ | 10 ℃/-15℃ | 8% | 2.9 g/m3 | 7 g/m3 |
| Model B | 0.25 | 68 kPa | 13 ℃ | 10 ℃/-15℃ | 8% | 2.9 g/m3 | 7 g/m3 |
| Model C | 0.25 | 93 kPa | 13 ℃ | 10 ℃/-15℃ | 8% | 2.9 g/m3 | 7 g/m3 |
Figure 7 shows the comparison of droplet (Figure 7a) and ice crystal (Figure 7b) diameters on the airfoil surface. It could be found that the droplet and ice crystal diameters of Model A are obviously smaller than the other two models. The results show that the decrease of total pressure will lead to the increase of evaporation rate and the further decrease of wet bulb temperature under the same conditions. Therefore, under the influence of evaporation rate, the mass loss of ice crystal or droplet is the greatest under low pressure (Model A).
|
| (a) |
|
| (b) |
| Figure 7. Comparison of particle diameters on the airfoil surface. (a) Droplet. (b) Ice crystal |
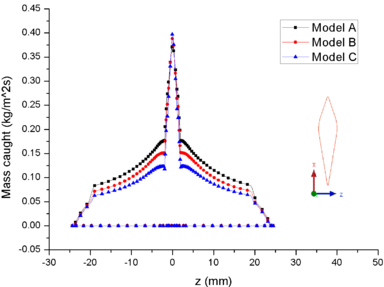
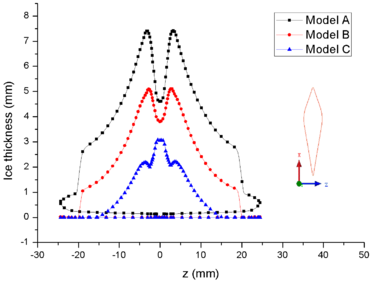
Figure 8 shows the comparison of mass collection rate (Figure 8a) and ice thickness (Figure 8b) on the airfoil surface. It could be found that droplets (or ice crystal) are most likely to impact the leading edge of the airfoil (), and there is little difference in particle collection between the three models (Figure 8a). However, in the other parts of the airfoil windward, the mass collection rate under low pressure condition (Model A) is higher than that under high pressure conditions (Mode B and Model C). Because the larger the particle size, the higher the probability of rebound or breakup after impacting on the surface. From the comparison of ice thickness (Figure 8b), it could be found that the pressure has a great influence on icing. It is easier to freeze under low pressure condition (the ice thickness of Model A at stagnation point is 4.6 mm, while that of experiment is 4.5 mm). On the one hand, the mass collection rate is higher under the lower pressure condition (Figure 8a). On the other hand, the wet bulb temperature is lower under the lower pressure condition (the wet bulb temperature of Model A, B and C are -3℃, -1℃, and 1℃ respectively), which is more conductive to freeze.
In summary, the lower the pressure, the lower the wet bulb temperature and the stronger the evaporation, the easier the formation of icing conditions, which also explains why the engine internal icing usually occurs at high altitude.
|
| (a) |
|
| (b) |
| Figure 8. Comparison of mass caught and ice thickness on the airfoil surface. (a) Mass caught. (b) Ice thick ness |
3.3 Effect of the ratio of LWC/ TWC on icing
The calculation of working conditions shown in Table 3 is also carried out. The web bulb temperature is -3℃, the angle of attack are 0°, the MMD of ice crystal is 150 μm, the MVD of droplet is 40 μm, and the ice accretion time is 120 s. Here, the total water content TWC is 4 g/m3 (TWC=IWC+LWC).
| Mach number
|
Total air pressure
|
Total air temperature
|
Initial particle temperature
/ |
Relative humidity
|
LWC | IWC | |
| Model D | 0.25 | 44.8 kPa | 13 ℃ | 10 ℃/-15℃ | 8% | 0 g/m3 | 4 g/m3 |
| Model E | 0.25 | 44.8 kPa | 13 ℃ | 10 ℃/-15℃ | 8% | 1 g/m3 | 3 g/m3 |
| Model F | 0.25 | 44.8 kPa | 13 ℃ | 10 ℃/-15℃ | 8% | 2 g/m3 | 2 g/m3 |
| Model G | 0.25 | 44.8 kPa | 13 ℃ | 10 ℃/-15℃ | 8% | 3 g/m3 | 1 g/m3 |
| Model H | 0.25 | 44.8 kPa | 13 ℃ | 10 ℃/-15℃ | 8% | 4 g/m3 | 0 g/m3 |
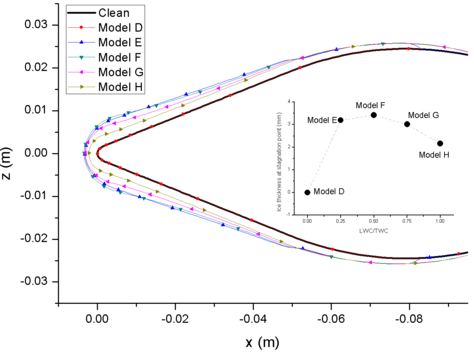
Figure 9 shows the comparison of ice accretion, and Figure 10 shows the velocity magnitude contour of different models. The Model D has no liquid water (LWC=0 g/m3), and doesn’t form mixed phase. The dry airfoil surface can’t stick any ice crystals to form ice layer. Model E contains less liquid water, and only liquid film and ice layer appear on the windward side of airfoil. However, with the increase the LWC, the liquid film on the surface begin to flow to the leeward side (Model F, Model G and Model H) and form ice layer on the leeward side. When the ratio of LWC/TWC is 0.5, the ice layer at stagnation point is the thickest (Figure 9). When there is less liquid water, the ice layer is thinner and the sticking ability of film is weaker. When there is less ice crystal, it is not conducive to the formation of icing conditions.
|
| Figure 9. Ice layer comparison of different models |

|
| Figure 10. Film velocity magnitude of different models |
4. Conclusions
In this paper, the icing process of a symmetrical wedge airfoil was calculated. First, the air flow field results were obtained by Spalart-Allmaras turbulence model. Then the Eulerian method was used to calculate the particle trajectory. At last, the Messinger model was used to calculate the icing. The NRC’s experimental results were used to validate the above numerical method. Meanwhile, the effects of pressure and the ratio of LWC/TWC on icing were also analyzed. The experimental phenomena were also explained by the calculation results. The method used in this paper could provide some reference for study of engine icing mechanism or the design of anti-icing system.
Funding: This research was funded by the Scientific Research Foundation of CAFUC (J2019-60).
Conflicts of Interest: The authors declare no conflicts of interest.
References
[1] Yuan Q.H., Fan J., Bai G.C. Review of ice crystal icing in aero-engines. J. Propul. Technol., 39:2641-2650, 2018.
[2] Mason J.G., Strapp J.W., Chow P. The ice particle threat to engines in flight. AIAA Aerospace Sciences Meeting and Exhibit, January 2006-206.
[3] Pasztor A. Airline regulators grapple with engine-shutdown peril. Wall Street Journal, 251, 2008.
[4] Grzych M.L., Mason J. Weather conditions associated with jet engine power-loss and damage due to ingestion of ice particles: what we’ ve learned through 2009. 14th Conference on Aviation, Range and Aerospace Meteorology, Washington, DC, U.S., 2010.
[5] Currie T.C., Struk P.M., Tsao J.C., Fuleki D., Knezevici D.C. Fundamental study of mixed-phase icing with application to ice crystal accretion in aircraft jet engines. AIAA Aerospace Sciences Meeting and Exhibit, 2012-3035.
[6] Fuleki D.M., Macleod J.D. Ice crystal accretion test rig development for a compressor transition duct. AIAA Aerospace Sciences Meeting and Exhibit, 2010-7529.
[7] Mason J.G., Chow P., Dan M.F. Understanding ice crystal accretion and shedding phenomenon in jet engines using a rig test. ASME rep. ASME GT, 2010-22550.
[8] Struk P.M., Tsao J.C., Bartkus T.P. Plans and preliminary results of fundamental studies of ice crystal icing physics in the NASA propulsion systems laboratory. AIAA Aerospace Sciences Meeting and Exhibit, 2016-3738.
[9] Villedieu P., Trontin P., Chauvin R. Glaciated and mixed-phase ice accretion modeling using ONERA 2D icing suite. AIAA Aerospace Sciences Meeting and Exhibit, 2014-2199.
[10] Zhang L.F., Liu Z.X., Zhang M.H. Numerical simulation of ice accretion under mixed-phase conditions. P I Mech. Eng. G. J. Aer., 230:2473-2483, 2016.
[11] Norde E., Weide E.T.A., Hoeijmakers H.W.M. Eulerian method for ice crystal icing. AIAA J., 1-13, 2017.
[12] Nilamdeen S., Habashi W.G. FENSAP-ICE: Modeling of water droplets and ice crystals. AIAA Aerospace Sciences Meeting and Exhibit, 2009-4128.
[13] Spalart P.R., Allmaras S.R. A one-equation turbulence model for aerodynamic Flows. AIAA Aerospace Sciences Meeting and Exhibit, 1992-0439.
[14] Bourgault Y., Boutanios Z., Habashi W.G. Three-dimensional Eulerian approach to droplet impingement simulation using FENSAP-ICE. Part 1: Model, algorithm, and validation. J. Aircraft, 37:95-103, 2000.
[15] Hughes T.J.R., Brooks A. A theoretical framework for Petrov-Galerkin methods with discontinuous weighting functions: Application to the streamline-upwind procedure. Wiley press, pp. 647, 1982.
[16] Struk P., Currie T., Wright W.B., Knezevici D.C., Fuleki D., Broeren A., Vargas M., Tsao J.C. Fundamental ice crystal accretion physics studies. SAE rep., 2011-38-0018.
Document information
Published on 16/09/19
Accepted on 07/09/19
Submitted on 02/08/19
Volume 35, Issue 3, 2019
DOI: 10.23967/j.rimni.2019.09.001
Licence: CC BY-NC-SA license
Share this document
claim authorship
Are you one of the authors of this document?