Jose Enrique (talk | contribs) |
|||
| (3 intermediate revisions by 2 users not shown) | |||
| Line 518: | Line 518: | ||
|} | |} | ||
The Ms Excel file below includes the results of the time evolution of the cable under its self weight (corresponding to Figure [[#img-5|5]]). | The Ms Excel file below includes the results of the time evolution of the cable under its self weight (corresponding to Figure [[#img-5|5]]). | ||
| − | + | [[Media:Gutiérrez_Romero_et_al_2017a_2885_Case_1.xlsx|Case_1.xlsx]] | |
| − | [[Media: | + | |
==Case 2: Free vibration cable== | ==Case 2: Free vibration cable== | ||
| Line 619: | Line 618: | ||
===6.1 RAO analysis and comparison=== | ===6.1 RAO analysis and comparison=== | ||
| − | First, a RAO analysis is performed in the absence of wind. The frequency results of the seakeeping solver are obtained after applying a Fourier transform to the time history generated. Figure [[#img-12|12]] shows an inter-code comparison. Note that a good agreement among the different solvers is found | + | First, a RAO analysis is performed in the absence of wind. The frequency results of the seakeeping solver are obtained after applying a Fourier transform to the time history generated. Figure [[#img-12|12]] shows an inter-code comparison. Note that a good agreement among the different solvers is found <span id='citeF-49'></span>[[#cite-49|[49]]]. |
<div id='img-12'></div> | <div id='img-12'></div> | ||
| Line 696: | Line 695: | ||
Finally, four analyses of the OC3 spar buoy in operational conditions are presented. The different analyses are carried out in similar environmental conditions, but using first and second-order irregular waves. Furthermore, additional studies including Quasi-Static and dynamic mooring models are performed. The goal of these analyses is to evaluate the effects of the mooring model and the wave order on the dynamics of the system, as well as to estimate the tension in the mooring lines. On the one hand, the wind turbine system is assumed to be operating at an average wind speed of 11.4 m/s, which generates the maximum thrust and torque. FASTLognoter <span id='citeF-50'></span><span id='citeF-51'></span>[[#cite-50|[50,51]]] has been used to linearise with FAST <span id='citeF-50'></span>[[#cite-50|[50]]] the behaviour of the wind turbine around the operating wind speed. Restoration and damping matrices resulting from the linearisation of the wind turbine system are included into the global dynamics. It should be remarked that the rotational and periodicity effects are considered in the calculation of the steady state matrix. On the other hand, the wind loads are estimated considering non-uniform wind flow, with an average wind speed of 11.4 m/s. The wind flow profile is obtained using Turbsim <span id='citeF-55'></span>[[#cite-55|[55]]], and the wind loads on the wind turbine are obtained from FAST/AeroDyn <span id='citeF-50'></span>[[#cite-50|[50]]]. | Finally, four analyses of the OC3 spar buoy in operational conditions are presented. The different analyses are carried out in similar environmental conditions, but using first and second-order irregular waves. Furthermore, additional studies including Quasi-Static and dynamic mooring models are performed. The goal of these analyses is to evaluate the effects of the mooring model and the wave order on the dynamics of the system, as well as to estimate the tension in the mooring lines. On the one hand, the wind turbine system is assumed to be operating at an average wind speed of 11.4 m/s, which generates the maximum thrust and torque. FASTLognoter <span id='citeF-50'></span><span id='citeF-51'></span>[[#cite-50|[50,51]]] has been used to linearise with FAST <span id='citeF-50'></span>[[#cite-50|[50]]] the behaviour of the wind turbine around the operating wind speed. Restoration and damping matrices resulting from the linearisation of the wind turbine system are included into the global dynamics. It should be remarked that the rotational and periodicity effects are considered in the calculation of the steady state matrix. On the other hand, the wind loads are estimated considering non-uniform wind flow, with an average wind speed of 11.4 m/s. The wind flow profile is obtained using Turbsim <span id='citeF-55'></span>[[#cite-55|[55]]], and the wind loads on the wind turbine are obtained from FAST/AeroDyn <span id='citeF-50'></span>[[#cite-50|[50]]]. | ||
| − | |||
{| class="floating_tableSCP wikitable" style="text-align: center; margin: 1em auto;" | {| class="floating_tableSCP wikitable" style="text-align: center; margin: 1em auto;" | ||
| Line 803: | Line 801: | ||
Table [[#table-3|3]] shows the mean and RMS values, as well as the motion amplitude for the first and second-order movements. When comparing the QS and the NFEM models, only slight differences are observed. In particular, the second-order pitch motion is higher when using the NFEM model, compared to the QS model, while the other values remain with similar trends for both models. | Table [[#table-3|3]] shows the mean and RMS values, as well as the motion amplitude for the first and second-order movements. When comparing the QS and the NFEM models, only slight differences are observed. In particular, the second-order pitch motion is higher when using the NFEM model, compared to the QS model, while the other values remain with similar trends for both models. | ||
| − | |||
{| class="floating_tableSCP wikitable" style="text-align: center; margin: 1em auto;" | {| class="floating_tableSCP wikitable" style="text-align: center; margin: 1em auto;" | ||
| Line 925: | Line 922: | ||
|} | |} | ||
| + | |||
| + | Next, a video of the analysis case 1 is presented. | ||
| + | |||
| + | {| style="font-size:75%; color: #222222; border: 1px solid darkgray; background: #f3f3f3; table-layout: fixed; width:100%;" | ||
| + | |- | ||
| + | | {{#evt:service=youtube|id=https://youtu.be/l2tI-CEz03E|alignment=center}} | ||
| + | |- style="text-align: center;" | ||
| + | | '''Video 1.''' OC3 spar buoy wind turbine simulation (analysis case 1). | ||
| + | |} | ||
| + | |||
Figure [[#img-17|17]] shows the tension for each mooring line at the fairlead point. The NFEM model recorded larger amplitude oscillations (in the range of 5 s to 10 s period) compared with QS model. The differences observed in Fig. [[#img-17|17]] in the tension amplitude reach up to 24 <math display="inline">%</math>. This fact suggests that using a QS model for fatigue assessment of the mooring lines could overestimate their fatigue life. | Figure [[#img-17|17]] shows the tension for each mooring line at the fairlead point. The NFEM model recorded larger amplitude oscillations (in the range of 5 s to 10 s period) compared with QS model. The differences observed in Fig. [[#img-17|17]] in the tension amplitude reach up to 24 <math display="inline">%</math>. This fact suggests that using a QS model for fatigue assessment of the mooring lines could overestimate their fatigue life. | ||
Latest revision as of 09:37, 28 October 2019
Abstract
The complexity of the dynamic behaviour of offshore marine structures requires advanced simulations tools for the accurate assessment of the seakeeping behaviour of these devices. The aim of this work is to present a time-domain model for solving the dynamics of floating marine devices, subjected to non-linear environmental loads and paying special attention on the mooring dynamics. First, the formulation of the hydrodynamic approach for solving the wave-floater interaction is introduced. Second, the solver of the mooring dynamics, based on a non-linear Finite Element Method approach, is presented. Third, a procedure for coupling the hydrodynamic along with other external loads, with the floating structure and mooring dynamics is described. Fourth, some validation examples and comparisons among different mooring approaches are presented. Fifth, an analysis of the OC3 floating wind turbine concept is performed to study the influence of different mooring models, the effects of non-linear waves on the platform, and the tension in the mooring system. The dynamic mooring model along with the second-order wave model produce realistic simulations of the floating wind turbine performance.
1 Introduction
Research trends in Marine Renewable Energies (MRE) are mainly focused in offshore wind energy due to the high expectations raised by this technology. The technology for marine wind turbines is currently well-developed, but limited for fixed installations in shallow-water areas. The next horizon is focused on deep-water technology [1], but different challenges for Floating Offshore Wind Turbines (FOWT) are not solved yet [2], such as the dynamic stability in the presence of non-linear ambient loads [3]. In fact, an accurate prediction of the dynamic response of a FOWT, considering the interaction among the hydrodynamics, mooring, and aerodynamics of the turbine, is identified as one of the key challenges for the simulation tools required to design the future FOWTs [4,5,6].
Standard design procedures and simulation tools for marine structures come from the existing technology and experience of the offshore oil and gas industry. For instance, the classic simulation approaches are based on uncoupled formulations, where the hydrodynamic response of the floater is linearised and can be decoupled from the mooring [7,8]. Recently, coupled simulations have been adopted to solve the seakeeping of FOWT devices, since the dynamic of FOWT offers a high complexity due to the variety of loads and non-linear effects. Anyhow, the interaction among different components, such as the wind turbine structure, the rotor dynamics, the mooring arrangements and the floating structure must be taken into account in a more accurate way [9,10].
The analysis of FOWT should be carried out with simulation codes capable to include the physics governing the dynamic response of these devices. With regards to marine structures, Low and Langley [11] showed that the dynamic response of a floating production system in a random sea can be split in two timescales: low frequency and wave frequency responses. Moreover the seakeeping of the floating device and the dynamics of the mooring lines are coupled. Then, the analysis should take into account the interaction between them, and the time-domain analysis seems to be the right way to simulate this sort of coupled problems. In fact, the American Bureau of Shipping [32] considers that the global seakeeping analysis of a FOWT should take into account: the unsteady wind loads, wind turbine control systems, wind turbine-platform interaction, wave actions over the platform, currents, mooring loads, and any other types of external actions. It will be presented later on that the time-domain approach allows to handle these actions in a natural manner.
The first works proposing coupled formulations for floating production systems were developed for TLP-type platforms [12,13,14], where it was found that the sum-frequency effects are important. Also other authors investigated and developed models to couple different effects and loads in floating devices [15,16,17,18]. More recently, Cordle and Jonkman [5] made a review of the state of art of the simulation tools for FOWT. Bae and Kim [9] recently presented a research on the effects of second-order wave excitation in a mono-column-TLP type FOWT comparing with the uncoupled simulations in time-domain. Karimirad and Moan [19] developed a simplified method for the coupled dynamics of a offshore wind turbine aiming at saving computational time. They also analysed a spar-type FOWT, and compared different hydro-elasticity codes [2]. In [3], the dynamic response of the spar-type platform subject to wave induced excitation was investigated numerically, including catenary mooring cables. Matha et al. [6] investigated a platform-tower coupled with a TLP-type FOWT. Jonkman and Sclavounos [20] presented a tool integrating an aeroelastic model for onshore wind turbines, and a hydrodynamic load model, together with a Quasi-Static (QS) catenary model for mooring lines. More sophisticated mooring models, which are usually based on Finite Element Methods (FEM) have been investigated; for instance, Kim et al. [21] presented a comparison between a linear spring and a non-linear FEM mooring for the analysis of the dynamic response when they are coupled with a floating structure. Several coupled seakeeping analyses with FEM mooring line models can also be found in the literature [22,23,24,25,26,27].
Frequency-domain and time-domain approaches are used for seakeeping analyses of marine structures. However, the frequency-domain approach has difficulties to accurately handle non-linearities such as those arising from the mooring lines, and the low frequency components of the wave-body interaction, as appointed by Low [29], while the time-domain analysis can straightforwardly include any non-linearity within each time step in a natural manner. However, the main drawback of the time-domain is an increase of the computational time required for the simulations. To overcome this limitation, Low and Langley [11] and Low [29] presented a hybrid time-frequency domain model to simulate low and wave frequency response of coupled problems.
In this work, an extension of the time-domain method proposed by Serván-Camas and García-Espinosa [30,31] is used. This method obtains a relevant reduction of the computational time thanks to the use of deflation techniques and High Performance Computation based on Graphical Processor Units (GPU). The tool is based on the Finite Element Method (FEM) and is able to solve multi-body seakeeping problems on unstructured meshes including any type of external load. Other examples of FEM solvers for seakeeping analysis can be found in the literature. For instance, Hong and Nam [33], who presented a second-order analysis of wave forces using FEM in the time-domain, and investigated the interactions with multi-body devices.
This work presents the development of a coupled FEM seakeeping and mooring models for the analysis of floating offshore structures. The model is able to take into account first and the second-order irregular waves, wind loads, and mooring loads. A novel iterative scheme for coupling the wave diffraction-radiation solver developed by Serván-Camas and García-Espinosa [28,30,31] with non-linear aerodynamics and mooring loads is also described. The paper is organized as follows. First, the governing equations of the body dynamics are introduced. Second, the second-order diffraction-radiation wave problem is described. Third, the non-linear FEM model for mooring lines is introduced in detailed. Fourth, the coupling between the dynamics of the floater with non-linear loads, such as mooring lines forces, is explained. Fifth, some validations with experimental results are shown, as well as a comparison of the non-linear FEM model with the Quasi-Static catenary model. Sixth, we analyse an operational case of a spar buoy FOWT based on the OC3 concept and NREL 5 MW turbine. This case study aims at evaluating the influence of the type of mooring model, as well as the effects of non-linear wave on the dynamics of the platform. Finally, some relevant conclusions from the obtained results are presented.
2 Problem statement
2.1 General dynamics of floater
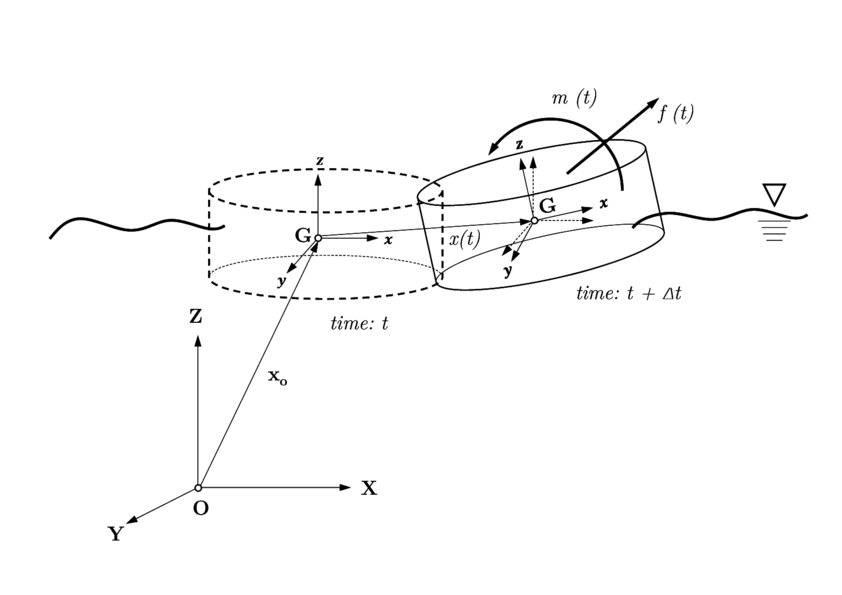
The motion of a floater subject to ambient loads can be modelled using the rigid body dynamics. Let OXYZ be a fixed global frame of reference, and let Gxyz be a local frame of reference located at the center of gravity, and whose axis are parallel to the axis of the global frame (see Fig. 1). Assuming small rotations, for each time step, the body accelerations can be obtained respect to the local frame from the rigid-body dynamic equations:
|
where is the mass matrix, is the linear acceleration vector , is the instantaneous inertia tensor, and are the external loads vector (hydrostatics, wave loading, mooring, wind, etc.) and the external moments respectively; finally is the angular acceleration vector.
|
| Figure 1: Global and local frame of reference used in computation of floater dynamics. |
The calculation of the external forces over the body constitutes an essential part of the dynamics, and will be described in more detailed later on.
2.2 Flow equation and boundary value problem
Assuming incompressible and irrotational flow in a domain , being the wetted surface of the floating device, the wave problem governing equations are [28]:
|
where is the velocity potential, is the free surface elevation, is the gravity acceleration, is the pressure on free surface, is the fluid density, is the wave elevation, is a pressure at a point over body, is the fluid velocity, is the local velocity at a point on the wetted body surface, is the vector normal to the body wetted surface (pointing upward this surface), and is the vertical coordinate of any point of the body.
2.3 Second-order diffraction-radiation governing equations
The governing equations for the second-order diffraction-radiation wave problem are obtained applying Taylor expansion on the boundary surfaces of a time-independent domain. This approach allows to approximate the free surface on and the mean body surface at time . Then, a perturbed solutions based on Stokes expansion procedure is applied to the velocity potential, free surface elevation, and body motion. More details can be found in [28].
The solution can be decomposed as
|
where is the incident wave velocity potential, is the diffraction-radiation wave velocity potential, is the incident wave elevation, and is the diffraction-radiation wave elevation. Then, the wave diffraction-radiation governing equations up to second-order are [28]:
|
where superscripts 1 and denote the components at the first-order and up to second-order solution, and is the displacement vector at a point over body.
2.4 Second-order wave loads
With regards to the ambient loads applied over wetted body surface, hydrodynamic wave forces and moments can be obtained directly from pressure integration over the wetted body surface. Thus, it can be written that
|
where subscript denotes the hydrostatic loads and denotes the dynamic loads. and are the initial hydrostatic forces and moments over the body, and are the up to second-order hydrostatic loads and moments, and and are the up to second-order dynamic loads and moments. Details of each component can be found in [28].
3 Non-linear FEM model for mooring dynamics
3.1 Equations for cable dynamics
The dynamic equations for a mooring cable with length with negligible bending and torsional stiffness can be formulated as [34,35]
|
|
(17) |
where is the water density, is the added mass coefficient, is the mass per unit length of the unstretched cable, is the position vector, is the Young's modulus, is the cross-sectional area of the cable, is the strain, are the external loads applied on the cable, and is the length along the unstretched cable.
The boundary conditions are given by
|
where is the second derivative of the position vector at the fairlead connection point. The external loads acting on the cable, considered in this work, are the self-weight of the cable, hydrostatic loads, drag forces [36], and seabed interaction.
3.2 Seabed interaction
When the cable undergoes an excitation, the part which lies between the anchor and the touchdown point interacts with the seabed. This interaction is a complex non-linear effect. In this work, the seabed-mooring interaction is modelled as a spring-damping system [37,38], and is implemented as follows:
- The vertical forces due to the stiffness of the seabed in each time step are calculated as
- The vertical forces due to the damping system are modelled as
- Finally, the horizontal forces due to the seabed interaction are modelled as
|
|
(21) |
where is a coefficient limiting the seabed reactions, is the portion of the cable resting on the seabed, is the weight per unit of length of the line, is the apparent weight of the cable, is the term related to the numerical integration of the dynamic FEM model, is the vertical coordinate of the cable, is the seabed stiffness, is the contact area of the line, and is the time step. The term is defined as
|
|
(22) |
where is the diameter of line.
The term can be defined as a limit of the line subsidence.
|
being a term related to the numerical scheme adopted. In addition is expressed as
|
|
(25) |
where is the seabed damping Palm.
|
|
(26) |
|
|
(27) |
The algorithm developed to solve the mooring dynamics is described next.
3.3 Non-linear FEM algorithm solution
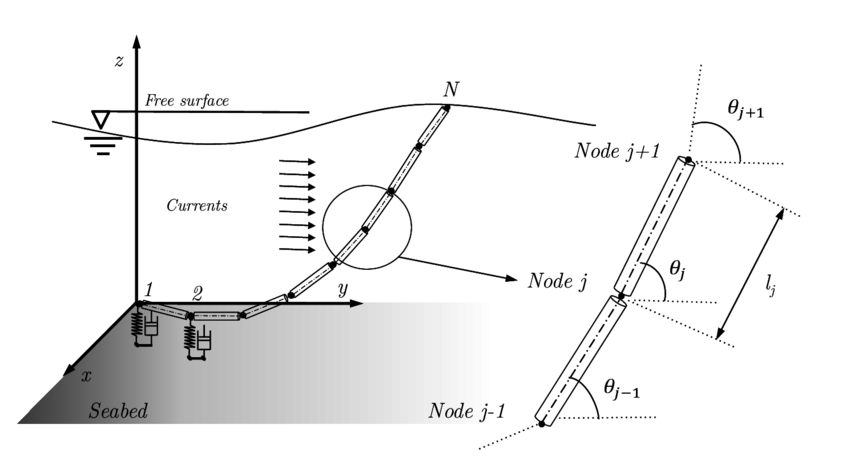
Truss elements, with just three translational degrees of freedom per node, are used for modelling the mooring lines, since bending effects can be neglected in most of cases [7,40]. In this work, a FEM approach combined with an updated Lagrange formulation is used for describing the dynamics of the mooring cable. Some authors showed that the corotational formulation can get a better performance than the updated formulation. However some instabilities and lack of convergence can appear. Figure 2 shows a scheme of the discretization adopted in this work.
|
| Figure 2: Scheme showing the general approach adopted for the spatial discretization of the cable mooring. |
Applying the standard FEM formulation for the non-linear elastodynamics problems [41], the equations for the dynamic equilibrium of the forces on a cable for each time step can be written as
|
|
(28) |
where are the external loads vector, is a consistent mass matrix of the line, considering inertia and added mass, is the pretension vector in the initial configuration, and is the internal forces vector of the cable. Damping effects of the mooring cable are introduced through a Rayleigh proportional damping matrix of . The application of the non-linear FEM approach to the cable equation can be found in [41,42].
Considering the linearization of the current configuration, Eq. (28) can be expressed as
|
|
(29) |
where and are called the material stiffness matrix and the geometric stiffness matrix, respectively, in the FEM literature [41,42]. The sum of both matrices is the so-called tangent stiffness matrix. The geometric part of the stiffness matrix is considered as non-linear since no material properties appear, and it depends of the Second-Piola stress tensor of the current configuration. Incremental displacement of the cable nodes is .
An implicit Bossak-Newmark [43] time integration scheme is applied for the time-integration of the Eq. (29). This provides a set of algebraic equations to be solved iteratively,
|
where is the time step, denotes the ith iteration, is a parameter concerned with the Bossak-Newmark implicit method, and and are parameters related to the Newmark time integration scheme.
The new position and velocity of each node in each time step can be expressed as (see Fig. 3)
|
It can be highlighted that multi-segmented mooring systems can be solved with this approach, and the equilibrium between two or more mooring cables is determined using the Newton-Raphson method. A criterion based on the maximum difference between the position reached by the nodes in two consecutive iterations is applied to evaluate the convergence of the algorithm.
|
| Figure 3: General approach to algorithm for solving the floater dynamics. |
The iterative procedure for solving the cable dynamics can be summarized as
- Setting the problem statement and boundary conditions, as well as the initial equilibrium configuration, of the mooring line. For instance, initial position based on a static catenary with touchdown can be chosen. Then, the tension obtained in this preliminary calculation is used as an initial pretension of the line .
- Evaluation of mass, damping, and tangent stiffness matrices. The procedure to calculate the tangent stiffness matrix can be found in [44].
- Estimation of forces in each node of the cable at , including drag, seabed interaction, hydrostatic, and gravity loads.
- Solving the cable dynamic Eqs. (31-32) in order to obtain the new position of the cable nodes.
- Iteration from the step 2 through 4 until convergence is reached for each element of the line. In this work an Aitken's method is used to accelerate the iterative algorithm [45].
4 Algorithm to solve the floater dynamics
Most of the models found in the literature to solve the coupled mooring-body dynamics use a frequency domain analysis of the floater together with a convolution integral [46] for solving the motions of the coupled system [9,20,19]. The most common approach is based on a frequency-domain diffraction-radiation solver based on the Boundary Element Method (BEM) combined with a FEM model to solve the mooring dynamics. In this work, a different approach based on a time-domain FEM seakeeping model recently presented [30,31] is proposed. This approach allows to straightforwardly couple the seakeeping of the floater with non-linear loads.
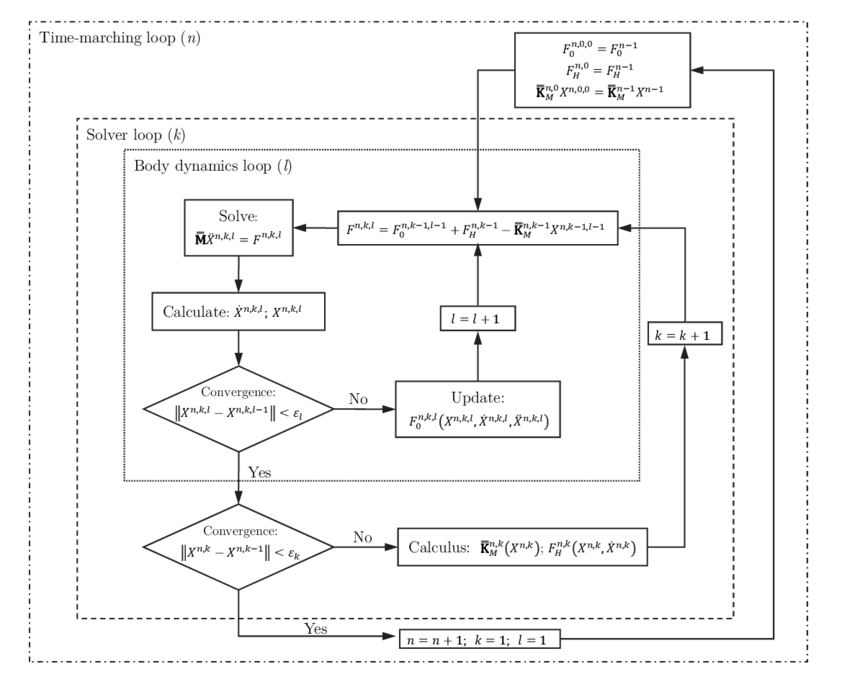
The algorithm used in this work to solve the dynamics of the coupled system is presented in Fig. 3. In order to accelerate the solution of the non-linear solver, it includes two nested loops; the external loop iterates on the wave diffraction-radiation problem, while the internal loop takes into account the remaining external forces vector acting on the body. In this figure are the external forces different from the hydrodynamic and the mooring forces, and is the matrix of the linearised mooring. The procedure to carry out the coupled analysis is as follows:
- For each iteration of the solver loop, the wave diffraction-radiation problem is solved using the body velocities obtained previously, within the iteration, in the body dynamics loop (see Fig. 4).
- On the one hand, once the velocity potential is known, hydrodynamic loads are computed. On the other hand, the stiffness matrix of the mooring lines are obtained by means of the Jacobian matrix for the current position of the fairlead points. Those matrixes are used to estimate the mooring forces within the inner loop of the dynamic solver.
- The hydrodynamic loads and the mooring stiffness matrix are sent to the body dynamic loop .
- For each iteration of the body dynamics loop, the body dynamic equations are solved.
- Then, the body position and velocity are sent to the solver loop and introduced in the boundary conditions for the wave diffraction-radiation problem.
- The solver loops iterate until convergence is reached.
- Once the solver loop converges, it is proceeded to the calculation of the next time step.
|
|
(33) |
where is the restoring force vector of the mooring cables.
4.1 Coupling between rigid body motions and non-linear FEM mooring
As mentioned above, the cable dynamics is formulated in term of the acceleration, and this is also valid for the boundary condition of the fairlead connection point. A linear approximation to evaluate the end node acceleration based on the prescribed displacement is proposed in this work. Each time step is divided in sub-interval, that is to say, . So, in the -th time step, the acceleration of end node fulfills the following compatibility relationship
|
|
(34) |
where is a coefficient to be determined in each time step. Applying an appropriate boundary condition, this coefficient can be formulated as
|
|
(35) |
Above formulation for the boundary condition at the fairlead point has shown a better stability for the dynamics solver than higher order approximations.
As it was presented in the previous section, in the first iteration of the dynamic loop, the stiffness matrix of the cable is estimated by obtaining the Jacobian of the reaction forces using numerical differentiation,
|
|
(36) |
where is the reaction of the mooring cable at the fairlead point. Thus, the cable response is linearised within each time step , by estimating the mooring restoring forces as
|
where the terms correspond to a linear stiffness matrix, and , and are the displacements of the fairlead point from the position at the beginning of the current time step.
5 Validation of the non-linear FEM mooring model
In this section some validation examples of the non-linear FEM model are presented.
Case 1: Cable under its self weight
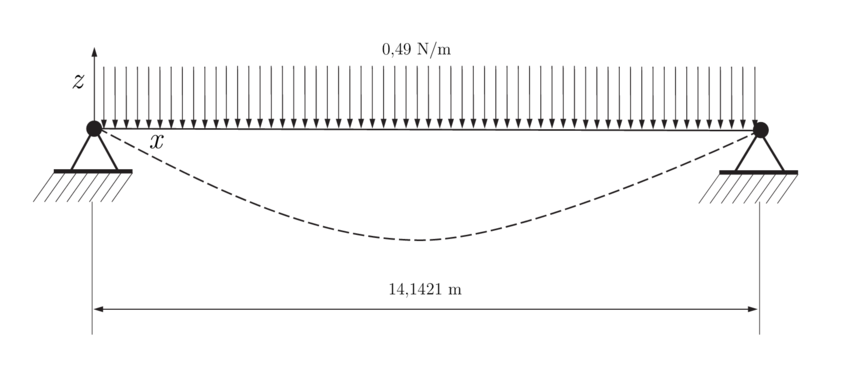
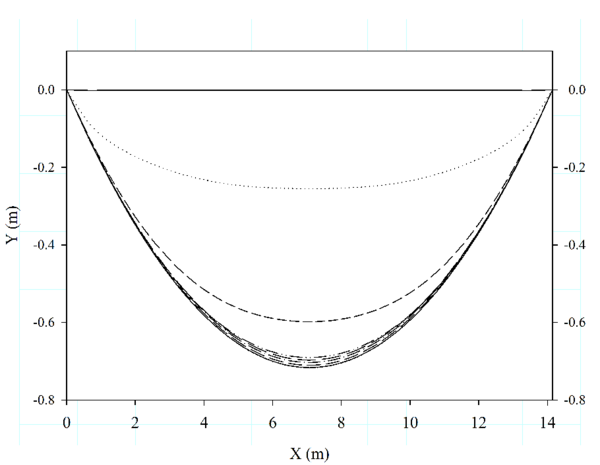
The first case is based on that presented in [47]. It consists of an isolated cable, with fixed ends, subjected to its own weight (see Fig. 4). Initially the cable has a flat form. The expected deformation is a U form, and the reactions at the ends must be equal to the cable weight. The properties of the cable are: the stiffness 50 N, the weight per unit length N/m, and m of span length. The cable is discretized into twenty-two bar elements, and the time step adopted is s. Figure 5 shows different positions of the cable until it gets the expected U form. Note that a damping increment leads to a faster convergence of the stationary solution. The reactions at end points are , and the maximum deflection (0.715 m) is reached at m.
|
| Figure 4: Validation of the non-linear FEM mooring model. Case 1: cable under its self weight. |
|
| Figure 5: Validation of the non-linear FEM mooring model. Case 1: different stages of time evolution of cable under its self weight. |
The Ms Excel file below includes the results of the time evolution of the cable under its self weight (corresponding to Figure 5).
Case_1.xlsx
Case 2: Free vibration cable
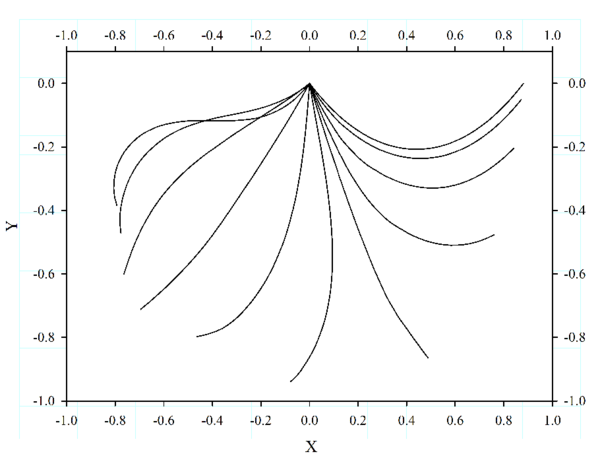
The second case is based on that proposed by [48]. The experiment consists of a cable initially in a horizontal position, and letting one end free and leaving the cable evolve under gravitational loads. The computed results are compared with the experimental results taken from [48], as well as with the data obtained from simulation with the FEM structural solver RamSeries (www.compassis.com). The properties of the cable are: length m, stiffness 50 N, weight per unit of length N/m, and m distance between the cable end points. The cable was divided into forty four bar elements, and the time step adopted was s. This time step must be low enough for obtaining an accurate description of the cable motion. The obtained numerical results show a good agreement between our results, and those experimentally and numerically obtained by other authors. The cable position at different times obtained from computed results can be observed in Fig. 6.
|
| Figure 6: Validation of the non-linear FEM mooring model. Case 2: different time step positions of free vibration cable obtained from computed results. |
![Validation of the non-linear FEM mooring model. Case 2: comparison between computed results of the path of free end of the cable obtained and experimental results of [48] and numerical computed with RamSeries.](/wd/images/thumb/1/13/Draft_Guti%C3%A9rrez_Romero_949540503-Fig_06.png/600px-Draft_Guti%C3%A9rrez_Romero_949540503-Fig_06.png)
|
| Figure 7: Validation of the non-linear FEM mooring model. Case 2: comparison between computed results of the path of free end of the cable obtained and experimental results of [48] and numerical computed with RamSeries. |
Slight differences can be appreciated at the lower end in Fig. 7. This fact can be explained by the different numerical parameters chosen to carry out the simulation.
The Ms Excel file below includes the results of the time evolution of the free vibration cable (corresponding to figures 6, 7).
Case_2.xlsx
Case 3: Cable attached to a circular rotating plate
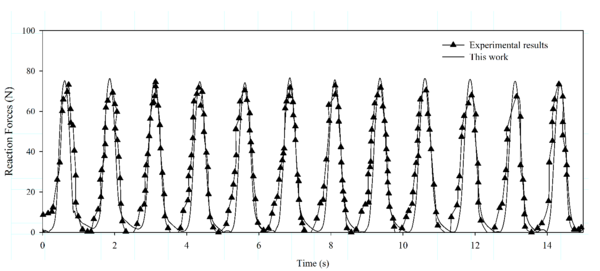
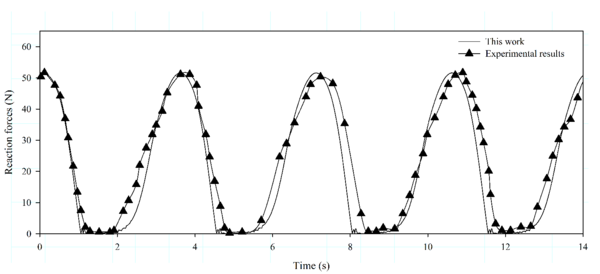
Now, results obtained by the developed FEM solver are compared for the model test proposed by Lindhal and Sjoberg [38,39]. The experimental set up is shown in Fig. 8. The lower end was attached to the concrete floor and the upper end was attached to a circular plate with a fixed rotation speed. The radius of the circular motion was m. Two cases with different rotational periods of = 1.25 s and s respectively, were investigated. The reaction forces at the top end of the cable are measured and compared with those computed by the proposed numerical model.
![Validation of the non-linear FEM mooring model. Case 3: the geometrical set-up of the experimental tests by [38].](/wd/images/thumb/9/9e/Draft_Guti%C3%A9rrez_Romero_949540503-Fig_07.png/842px-Draft_Guti%C3%A9rrez_Romero_949540503-Fig_07.png)
|
| Figure 8: Validation of the non-linear FEM mooring model. Case 3: the geometrical set-up of the experimental tests by [38]. |
|
| Figure 9: Validation of the non-linear FEM mooring model. Case 3: comparison between the experimental and numerical cable top end reaction forces. Rotational period = 3.5 s. |
The properties of the cable are: length m, stiffness N, weight per unit length N/m, and diameter m. In this validation case, the cable is discretized into 200 bar elements, and the time step adopted is s. The motion of the top end is defined by the following expressions (including an initialization period to build up the spinning of the plate):
|
The results are compared with the experimental results taken from [38]. A good agreement between the computed reaction forces and the experimental results [38] can be observed in Fig. 9 (for s), and 10 (for s) for both, the maximum values and the time evolution. Only slight differences are appreciated due to the uncertainty of the experimental data. The entire cable loses stiffness at some instants in time, and the numerical oscillations after the slack are larger in the case of the larger excitation frequency, as it was observed by [39].
|
| Figure 10: Validation of the nonl-inear FEM mooring model. Case 3: comparison between the experimental and numerical cable top end reaction forces. Rotational period = 1.25 s. |
The Ms Excel file below includes the results of the circular rotating plate case (corresponding to figures 9, 10).
Case_3.xlsx
6 Demonstration of the coupled seakeeping-mooring solver
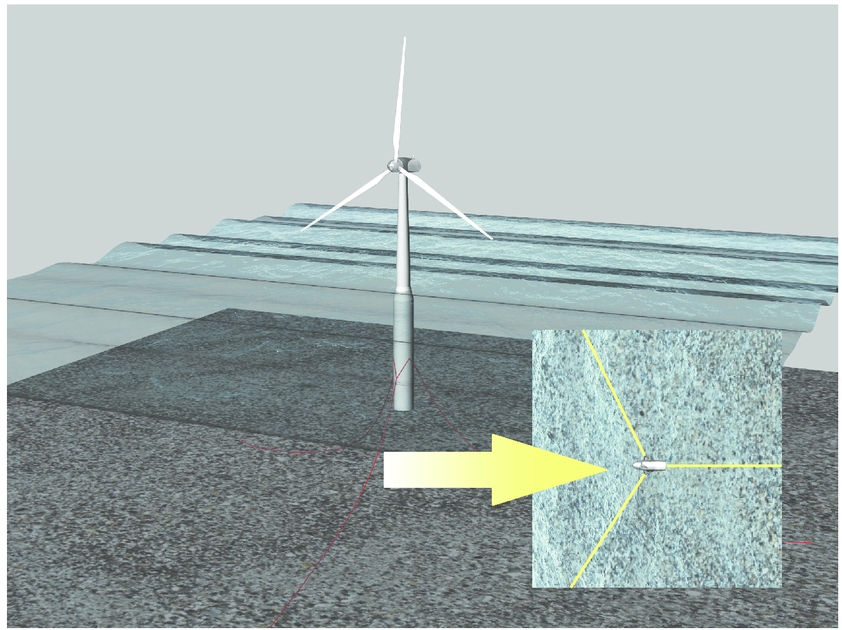
A fully coupled analysis of the OC3 spar buoy offshore wind turbine, called Hywind (www.ieawind.org/task23/) is presented next. Main particulars of the spar buoy FOWT are presented in [52,53]. A general view of the buoy concept can be observed in Fig. 11. In this section, several analysis are made:
|
| Figure 11: General view of the spar buoy wind turbine concept (OC3-Hywind concept). |
- The Response Amplitude Operator (RAO) are compared for a rigid wind turbine with no wind loads, with those obtained by other authors [49].
- The analysis of a spar wind turbine subjected to different monochromatic waves with periods close to the pitch resonance. The effects of the linear, the quasi-static, and the dynamic mooring models are compared.
- A simulation in real operational conditions of the spar FOWT OC3 is performed. First and second-order irregular waves, real wind flow, and mooring loads (with three different types of mooring models) are taken into account. The influence of the mooring type model, the effects of second-order wave, and mooring tensions are studied.
6.1 RAO analysis and comparison
First, a RAO analysis is performed in the absence of wind. The frequency results of the seakeeping solver are obtained after applying a Fourier transform to the time history generated. Figure 12 shows an inter-code comparison. Note that a good agreement among the different solvers is found [49].
![OC3-Hywind concept. Comparison between the computed result by SeaFEM with those taken from other authors [49] for a rigid wind turbine with no wind.](/wd/images/thumb/c/c8/Draft_Guti%C3%A9rrez_Romero_949540503-Fig_11.png/600px-Draft_Guti%C3%A9rrez_Romero_949540503-Fig_11.png)
|
| Figure 12: OC3-Hywind concept. Comparison between the computed result by SeaFEM with those taken from other authors [49] for a rigid wind turbine with no wind. |
The Ms Excel file below includes the RAO curves obtained in the present work and the data from HydroDyn and WAMIT used as reference (see Figure 12).
RAOS.xlsx
6.2 Mooring analysis around pitch resonance
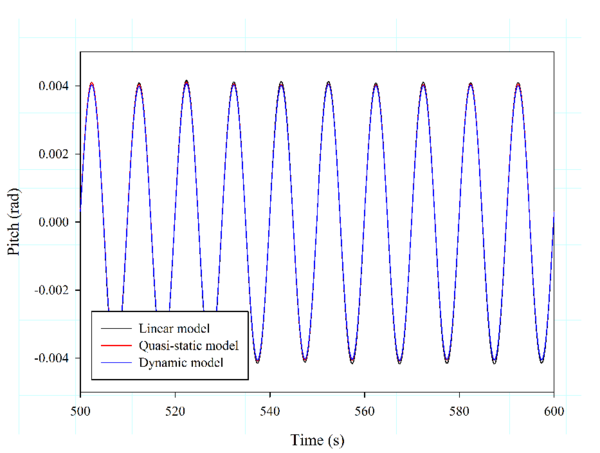
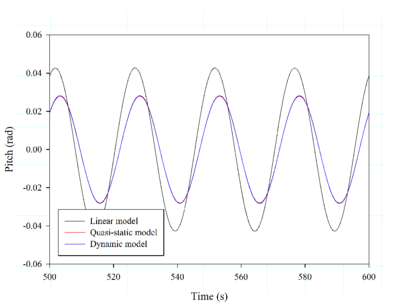
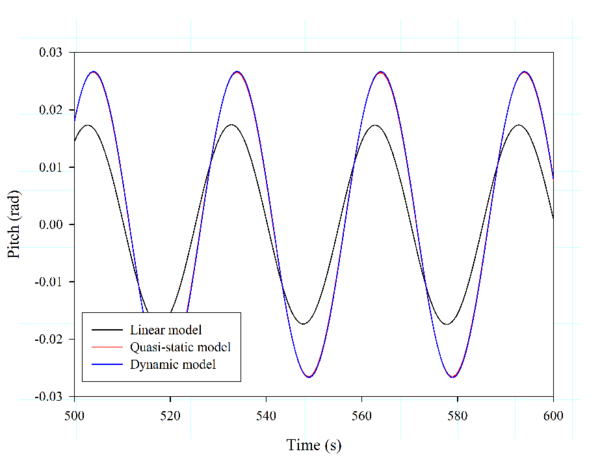
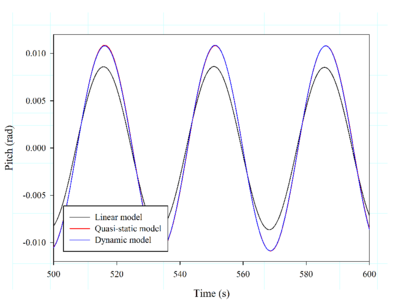
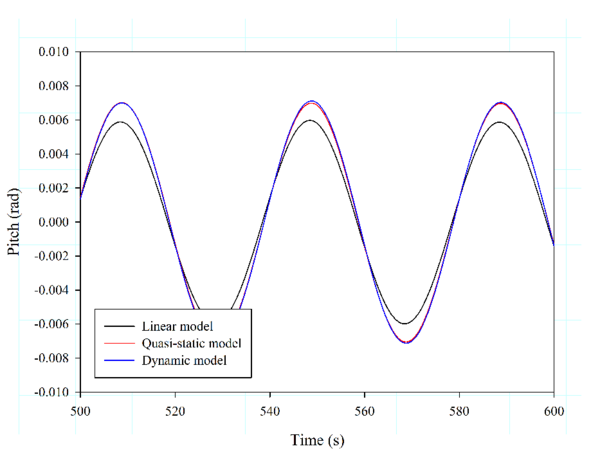
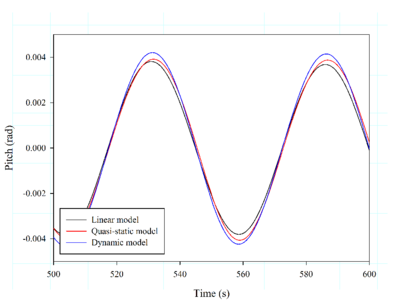
Below, the influence of three different mooring models on the OC3 spar buoy FOWT is analysed. These models are: the linear model cable (that behaves as springs and is represented by a linearised mooring matrix [53]); the Quasi-Static model, similar to the one presented in [54]; and the dynamic model developed in this work. Six first-order monochromatic waves are used in the analysis. Key parameters of the mooring layout and cable properties can be found in Table 1. Fig. 13 compares the pitch motion for each mooring model.
| Item | Value | Unit |
| Wave Amplitude | 1.0 | m |
| Wave Period analysed | 10; 25; 20; 35; 40; 55 | s |
| Number of Mooring Lines | 3 | |
| Angle Between Adjacent Lines | 120 | deg |
| Depth to Anchors Below SWL | 320 | m |
| Depth to Fairleads Below SWL | 70 | m |
| Radius to Fairleads from Platform Centerline | 853.9 | m |
| Unstretched Mooring Line Length | 902.2 | m |
| Mooring Line Diameter | 0.9 | m |
| Mooring Line Mass Density | 77.71 | kg/m |
| Mooring Line Extensional Stiffness | 3.8410 | N |
It can be observed that there are big differences in the results in those cases close to the pitch resonance (about 30 s), while the results are quite similar for the cases with 10 s and 55 s. These results suggest that the use of simpler mooring models can lead to big errors near the resonance frequency, and as a consequence to magnify safety factors, contributing to increase the cost of the FOWT.
6.3 Simulation in operational conditions
Finally, four analyses of the OC3 spar buoy in operational conditions are presented. The different analyses are carried out in similar environmental conditions, but using first and second-order irregular waves. Furthermore, additional studies including Quasi-Static and dynamic mooring models are performed. The goal of these analyses is to evaluate the effects of the mooring model and the wave order on the dynamics of the system, as well as to estimate the tension in the mooring lines. On the one hand, the wind turbine system is assumed to be operating at an average wind speed of 11.4 m/s, which generates the maximum thrust and torque. FASTLognoter [50,51] has been used to linearise with FAST [50] the behaviour of the wind turbine around the operating wind speed. Restoration and damping matrices resulting from the linearisation of the wind turbine system are included into the global dynamics. It should be remarked that the rotational and periodicity effects are considered in the calculation of the steady state matrix. On the other hand, the wind loads are estimated considering non-uniform wind flow, with an average wind speed of 11.4 m/s. The wind flow profile is obtained using Turbsim [55], and the wind loads on the wind turbine are obtained from FAST/AeroDyn [50].
| Case 1 | Case 2 | Case 3 | Case 4 | |||
| Average Wind velocity | (m/s) | 11.4 | 11.4 | 11.4 | 11.4 | |
| Wind direction | (deg) | 0.0 | 0.0 | 0.0 | 0.0 | |
| Wave Spectrum | (-) | JONSWAP 1 | JONSWAP 1 | JONSWAP 2 | JONSWAP 2 | |
| Significant wave height | (m) | 6.0 | 6.0 | 6.0 | 6.0 | |
| Peak period | (s) | 12.0 | 12.0 | 12.0 | 12.0 | |
| Mean wave direction | (deg) | 0 | 0 | 0 | 0 | |
| Mooring model | (-) | Quasi-static | Nonlinear | Quasi-static | Nonlinear | |
| Number of mooring lines | (-) | 3 | 3 | 3 | 3 | |
| Mooring lines elements | (-) | 200 | 200 | 50 | 200 |
A JONSWAP spectrum with a mean wave period = 12.0 s, and significant wave height = 6.0 m, is simulated. The key parameters of the different case studies are presented in Table 2. As stated above, two different types of mooring models are analysed; one based on the Quasi-Static catenary model [54], and the other based on the dynamic (NFEM) cable model, presented in this work. For the dynamic cable analysis each mooring line is divided into 200 bar elements.
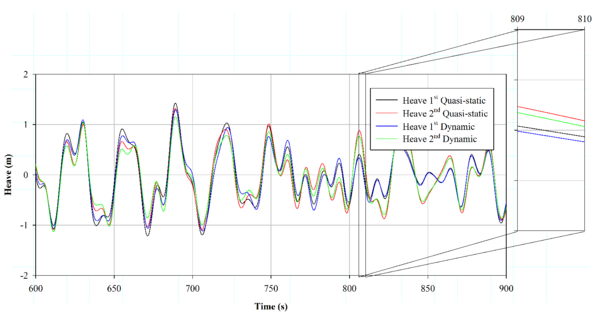
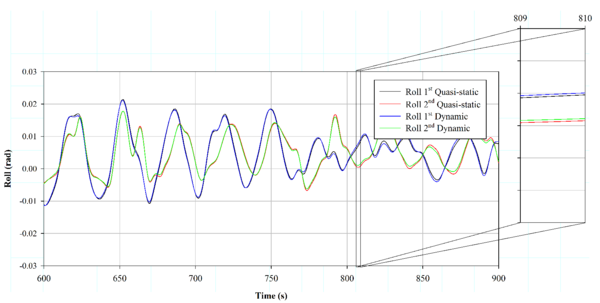
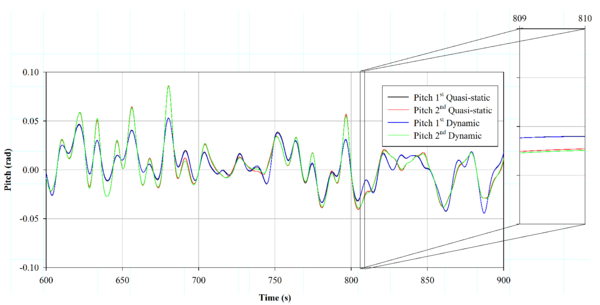
Figures 14, 15 and 16 show the computed heave, roll and pitch motions from 600 s to 900 s of simulation time. Noticeable differences are found between the first and the second-order movements, while the QS and NFEM mooring models offer quite similar results.
|
|
|
|
|
|
| Figure 13: Results obtained for mooring analysis around pitch resonance of OC3-Hywind. | |
Table 3 shows the mean and RMS values, as well as the motion amplitude for the first and second-order movements. When comparing the QS and the NFEM models, only slight differences are observed. In particular, the second-order pitch motion is higher when using the NFEM model, compared to the QS model, while the other values remain with similar trends for both models.
| Case 1 | ||||||
| Surge (m) | Sway (m) | Heave (m) | Roll (deg) | Pitch (deg) | Yaw (deg) | |
| Mean 1 | 0.04 | 0.00 | 0.00 | 0.29 | 0.41 | 0.21 |
| Mean 1 | 0.04 | 0.00 | 0.00 | 0.29 | 0.41 | 0.21 |
| Amplitude 1 | 14.96 | 1.34 | 2.75 | 1.91 | 6.12 | 10.38 |
| Amplitude 2 | 14.96 | 1.34 | 2.75 | 1.91 | 6.12 | 10.38 |
| RMS 1 | 2.76 | 0.21 | 0.53 | 0.52 | 1.09 | 1.92 |
| RMS 2 | 2.73 | 0.24 | 0.45 | 0.48 | 1.22 | 1.91 |
| Case 2 | ||||||
| Surge (m) | Sway (m) | Heave (m) | Roll (deg) | Pitch (deg) | Yaw (deg) | |
| Mean 1 | 0.00 | 0.00 | -0.01 | 0.29 | 0.40 | 0.21 |
| Mean 1 | 0.10 | 0.00 | -0.03 | 0.30 | 0.42 | 0.28 |
| Amplitude 1 | 13.82 | 1.12 | 2.61 | 1.92 | 6.03 | 10.31 |
| Amplitude 2 | 15.19 | 1.55 | 2.59 | 2.02 | 8.00 | 10.83 |
| RMS 1 | 2.54 | 0.18 | 0.50 | 0.52 | 1.09 | 1.92 |
| RMS 2 | 2.73 | 0.24 | 0.45 | 0.48 | 1.22 | 1.91 |
Next, a video of the analysis case 1 is presented.
| Video 1. OC3 spar buoy wind turbine simulation (analysis case 1). |
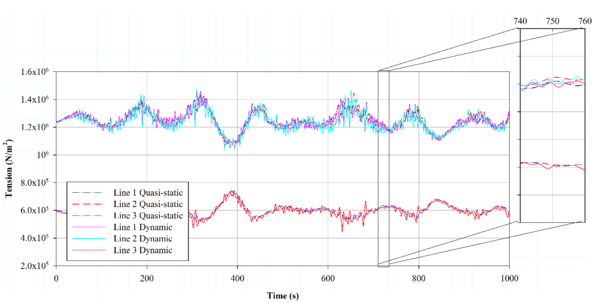
Figure 17 shows the tension for each mooring line at the fairlead point. The NFEM model recorded larger amplitude oscillations (in the range of 5 s to 10 s period) compared with QS model. The differences observed in Fig. 17 in the tension amplitude reach up to 24 . This fact suggests that using a QS model for fatigue assessment of the mooring lines could overestimate their fatigue life.
|
| Figure 14: Comparison between heave motion for first and second-order wave environment for Case 1-4 (described in Table 2). |
|
| Figure 15: Comparison between roll motion for first and second-order wave environment for Case 1-4 (described in Table 2). |
|
| Figure 16: Comparison between pitch motion for first and second-order wave environment for Case 1-4 (described in Table 2). |
|
| Figure 17: Comparison of fairlead tension of each mooring line for Case 3, and 4. |
Table 4 compares the maximum, minimum, average, and RMS tension values at the fairlead points, obtaining similar values for both mooring models. Furthermore, based on Figure 17, the second-order simulation provided larger tension values than the first-order. This result suggests that a first-order approximation can underestimate the fatigue loads and might lead to a wrong mooring design.
| Line | Case | Max. (N) | Min. (N) | Mean (N) | RMS (N) |
| Line 1 | 1 | 1.43510 | 1.07310 | 1.25010 | 1.25210 |
| Line 2 | 1 | 1.44610 | 1.07210 | 1.24010 | 1.24210 |
| Line 3 | 1 | 7.41110 | 5.20910 | 5.99110 | 6.00310 |
| Line 1 | 2 | 1.45710 | 1.05210 | 1.24610 | 1.24810 |
| Line 2 | 2 | 1.47110 | 1.04010 | 1.23610 | 1.23810 |
| Line 3 | 2 | 7.42110 | 4.51010 | 5.92310 | 5.93610 |
It is emphasized that the NFEM mooring model allows to consider non-linear dynamic effects which cannot be taken into account by QS models. However, in deep water, the dynamics of catenary mooring lines are negligible as reported in Low.
7 Conclusions
A FEM coupled seakeeping and mooring model for the analysis of floating wind turbines is presented. Based on the results obtained in this work, the following conclusions are made:
- A second-order time-domain seakeeping model based on FEM and capable of using unstructured meshes [28,30,31] is successfully applied to simulate floating wind turbines.
- A dynamic cable model based on Non-linear FEM is presented. A Lagrangian formulation is used to describe the dynamics of the mooring line. Several non-linear effects are considered, such as seabed interaction and drag forces. In order to accelerate the body dynamics convergence, the restoring mooring forces on the floating structure are linearised for each iteration within each time step. Therefore, a stiffness matrix has to be evaluated for each iteration.
- An algorithm is developed to couple the non-linear cable dynamics with the body dynamics solver within the time-domain seakeeping solver [28].
- The dynamic cable model presented in this work is validated against several experimental results, obtaining a good agreement between the numerical and experimental ones.
- Different analyses of a FOWT based on the Hywind concept [52,53] are performed. RAO curves are compared with those obtained by other authors, showing a good agreement. Moreover, a comparison among the linear, the QS, and the NFEM models are carried out for frequencies around pitch resonance, obtaining large differences among mooring models.
- The Hywind FOWT is analysed under a realistic operational condition. Second-order coupled simulations are carried out considering a real wind profile, and with two types of mooring models; the QS and the NFEM. Results from both cases are compared. The NFEM mooring model combined with second-order waves and real wind provides a realistic simulation of the performance of the floating wind turbine. The comparison suggests that using a QS model for fatigue assessment of the mooring lines could overestimate their fatigue life. Furthermore, first-order approximation can underestimate tension values on the mooring systems.
References
[1] Breton SP, Moe H. Status, plans and technologies for offshore wind turbines in Europe and North America. Renew Energy. 2009;34:646–54.
[2] Karimirad M, Meissonnier Q, Gao Z, Moan T. Hydroelastic code-to-code comparison for a tension leg spar-type floating wind turbine. Marine Struct. 2010;24:412–435.
[3] Jeon SH, Cho YU, Seo MW, Cho JR, Jeong WB. Dynamic response of floating substructure of spar-type offshore wind turbine with catenary mooring cables. Ocean Eng. 2013;72:356–364.
[4] Sclavounos P, Butterfield S, Musial W, Jonkman JM. Engineering challenges for floating offshore wind turbines. In Proc: Copenhagen Offshore Wind Conference, 2005.
[5] Cordle A, Jonkman JM. State of the art in floating wind turbine design tools. In Proc: 21st International Offshore and Polar Engineering Conference (ISOPE 2011). 2011.
[6] Matha D, Schlif M, Cordle A, Pereira R, Jonkman JM. Challenges in simulation of aerodynamics, hydrodynamics, and mooring-line dynamics of floating offshore wind turbines. In Proc: 21st International Offshore and Polar Engineering Conference (ISOPE 2011), 2011.
[7] Jacob PB, Bahiense RA, Correa FN, Jacovazzo BM. Parallel implementations of coupled formulations for the analysis of floating production systems, part I: Coupling formulations. Ocean Eng. 2012;55:206–218.
[8] Jacob PB, Franco LD, Rodrigues MV, Correa FN, Jacovazzo BM. Parallel implementations of coupled formulations for the analysis of floating production systems, part II: Domain decomposition strategies. Ocean Eng. 2012;55:219–234.
[9] Bae YH, Kim MH. Rotor-floater-theter coupled dynamics including second-order sum-frequency wave loads for a mono-column-TLP-type FOWT (Floating Offshore Wind Turbine). Ocean Eng. 2013;61:109–122.
[10] Bachinsky EE, Moan T. Design considerations for tension leg platform wind turbines. Marine Struc. 2012;29:89–114.
[11] Low YM, Langley RS. Time and frequency domain coupled analysis of deep-water floating production systems. Appl. Ocean Res. 2006;28:371–385.
[12] Paulling JR, Webster WC. Large-amplitude analysis of the coupled response of a TLP and tendon system. In Proc: International Conference on Ocean, Offshore and Arctic Engineering (OMAE'86). 1986, p. 86.
[13] Sircar S, Kleinhans JW, Prasad J.Impact of coupled analysis on global performance of deep-water TLP's. In Proc: Offshore Technology Conference (OTC 1993), 1993. Paper No. 7145.
[14] Schott WE, Rodenbusch G, Mercier RS, Webb CM. Global Design and Analysis of the Auger Tension Leg Platform. In Proc: of the Offshore Technology Conference (OTC 1994), Paper No. 7621, 1994. p. 541–552.
[15] Hong SY, Hong S. Motion simulation of a floating structure coupled with mooring lines. ISOPE 1996. In Proc: Sixth International Offshore and Polar Engineering Conference (ISOPE 1996). 1996.
[16] Jacob BP, Masetti IQ. PROSIM Program:Coupled Numerical Simulation of the Behavior of Moored Floating Units (in Portuguese). LAMCSO/COPPE-Petrobras Internal Report. 1998.
[17] Kim S, Sclavounos P. Fully coupled response simulations of theme offshore structures in water depths to up to 10,000 feet. In Proc: 11th International Offshore and Polar Engineering Conference (ISOPE 2001). 2001.
[18] Senra SF, Correa FN, Jacob BP, Mourelle MM, Masetti IQ. Towards the integration of analysis and design of mooring systems and risers, part I: studies on a semisubmersible platform. In Proc: 21st International Conference on Offshore Mechanics and Arctic Engineering (OMAE 2002). 2002.
[19] Karimirad M, Moan T. A simplified method for coupled analysis of floating offshore wind turbines. Marine Struc. 2012;27:45–63.
[20] Jonkman JM, Sclavounos P. Development a fully coupled aeroelastic and hydrodynamic models for offshore wind turbines. ASME 2006 Wind Engineering Symposium. 2006.
[21] Kim BW, Sung G, Kim JA, Hong SY. Comparison of linear spring and nonlinear FEM methods in dynamic coupled analysis of floating structure and mooring system. J. Fluid Struct. 2013;42:205–227.
[22] Tahar A, Kim MH. Coupled-dynamic analysis of floating structures with polyester mooring lines. Ocean Eng. 2008;35:1676–1685.
[23] Kim BW, Sung HG, Hong SY, Jung HJ. Finite element non linear analysis for catenary structure considering elastic deformation. Comput. Modeling Eng. Sci. 2010;63:29–45.
[24] Yang M, Teg B, Ning D, Shi Z. Coupled dynamic analysis for wave interaction with a truss spar and its mooring line/riser system in time domain. Ocean Eng. 2012;39:72–87.
[25] Cunff CL, Heurtier J-M, Piriou L, Berhault C, Perdrizet T, Teixeira D, Ferrer G, Gilloteaux J-C. Fully coupled floating wind turbine simulator based on nonlinear finite element method: Part I - Methodology. In Proc: ASME 32th International Conference on Ocean, Offshore and Arctic Engineering. 2013.
[26] Perdrizet T, Gilloteaux J-C, Teixeira D, Ferrer G, Piriou L, Cadiou D, Heurtier J-M, Cunff CL. Coupled floating wind turbine simulator based on nonlinear finite element method: Part II - Validation results. In Proc: ASME 32th International Conference on Ocean, Offshore and Arctic Engineering. 2013.
[27] Kvittem MI, Moan T. Time domain analysis procedures for fatigue assessment of a semi-submersible wind turbine. Marine Struc. 2015:40;38–59.
[28] Compassis. SeaFEM Theory Manual. Retrieved from www.compassis.com/soporte. 2014.
[29] Low YM. Prediction of extreme responses of floating structures using a hybrid time/frequency domain coupled analysis approach. Ocean Eng. 2008;35:1416–1428.
[30] Serván B, García-Espinosa J. Accelerated 3D multi-body seakeeping simulations using unstructured finite elements. J. Compu. Phys. 2013;252:382–403.
[31] García-Espinosa J, Di-Capua D, Ubach, PA, Oñate E. A FEM fluid-structure interaction algorithm for analysis of the seal dynamics of a Surface-Effect Ship. Accepted for publication in Comp. Meth. in App. Mech. and Eng.2015.
[32] ABS. Floating Wind Turbines. American Bureau of Shipping. Bureau of Safety and Environmental Enforcement. Retrieved from http://www.offshorewindhub.org/. 2012.
[33] Hong SY, Nam B-W. Analysis of second-order wave force of floating bodies using FEM in time-domain. In Proc: 21th International Offshore and Polar Engineering Conference (ISOPE 2010). 2010.
[34] Aamo OM, Fossen TI. Finite element modelling of mooring lines. Math. Comput. Simul. 2000;53:415–422.
[35] Gobat J, Grosenbaugh M. 2006. Time-domain numerical simulation of ocean cable structures. Ocean Eng. 2006;33:1373–1400.
[36] Morison JR, O'Brien MP, Johnson JW, Schaaf SA. The force exerted by surface wave on piles. Journal of Petroleum Transaction 1950;189:149–54.
[37] Orcina Ltd. Orcaflex manual-version 9.8a. Retrieved from www.orcina.com. 2014.
[38] Lindahl L, Sjoberg A. Dynamic analysis of mooring cables. In Proc: 2nd International symposium on ocean engineering and ship handling. 1983. pp. 281–319.
[39] Palm J, Paredes GM, Eskilsson C, Pinto FT, Bergahl L. Simulation of mooring cable dynamics using a discontinuous Galerkin Method. In Proc: of the V International Conference on Computational Methods in Marine Engineering (MARINE 2013). 2013.
[40] Rodrigues MV, Correa FN, Jacob PB. Implicit domain decomposition methods for coupled analysis of offshore platforms. Commun. Numer. Meth. Engng. 2007;23:599–621.
[41] Felippa CA. Nonlinear Finite Element Method, Department of Aerospace Engineering Sciences. University of Colorado at Boulder. 2014.
[42] Bathe KH. Finite element procedures. Prentice Hall. 1996.
[43] Wood W, Bossak M, Zienkiewicz O. An alpha modification of Newmark's method. Int. J. Num. Meth. Engng. 1980;1:1562–1566.
[44] Thai H, Kim SE. Nonlinear static and dynamic analysis of cable structures. Fin. Elem. Analysis Design. 2011;47:237–246.
[45] Irons BM, Tuck RC. A version of the Aitken accelerator for computer iteration. International J. Num. Meth. Engng. 1969;1:275–277.
[46] Cummins W. The impulse response function and ship motions. Symposium on Ship Theory 1962. Institut fur Schiffbauder Universitat. 1962.
[47] Ortigosa I, Development of a decision support system for the design and adjustment of sailboat rigging. PhD Thesis, Universitat Politécnica de Catalunya, Spain. 2011.
[48] Lazzari M, Saetta AV, Vitaliani RV. Nonlinear dynamic analysis of cable-suspended structures subjected to wind actions. Comput. Struct. 2001;79:953–969.
[49] Ramanchandran GCV, Robertson A, Jonkman JM, Masciola MD. Investigation of Response Amplitude Operators for Floating Offshore Wind Turbines. In Proc: 23rd International Ocean, Offshore and Polar Engineering Conference (ISOPE 2013). 2013.
[50] Jonkman JM, Buhl Jr ML. FAST's Users Guide. Technical Report NREL/EL-500-38230. National Renewable Energy Laboratory, www.nrel.gov, Colorado (USA). 2005.
[51] Gutiérrez-Romero JE, Zamora B, García–Espinosa J. Peyrau R. Tool development based on FAST for performing design optimization of offshore wind turbines: FASTLognoter. Renew. Energy. 2013;55:69–78.
[52] Jonkman JM, Butterfield S, Musial W, Scott G. Definition of a 5-MW reference wind turbine for offshore system development. Technical Report NREL/TP-500-38060. National Renewable Energy Laboratory, www.nrel.gov, Colorado (USA). 2009.
[53] Jonkman JM. Definition of the floating system for Phase IV of OC3. Technical Report NREL/TP-500-47535. National Renewable Energy Laboratory, www.nrel.gov, Colorado (USA). 2010.
[54] Jonkman JM. Dynamics Modeling and Loads Analysis of an Offshore Floating Wind Turbine. Technical Report NREL/TP-500-41958. National Renewable Energy Laboratory, www.nrel.gov, Colorado (USA). 2007.
[55] Jonkman BJ, Kilcher, L.Turbsim User's Guide. Version 1.06.00. Technical Report NREL/TP-xxx-xxxxx. National Renewable Energy Laboratory, www.nrel.gov, Colorado (USA). 2012.
Document information
Published on 01/01/2016
DOI: 10.1016/j.marstruc.2016.05.002
Licence: CC BY-NC-SA license
Share this document
Keywords
claim authorship
Are you one of the authors of this document?