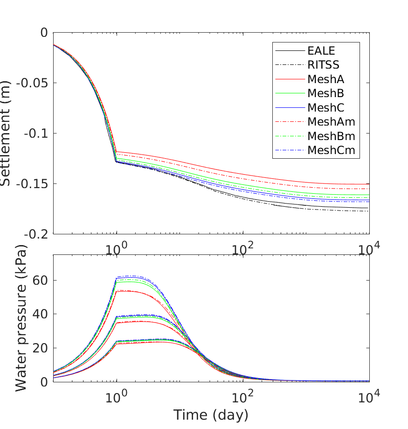
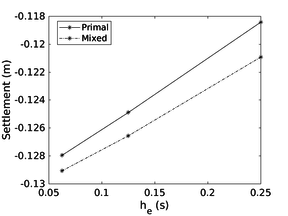
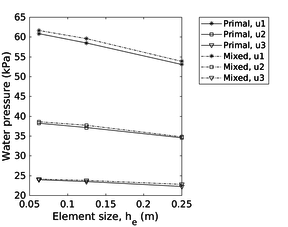
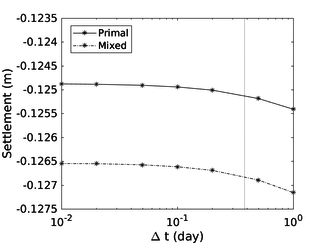
m (Scipediacontent moved page Draft Content 325409517 to Monforte et al 2019a) |
|||
| (5 intermediate revisions by one other user not shown) | |||
| Line 21: | Line 21: | ||
The last analysis of this work is the hydro-mechanical simulation of the cone penetration test in a Modified Cam Clay soil. A parametric analysis covers the effect of the permeability of the soil -from drained to undrained conditions- and the interface friction angle. The effect of these parameters on the cone resistance, sleeve friction and pore pressure at three potential measurement points is fully characterized. These numerical results are used to assess several techniques to estimate the permeability of soils from CPTu testing. Special attention is paid to on-the-fly techniques, in which permeability could be directly estimated from the CPTu data stream without the need for any stoppage. | The last analysis of this work is the hydro-mechanical simulation of the cone penetration test in a Modified Cam Clay soil. A parametric analysis covers the effect of the permeability of the soil -from drained to undrained conditions- and the interface friction angle. The effect of these parameters on the cone resistance, sleeve friction and pore pressure at three potential measurement points is fully characterized. These numerical results are used to assess several techniques to estimate the permeability of soils from CPTu testing. Special attention is paid to on-the-fly techniques, in which permeability could be directly estimated from the CPTu data stream without the need for any stoppage. | ||
| − | == | + | ==Preface== |
This monograph is a revised version of the doctoral dissertation of the first author, entitled ''Insertion Problems in Geomechanics with the Particle Finite Element Method''. The thesis was defended on November 5th 2018 in Barcelona. The research was conducted under the supervision of Professors M. Arroyo, J. M. Carbonell and A. Gens. | This monograph is a revised version of the doctoral dissertation of the first author, entitled ''Insertion Problems in Geomechanics with the Particle Finite Element Method''. The thesis was defended on November 5th 2018 in Barcelona. The research was conducted under the supervision of Professors M. Arroyo, J. M. Carbonell and A. Gens. | ||
| Line 149: | Line 149: | ||
The Particle Finite Element Method (PFEM) is a numerical method well suited for mechanical problems involving large displacements, large deformations, intermittent separation and/or fusion of bodies. Soft porous materials, such as soils, suffer these kinds of mechanical transformations during many activities of engineering interest. Relevant examples for the case of soils include probing, sampling, pile installation, excavation and ploughing. | The Particle Finite Element Method (PFEM) is a numerical method well suited for mechanical problems involving large displacements, large deformations, intermittent separation and/or fusion of bodies. Soft porous materials, such as soils, suffer these kinds of mechanical transformations during many activities of engineering interest. Relevant examples for the case of soils include probing, sampling, pile installation, excavation and ploughing. | ||
| − | PFEM originated to address problems of fluid mechanics <span id='citeF-24'></span><span id='citeF-25'></span><span id='citeF-26'></span><span id='citeF-27'></span><span id='citeF-28'></span>[[#cite-24|[24,25,26,27,28]]], including those of fluid interaction with rigid bodies. Later it was extended to deformable single-phase solids <span id='citeF-29'></span><span id='citeF-44'></span>[[#cite-29|[29,44]]] and to the contact between multiple deformable bodies in thermo-plastic problems [30,40,41]. Subsequently, several PFEM extensions have addressed geomaterials: <span id='citeF-32'></span><span id='citeF-33'></span>[[#cite-32|[32,33]]] used PFEM to simulate ground excavation problems. The interaction between soil and structures has been also simulated using hypoplastic formulations to describe the constitutive behavior of soft soils <span id='citeF-45'></span>[[#cite-45|[45]]]. Flow-like landslides have been also studied using PFEM, but considering a single-phase material description: <span id='citeF-36'></span>[[#cite-36|[36]]] employed a rigid plastic constitutive response for the soil whereas <span id='citeF-31'></span>[[#cite-31|[31]]] used a non-Newtonian modified Bingham law. <span id='citeF-46'></span>[[#cite-46|[46]]] presented a strategy to simulate the free surface flow over and throughout a rockfill; PFEM is adopted for the evaluation of the structural response, whereas an Eulerian fixed-mesh approach is employed for the fluid. | + | PFEM originated to address problems of fluid mechanics <span id='citeF-24'></span><span id='citeF-25'></span><span id='citeF-26'></span><span id='citeF-27'></span><span id='citeF-28'></span>[[#cite-24|[24,25,26,27,28]]], including those of fluid interaction with rigid bodies. Later it was extended to deformable single-phase solids <span id='citeF-29'></span><span id='citeF-44'></span>[[#cite-29|[29,44]]] and to the contact between multiple deformable bodies in thermo-plastic problems [30,40,41]. Subsequently, several PFEM extensions have addressed geomaterials: Carbonell et al. <span id='citeF-32'></span><span id='citeF-33'></span>[[#cite-32|[32,33]]] used PFEM to simulate ground excavation problems. The interaction between soil and structures has been also simulated using hypoplastic formulations to describe the constitutive behavior of soft soils <span id='citeF-45'></span>[[#cite-45|[45]]]. Flow-like landslides have been also studied using PFEM, but considering a single-phase material description: <span id='citeF-36'></span>[[#cite-36|[36]]] employed a rigid plastic constitutive response for the soil whereas <span id='citeF-31'></span>[[#cite-31|[31]]] used a non-Newtonian modified Bingham law. Larese et al. <span id='citeF-46'></span>[[#cite-46|[46]]] presented a strategy to simulate the free surface flow over and throughout a rockfill; PFEM is adopted for the evaluation of the structural response, whereas an Eulerian fixed-mesh approach is employed for the fluid. |
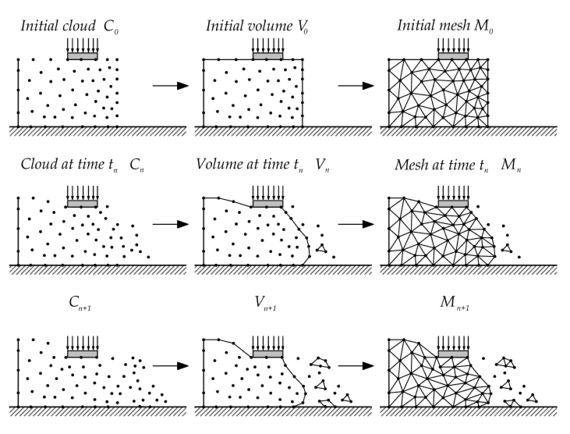
In PFEM the continuum is modelled using an Updated Lagrangian formulation; that is, a Lagrangian description of the motion is used and all variables are referred to the last known configuration. A mesh discretization of the domain is generated in order to solve the governing equations in the standard FEM fashion. Nodes in that mesh are treated as material particles whose motion is tracked during the solution. | In PFEM the continuum is modelled using an Updated Lagrangian formulation; that is, a Lagrangian description of the motion is used and all variables are referred to the last known configuration. A mesh discretization of the domain is generated in order to solve the governing equations in the standard FEM fashion. Nodes in that mesh are treated as material particles whose motion is tracked during the solution. | ||
| Line 7,437: | Line 7,437: | ||
|} | |} | ||
| − | <span id='citeF-137'></span>[[#cite-137|[137]]] evidenced that the deformations that suffer the soil that enters the sampler depend on the sampler geometry, the pushing method and the material. <span id='citeF-137'></span>[[#cite-137|[137]]] proposed several dimensionless descriptors to characterize the geometry of tubes (see Figure [[#img-61|61]]): (i) the area ratio, the ratio between the projected cutting shoe area to the internal area, (ii) the inside clearance ratio, that measures the relative increase of the diameter inside of the tube, and (iii) the outside clearance ratio, that accounts for the difference between the external diameter of the cutting shoe and the outside diameter of the sample tube. For simpler sampler geometries (round-tipped samplers with null inside and outside clearance angles), <span id='citeF-138'></span>[[#cite-138|[138]]] proposed to work in terms of the ratio between the outer diameter to the wall thickness, <math display="inline">B/t</math>, rather than the area ratio. Samplers are also characterized by the angles of the cutting shoe; particularly, the inside and outside cutting edge angles, <math display="inline">\alpha </math> and <math display="inline">\beta </math> in Figure [[#img-61|61]](a). | + | Hvorslev <span id='citeF-137'></span>[[#cite-137|[137]]] evidenced that the deformations that suffer the soil that enters the sampler depend on the sampler geometry, the pushing method and the material. <span id='citeF-137'></span>[[#cite-137|[137]]] proposed several dimensionless descriptors to characterize the geometry of tubes (see Figure [[#img-61|61]]): (i) the area ratio, the ratio between the projected cutting shoe area to the internal area, (ii) the inside clearance ratio, that measures the relative increase of the diameter inside of the tube, and (iii) the outside clearance ratio, that accounts for the difference between the external diameter of the cutting shoe and the outside diameter of the sample tube. For simpler sampler geometries (round-tipped samplers with null inside and outside clearance angles), Baligh et al. <span id='citeF-138'></span>[[#cite-138|[138]]] proposed to work in terms of the ratio between the outer diameter to the wall thickness, <math display="inline">B/t</math>, rather than the area ratio. Samplers are also characterized by the angles of the cutting shoe; particularly, the inside and outside cutting edge angles, <math display="inline">\alpha </math> and <math display="inline">\beta </math> in Figure [[#img-61|61]](a). |
It is generally accepted that sample disturbance decreases with smaller cutting area ratios and with sharper cutting edges <span id='citeF-141'></span><span id='citeF-142'></span><span id='citeF-143'></span>[[#cite-141|[141,142,143]]]. Meanwhile, a null internal clearance ratio has been traditionally associated to large disturbance of the sample due to the high frictional forces that develop in the internal shaft and, also, the formation of a plug <span id='citeF-137'></span>[[#cite-137|[137]]]. Non-zero internal clearance ratios may induce lateral expansion of the sample. This effect seems undesirable; however, it might significantly reduce the frictional forces that develop in the interior interface and, thus, reducing the susceptibility of the formation of a plug <span id='citeF-143'></span><span id='citeF-144'></span>[[#cite-143|[143,144]]]. | It is generally accepted that sample disturbance decreases with smaller cutting area ratios and with sharper cutting edges <span id='citeF-141'></span><span id='citeF-142'></span><span id='citeF-143'></span>[[#cite-141|[141,142,143]]]. Meanwhile, a null internal clearance ratio has been traditionally associated to large disturbance of the sample due to the high frictional forces that develop in the internal shaft and, also, the formation of a plug <span id='citeF-137'></span>[[#cite-137|[137]]]. Non-zero internal clearance ratios may induce lateral expansion of the sample. This effect seems undesirable; however, it might significantly reduce the frictional forces that develop in the interior interface and, thus, reducing the susceptibility of the formation of a plug <span id='citeF-143'></span><span id='citeF-144'></span>[[#cite-143|[143,144]]]. | ||
| Line 7,451: | Line 7,451: | ||
|} | |} | ||
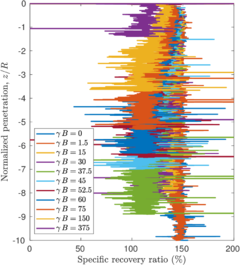
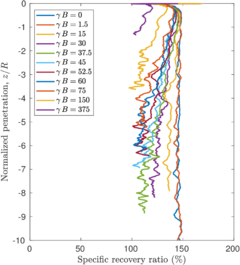
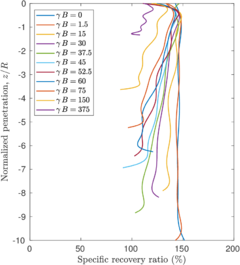
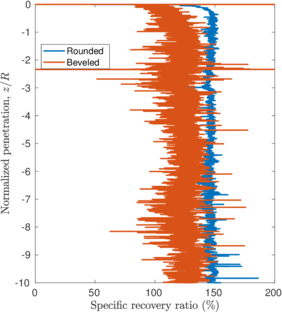
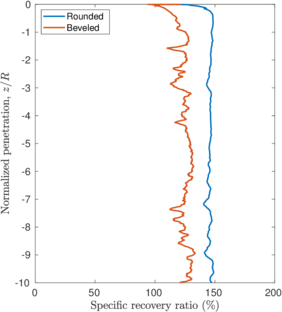
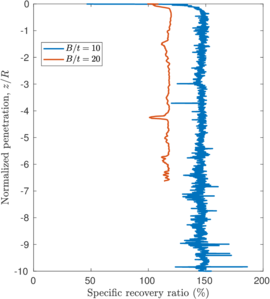
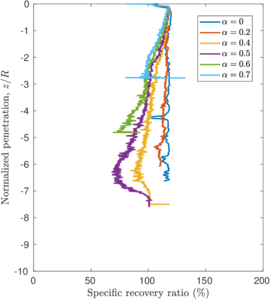
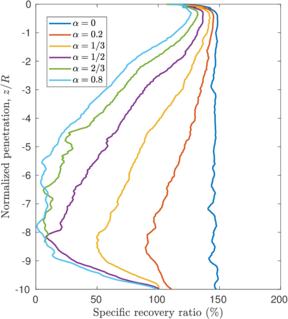
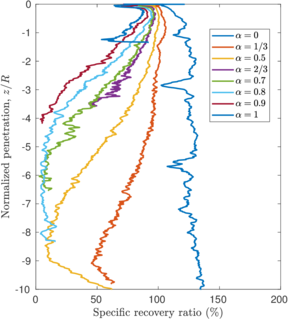
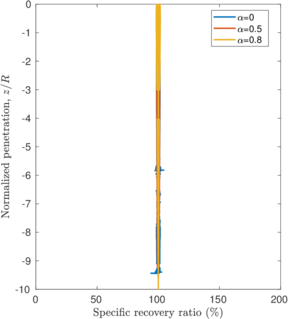
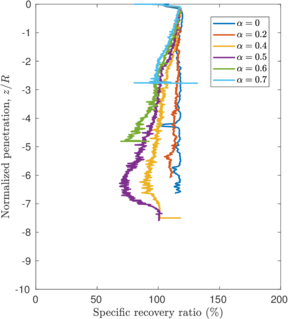
| − | <span id='citeF-137'></span>[[#cite-137|[137]]] proposed several physical descriptors based on sample recovery to characterize the soil disturbance. These metrics are presented in Figure [[#img-62|62]]; the total recovery ratio is defined as the length of recovered sample divided by the length of the tube whereas the specific recovery ratio is its continuous counterpart: how much soil enters the sampler per advance of the sampler. | + | Hvorslev <span id='citeF-137'></span>[[#cite-137|[137]]] proposed several physical descriptors based on sample recovery to characterize the soil disturbance. These metrics are presented in Figure [[#img-62|62]]; the total recovery ratio is defined as the length of recovered sample divided by the length of the tube whereas the specific recovery ratio is its continuous counterpart: how much soil enters the sampler per advance of the sampler. |
| − | <span id='citeF-137'></span>[[#cite-137|[137]]] stated that an undisturbed sample should have an specific recovery ratio similar to the unity. However, a total recovery ratio of 1 may be caused due to an expansion of part of the sample and contraction in the others; as such, the total recovery ratio might not be a good indicator for disturbance. | + | Hvorslev <span id='citeF-137'></span>[[#cite-137|[137]]] stated that an undisturbed sample should have an specific recovery ratio similar to the unity. However, a total recovery ratio of 1 may be caused due to an expansion of part of the sample and contraction in the others; as such, the total recovery ratio might not be a good indicator for disturbance. |
Although the specific recovery ratio delivers important information on the process; it is not used in the current practice due to the difficulty of its measurement. | Although the specific recovery ratio delivers important information on the process; it is not used in the current practice due to the difficulty of its measurement. | ||
| Line 7,459: | Line 7,459: | ||
===7.1.3 Strain history as a sampling disturbance measure=== | ===7.1.3 Strain history as a sampling disturbance measure=== | ||
| − | ==== | + | ====Strain Path Method==== |
<div id='img-63'></div> | <div id='img-63'></div> | ||
| Line 7,469: | Line 7,469: | ||
|} | |} | ||
| − | <span id='citeF-145'></span>[[#cite-145|[145]]] proposed the Strain Path Method (SPM) to study the strain response caused by the undrained, steady and deep penetration of rigid objects into clay materials. The main hypothesis of the method is that, due to the severe kinematic constraints that exist in this type of problems, the soil deformations and strains are independent of the shearing characteristics of the soil. The penetration problem may be idealized as that of an incompressible material that flows around the rigid, penetrating object. The stresses may be obtained from the strain paths through a constitutive model. Importantly, due to the hypotheses of the method, the contact between the soil and the structure is considered smooth <span id='citeF-141'></span>[[#cite-141|[141]]]. | + | Baligh <span id='citeF-145'></span>[[#cite-145|[145]]] proposed the Strain Path Method (SPM) to study the strain response caused by the undrained, steady and deep penetration of rigid objects into clay materials. The main hypothesis of the method is that, due to the severe kinematic constraints that exist in this type of problems, the soil deformations and strains are independent of the shearing characteristics of the soil. The penetration problem may be idealized as that of an incompressible material that flows around the rigid, penetrating object. The stresses may be obtained from the strain paths through a constitutive model. Importantly, due to the hypotheses of the method, the contact between the soil and the structure is considered smooth <span id='citeF-141'></span>[[#cite-141|[141]]]. |
| − | <span id='citeF-138'></span>[[#cite-138|[138]]] applied the strain path method to evaluate the strain path due to the sampling process. In the referred work, the strains due to the penetration of simple samplers -samplers with a curved tip characterized by the ratio between the outer diameter to wall thickness <math display="inline">B/t</math>- are reported. | + | Baligh et al. <span id='citeF-138'></span>[[#cite-138|[138]]] applied the strain path method to evaluate the strain path due to the sampling process. In the referred work, the strains due to the penetration of simple samplers -samplers with a curved tip characterized by the ratio between the outer diameter to wall thickness <math display="inline">B/t</math>- are reported. |
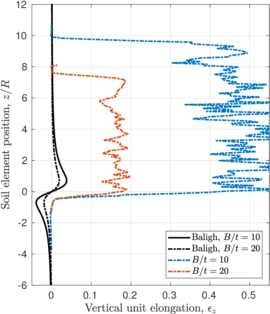
The examination of these strain contours reveals that there exist two different regions in the soil located inside the sampler: in the outer half inside of the tube, the strains of the soil are significant and non-uniform, leading to significant disturbance; whereas in the inner half inside of the tube soil suffer the least disturbance and strains are low and uniform, see Figure [[#img-63|63]]. Additionally, in the inner half of the sample, the vertical component of the strain is dominant, the radial and circumferential components are approximately equal and the tangential component is zero; that is: | The examination of these strain contours reveals that there exist two different regions in the soil located inside the sampler: in the outer half inside of the tube, the strains of the soil are significant and non-uniform, leading to significant disturbance; whereas in the inner half inside of the tube soil suffer the least disturbance and strains are low and uniform, see Figure [[#img-63|63]]. Additionally, in the inner half of the sample, the vertical component of the strain is dominant, the radial and circumferential components are approximately equal and the tangential component is zero; that is: | ||
| Line 7,520: | Line 7,520: | ||
A more detailed parametric analysis assessing the influence of the area ratio, cutting-edge angles and inside clearance was performed by <span id='citeF-139'></span>[[#cite-139|[139]]] by means of a Strain Path method implemented via a finite element approach. In particular, the authors analyzed the effect of the area ratio, the cutting-edge angle and inside clearance on the sample disturbance, evaluated on the basis of the strains imposed on the center-line of the soil sample. | A more detailed parametric analysis assessing the influence of the area ratio, cutting-edge angles and inside clearance was performed by <span id='citeF-139'></span>[[#cite-139|[139]]] by means of a Strain Path method implemented via a finite element approach. In particular, the authors analyzed the effect of the area ratio, the cutting-edge angle and inside clearance on the sample disturbance, evaluated on the basis of the strains imposed on the center-line of the soil sample. | ||
| − | ==== | + | ====Shallow Strain Path Method==== |
| − | <span id='citeF-146'></span>[[#cite-146|[146]]] developed an extension of the Strain Path method, the Shallow Strain Path method (SSPM), to explicitly include the effects of the stress free ground surface. The authors concluded that shallow penetrations cause a heave at the ground surface, while settlements only occur in the region around the tip and in a thin region of material adjacent to the shaft of the penetrometer. At large penetrations, settlements only occur at all points below the tip of the tube. | + | Sagaseta et al. <span id='citeF-146'></span>[[#cite-146|[146]]] developed an extension of the Strain Path method, the Shallow Strain Path method (SSPM), to explicitly include the effects of the stress free ground surface. The authors concluded that shallow penetrations cause a heave at the ground surface, while settlements only occur in the region around the tip and in a thin region of material adjacent to the shaft of the penetrometer. At large penetrations, settlements only occur at all points below the tip of the tube. |
<div id='img-65'></div> | <div id='img-65'></div> | ||
| Line 7,560: | Line 7,560: | ||
Assuming that the displacement of this point is representative of the vertical displacements of the inner free surface (the vertical displacement is not constant inside of the tube and may vary up to a factor of 1.7 for very thin tubes, see Figure 12 of <span id='citeF-146'></span>[[#cite-146|[146]]]), the specific recovery ratio may be computed for different wall thicknesses. Figure [[#img-66|66]] presents this curves in terms of the aspect ratio of the sampler. The peak recovery takes place at very shallow penetrations, <math display="inline">z = \dfrac{\sqrt{2}}{2}\,\dfrac{B-t}{B}\, R</math>, and the maximum value decreases with the aspect ratio, <math display="inline">B/t</math>. Once the peak value is attained, the specific recovery ratio decreases until it reaches a steady state of 100% | Assuming that the displacement of this point is representative of the vertical displacements of the inner free surface (the vertical displacement is not constant inside of the tube and may vary up to a factor of 1.7 for very thin tubes, see Figure 12 of <span id='citeF-146'></span>[[#cite-146|[146]]]), the specific recovery ratio may be computed for different wall thicknesses. Figure [[#img-66|66]] presents this curves in terms of the aspect ratio of the sampler. The peak recovery takes place at very shallow penetrations, <math display="inline">z = \dfrac{\sqrt{2}}{2}\,\dfrac{B-t}{B}\, R</math>, and the maximum value decreases with the aspect ratio, <math display="inline">B/t</math>. Once the peak value is attained, the specific recovery ratio decreases until it reaches a steady state of 100% | ||
| − | ==== | + | ====Finite element simulations==== |
Very limited numerical work has been performed on the sampling process. The origins of these simulations may be traced back to <span id='citeF-147'></span>[[#cite-147|[147]]], that used the finite element method. The authors employ a viscoplastic flow approach: assuming that the elastic strains are negligible, the deformation process is comparable to that of a viscous fluid of non Newtonian kind; the viscosity is considered non-linear and depends on the assumed constitutive model for the soil. Nonetheless, <span id='citeF-148'></span>[[#cite-148|[148]]] claimed that the discretization used by <span id='citeF-147'></span>[[#cite-147|[147]]] was too coarse to provide sufficient accuracy: the finite element mesh consisted only of 50 quadrilateral elements. | Very limited numerical work has been performed on the sampling process. The origins of these simulations may be traced back to <span id='citeF-147'></span>[[#cite-147|[147]]], that used the finite element method. The authors employ a viscoplastic flow approach: assuming that the elastic strains are negligible, the deformation process is comparable to that of a viscous fluid of non Newtonian kind; the viscosity is considered non-linear and depends on the assumed constitutive model for the soil. Nonetheless, <span id='citeF-148'></span>[[#cite-148|[148]]] claimed that the discretization used by <span id='citeF-147'></span>[[#cite-147|[147]]] was too coarse to provide sufficient accuracy: the finite element mesh consisted only of 50 quadrilateral elements. | ||
| − | <span id='citeF-148'></span>[[#cite-148|[148]]] performed a set of hydro-mechanical simulations of the sampling on normally consolidated Modified Cam Clay soil. The authors analyzed the effect of the penetration rate, sampler-soil interface friction and thickness of the tube; although the amount of disturbance varied due to these factors, in all the cases disturbance concentrated near the soil-sampler interface and at the top of the sample. Additionally, sampling disturbance due to friction at the soil-sampler interface increase as the sampler penetrates the soil: as such, long samples may result be seriously degraded. It is worth noting that the penetration of the sampler is simulated by splitting a group of nodes ahead of the penetration route up to a sufficient depth and applying incremental displacements to match the geometric configuration of the sampling tube; the accuracy of this approach is not demonstrated. In all the cases, the obtained vertical strains in the centerline are in the same order of magnitude of those obtained by <span id='citeF-138'></span>[[#cite-138|[138]]]. A typical finite element mesh consists of 400 quadrilateral elements. | + | Budhu and Wu <span id='citeF-148'></span>[[#cite-148|[148]]] performed a set of hydro-mechanical simulations of the sampling on normally consolidated Modified Cam Clay soil. The authors analyzed the effect of the penetration rate, sampler-soil interface friction and thickness of the tube; although the amount of disturbance varied due to these factors, in all the cases disturbance concentrated near the soil-sampler interface and at the top of the sample. Additionally, sampling disturbance due to friction at the soil-sampler interface increase as the sampler penetrates the soil: as such, long samples may result be seriously degraded. It is worth noting that the penetration of the sampler is simulated by splitting a group of nodes ahead of the penetration route up to a sufficient depth and applying incremental displacements to match the geometric configuration of the sampling tube; the accuracy of this approach is not demonstrated. In all the cases, the obtained vertical strains in the centerline are in the same order of magnitude of those obtained by <span id='citeF-138'></span>[[#cite-138|[138]]]. A typical finite element mesh consists of 400 quadrilateral elements. |
| − | ==== | + | ====Physical modeling==== |
| − | In terms of physical evidences, <span id='citeF-149'></span>[[#cite-149|[149]]] and <span id='citeF-150'></span>[[#cite-150|[150]]] developed a small-scale physical modelling system to investigate the effect of tube sampling. The authors used an artificial, transparent soil with embedded seeding particles. The process of the penetration of a glass sampler was recorded with digital photographies, that were analyzed by Particle Image Velocimetry (PIV). | + | In terms of physical evidences, Hover et al. <span id='citeF-149'></span>[[#cite-149|[149]]] and Hover <span id='citeF-150'></span>[[#cite-150|[150]]] developed a small-scale physical modelling system to investigate the effect of tube sampling. The authors used an artificial, transparent soil with embedded seeding particles. The process of the penetration of a glass sampler was recorded with digital photographies, that were analyzed by Particle Image Velocimetry (PIV). |
<div id='img-67a'></div> | <div id='img-67a'></div> | ||
| Line 7,641: | Line 7,641: | ||
|} | |} | ||
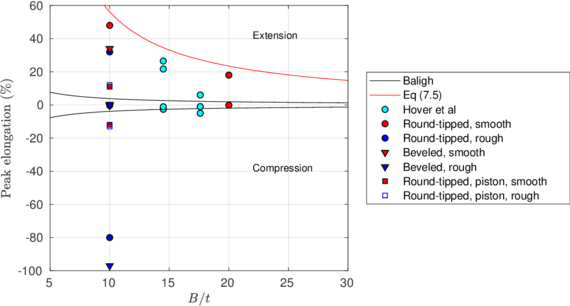
| − | <span id='citeF-149'></span>[[#cite-149|[149]]] present the results of two different tests with a round tipped, thick penetrometer. Altough the diameter and thickness of the samplers used in each test is different (one has an aspect ratio of <math display="inline">B/t=14.5</math> and the other is 17.6), the main difference between the two tests is that in one of them a pressure plate with a hole to let the tube pass through was placed on top of the soil with a pressure of 50 kPa whereas on the other no pressure plate was considered. Both samples where first prepared and consolidated with an external load of 50 kPa. | + | Hover et al. <span id='citeF-149'></span>[[#cite-149|[149]]] present the results of two different tests with a round tipped, thick penetrometer. Altough the diameter and thickness of the samplers used in each test is different (one has an aspect ratio of <math display="inline">B/t=14.5</math> and the other is 17.6), the main difference between the two tests is that in one of them a pressure plate with a hole to let the tube pass through was placed on top of the soil with a pressure of 50 kPa whereas on the other no pressure plate was considered. Both samples where first prepared and consolidated with an external load of 50 kPa. |
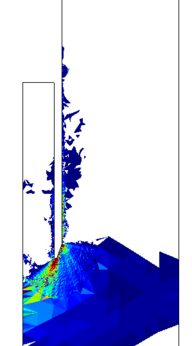
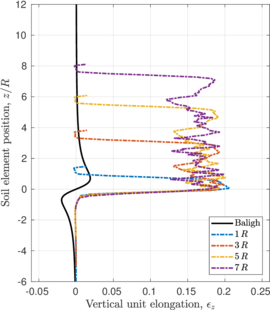
The results of these two tests are shown in Figure [[#img-67|67]], that depicts the vertical strain history of soil elements located at the centerline of the sampler; curves are labeled in terms of the initial depth of the soil element. The first thing to note is that the presence of the pressure plate plays a prominent role: as shown in Table [[#table-11|A]], using a pressure plate a peak extensive strain of <math display="inline">-26.5%</math> is observed whereas without the pressure plate the maximum extensive strain is <math display="inline">-6%</math> after the sampler has penetrated one diameter. Nonetheless, these values are much higher than those predicted by the Strain Path Method <span id='citeF-138'></span><span id='citeF-139'></span>[[#cite-138|[138,139]]]. | The results of these two tests are shown in Figure [[#img-67|67]], that depicts the vertical strain history of soil elements located at the centerline of the sampler; curves are labeled in terms of the initial depth of the soil element. The first thing to note is that the presence of the pressure plate plays a prominent role: as shown in Table [[#table-11|A]], using a pressure plate a peak extensive strain of <math display="inline">-26.5%</math> is observed whereas without the pressure plate the maximum extensive strain is <math display="inline">-6%</math> after the sampler has penetrated one diameter. Nonetheless, these values are much higher than those predicted by the Strain Path Method <span id='citeF-138'></span><span id='citeF-139'></span>[[#cite-138|[138,139]]]. | ||
| Line 7,655: | Line 7,655: | ||
During the installation of open-pipe piles or during tube sampling processes, soil enters the tube until the inner-soil cylinder develops sufficient resistance to prevent further soil intrusion and the structure becomes plugged; then the structure assumes the penetration characteristics of a closed-ended pile <span id='citeF-1'></span>[[#cite-1|[1]]]. The occurrence of a plug has been generally linked to the shaft inner friction and, in the case of soil samplers, to very high levels of disturbance in the soil inside of the tube <span id='citeF-141'></span>[[#cite-141|[141]]]. | During the installation of open-pipe piles or during tube sampling processes, soil enters the tube until the inner-soil cylinder develops sufficient resistance to prevent further soil intrusion and the structure becomes plugged; then the structure assumes the penetration characteristics of a closed-ended pile <span id='citeF-1'></span>[[#cite-1|[1]]]. The occurrence of a plug has been generally linked to the shaft inner friction and, in the case of soil samplers, to very high levels of disturbance in the soil inside of the tube <span id='citeF-141'></span>[[#cite-141|[141]]]. | ||
| − | <span id='citeF-1'></span>[[#cite-1|[1]]] proposed a quite simple method to estimate the susceptibility of the formation of a soil plug in open ended piles, that is based on the pile capacity. The authors state that a plug is formed when the static capacity of the open-ended pile is equal to that of a closed-ended pile; in other words, the plug of an open-ended pile is mobilized when the accumulated inside skin friction exceeds the ultimate static bearing capacity of the soil below the toe of the pile. Consequently, in these conditions, the pile behaves as though it is closed ended. | + | Paikowsky and Whitman <span id='citeF-1'></span>[[#cite-1|[1]]] proposed a quite simple method to estimate the susceptibility of the formation of a soil plug in open ended piles, that is based on the pile capacity. The authors state that a plug is formed when the static capacity of the open-ended pile is equal to that of a closed-ended pile; in other words, the plug of an open-ended pile is mobilized when the accumulated inside skin friction exceeds the ultimate static bearing capacity of the soil below the toe of the pile. Consequently, in these conditions, the pile behaves as though it is closed ended. |
In the referred work and specifically for clays, the authors propose to approximate all the forces (end resistance of open and closed ended piles, skin resistance, tip resistance, ...) to cone penetration results (cone resistance and sleeve friction resistance) and link them to the undrained shear strength (<math display="inline">S_u</math>) through classical CPT interpretation techniques (cavity expansion). | In the referred work and specifically for clays, the authors propose to approximate all the forces (end resistance of open and closed ended piles, skin resistance, tip resistance, ...) to cone penetration results (cone resistance and sleeve friction resistance) and link them to the undrained shear strength (<math display="inline">S_u</math>) through classical CPT interpretation techniques (cavity expansion). | ||
| Line 8,989: | Line 8,989: | ||
|} | |} | ||
| − | As already discussed in the introduction, <span id='citeF-1'></span>[[#cite-1|[1]]] developed a theory to predict the occurrence of a plug in open ended piles. In essence, the theory states that the pile becomes plugged when the inner-soil cylinder develops sufficient frictional resistance that prevents further soil to intrusion and the plugged pile assumes the penetration characteristics of a closed-ended pile. In other words, the unit end bearing capacity of the plugged pile, termed as <math display="inline">q_p</math> in Figure [[#img-106|106]](b), is similar to the end unit bearing capacity of a closed-ended pile. | + | As already discussed in the introduction, Paikowsky and Whitman <span id='citeF-1'></span>[[#cite-1|[1]]] developed a theory to predict the occurrence of a plug in open ended piles. In essence, the theory states that the pile becomes plugged when the inner-soil cylinder develops sufficient frictional resistance that prevents further soil to intrusion and the plugged pile assumes the penetration characteristics of a closed-ended pile. In other words, the unit end bearing capacity of the plugged pile, termed as <math display="inline">q_p</math> in Figure [[#img-106|106]](b), is similar to the end unit bearing capacity of a closed-ended pile. |
For an open-ended pile, this unit end bearing capacity (<math display="inline">q_p</math> in Figure [[#img-106|106]]) is composed by the tip bearing capacity, the inner shaft frictional forces and the load boundary condition imposed at the inner free surface: | For an open-ended pile, this unit end bearing capacity (<math display="inline">q_p</math> in Figure [[#img-106|106]]) is composed by the tip bearing capacity, the inner shaft frictional forces and the load boundary condition imposed at the inner free surface: | ||
| Line 9,039: | Line 9,039: | ||
===7.8.2 Assessment against the numerical results=== | ===7.8.2 Assessment against the numerical results=== | ||
| − | ==== | + | ====Thick, round tipped samplers==== |
<div id='img-107a'></div> | <div id='img-107a'></div> | ||
| Line 9,059: | Line 9,059: | ||
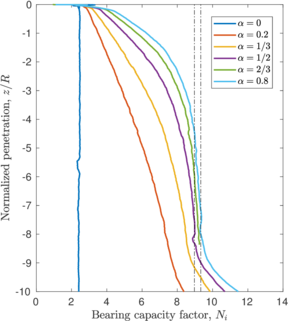
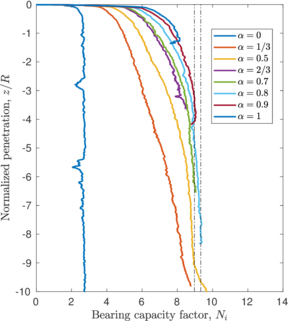
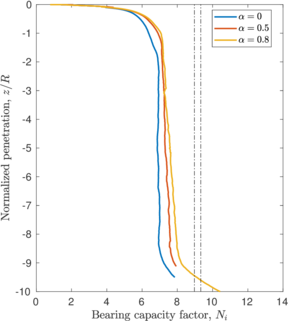
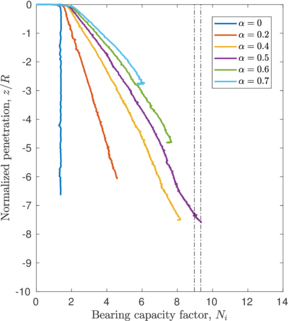
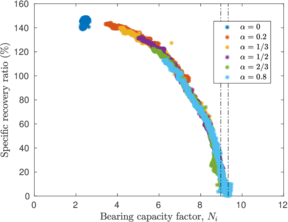
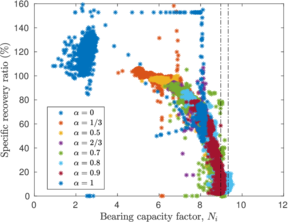
The previously described penetrations at which the plug is formed for each simulation coincide with the depth where the bearing capacity factor described in Equation [[#eq-7.11|7.11]] is close to the bearing capacity of a closed-ended pile (as shown in Figure [[#img-168|168]]: <math display="inline">N_c = 8.97</math> for a smooth interface and <math display="inline">N_c = 9.33</math> for a rough interface (<math display="inline">\alpha = 0.5</math>)). Specifically, it seems that the plug is formed once the bearing capacity reaches the value of a smooth closed ended pile and, afterwards, the capacity slightly increases. | The previously described penetrations at which the plug is formed for each simulation coincide with the depth where the bearing capacity factor described in Equation [[#eq-7.11|7.11]] is close to the bearing capacity of a closed-ended pile (as shown in Figure [[#img-168|168]]: <math display="inline">N_c = 8.97</math> for a smooth interface and <math display="inline">N_c = 9.33</math> for a rough interface (<math display="inline">\alpha = 0.5</math>)). Specifically, it seems that the plug is formed once the bearing capacity reaches the value of a smooth closed ended pile and, afterwards, the capacity slightly increases. | ||
| − | ==== | + | ====Thick sampler with a beveled cutting edge==== |
<div id='img-108a'></div> | <div id='img-108a'></div> | ||
| Line 9,077: | Line 9,077: | ||
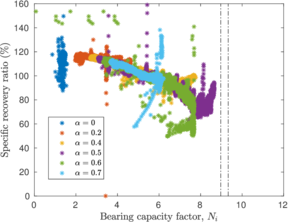
The same analysis is repeated in Figure [[#img-108|108]] for the beveled cutting-shoe, that has an outer cutting-edge angle of 20<math display="inline">^\circ </math>. The closed-ended pile has not been recomputed with the cutting-edge angle of 20<math display="inline">^{\circ }</math> and the reference closed-ended pile of the previous case is used since the mismatch of the geometry is not substantial. Also in this case, a good correspondence between the formation of a plug (very low specific recovery ratios) and a value of the bearing capacity factor defined in Equation [[#eq-7.11|7.11]] similar to that of a closed ended pile is obtained. | The same analysis is repeated in Figure [[#img-108|108]] for the beveled cutting-shoe, that has an outer cutting-edge angle of 20<math display="inline">^\circ </math>. The closed-ended pile has not been recomputed with the cutting-edge angle of 20<math display="inline">^{\circ }</math> and the reference closed-ended pile of the previous case is used since the mismatch of the geometry is not substantial. Also in this case, a good correspondence between the formation of a plug (very low specific recovery ratios) and a value of the bearing capacity factor defined in Equation [[#eq-7.11|7.11]] similar to that of a closed ended pile is obtained. | ||
| − | ==== | + | ====Thick, round tipped sampler with a piston on top==== |
<div id='img-109a'></div> | <div id='img-109a'></div> | ||
| Line 9,095: | Line 9,095: | ||
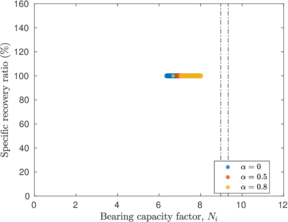
Figure [[#img-109|109]](b) depicts the evolution of the bearing capacity factor in terms of the penetration for the cases in which a piston is placed on top of the internal free surface. The value of this factor is always lower than those of closed ended piles. For the smooth case a steady state is achieved after a penetration of <math display="inline">2\,R</math>. Meanwhile, for the rough cases, the bearing capacity factor continuously increases. It should be noted that the contribution to this factor due to the vertical stress exerted by the piston continuously decrease (see Figure [[#img-94|94]]); on the contrary, the contribution to <math display="inline">N_i</math> due to the tangential contact forces increase because the area of the internal interface in contact with the soil continuously becomes larger. | Figure [[#img-109|109]](b) depicts the evolution of the bearing capacity factor in terms of the penetration for the cases in which a piston is placed on top of the internal free surface. The value of this factor is always lower than those of closed ended piles. For the smooth case a steady state is achieved after a penetration of <math display="inline">2\,R</math>. Meanwhile, for the rough cases, the bearing capacity factor continuously increases. It should be noted that the contribution to this factor due to the vertical stress exerted by the piston continuously decrease (see Figure [[#img-94|94]]); on the contrary, the contribution to <math display="inline">N_i</math> due to the tangential contact forces increase because the area of the internal interface in contact with the soil continuously becomes larger. | ||
| − | ==== | + | ====Thin, round tipped sampler==== |
<div id='img-110a'></div> | <div id='img-110a'></div> | ||
| Line 9,284: | Line 9,284: | ||
|} | |} | ||
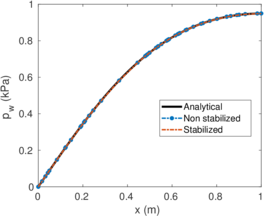
| − | <span id='citeF-155'></span>[[#cite-155|[155]]] published analytical solutions for the problem of consolidation beneath a smooth impermeable circular raft of finite stiffness. The normalized consolidation curve from that solution is compared with the numerical solutions in Figure [[#img-116|116]]. All numerical solutions plot very close to one another and the small differences with the analytical solution are likely due to the different mechanical interface condition (smooth contact vs perfect adherence). The use of stabilization in the mass conservation equation does not seem to produce any over-diffusive effect. | + | Booker and Small <span id='citeF-155'></span>[[#cite-155|[155]]] published analytical solutions for the problem of consolidation beneath a smooth impermeable circular raft of finite stiffness. The normalized consolidation curve from that solution is compared with the numerical solutions in Figure [[#img-116|116]]. All numerical solutions plot very close to one another and the small differences with the analytical solution are likely due to the different mechanical interface condition (smooth contact vs perfect adherence). The use of stabilization in the mass conservation equation does not seem to produce any over-diffusive effect. |
<div id='img-118a'></div> | <div id='img-118a'></div> | ||
| Line 9,962: | Line 9,962: | ||
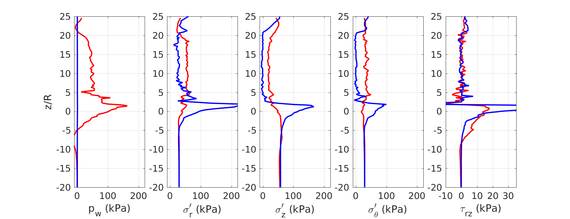
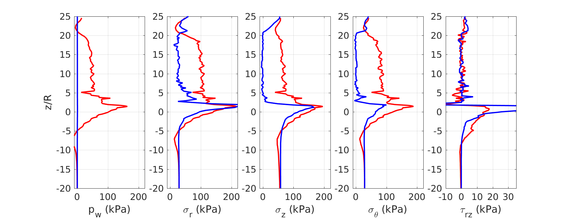
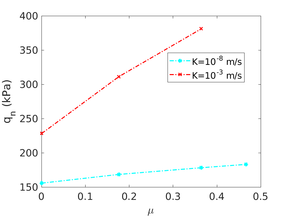
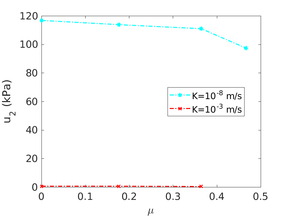
Similar effects have been reported by Ceccato et al. [160,161], although the pattern of net tip resistance increase with interface friction is somewhat different to that found here (Figure [[#img-127|127]]), with stronger effects of small friction for fast penetration. The differences in the contact algorithm employed may explain this discrepancy. | Similar effects have been reported by Ceccato et al. [160,161], although the pattern of net tip resistance increase with interface friction is somewhat different to that found here (Figure [[#img-127|127]]), with stronger effects of small friction for fast penetration. The differences in the contact algorithm employed may explain this discrepancy. | ||
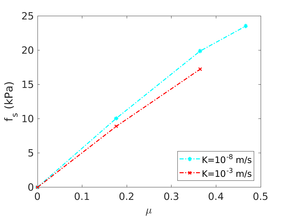
| − | Finally, as shown in Figure [[#img-124|124]](c), the mobilized stress at the friction sleeve, <math display="inline">f_s</math>, increases linearly with interface friction, and has a value that is practically independent of drainage conditions. This result may be related to the repeated field observation of poor repeatability on CPTu friction sleeve readings <span id='citeF-166'></span>[[#cite-166|[166]]]. Although other aspects of friction sleeve design may be involved, <span id='citeF-167'></span>[[#cite-167|[167]]] already pointed out at sleeve roughness as a possible contributing factor. The numerical results support that idea: poorly controlled sleeve roughness will result in significant variance on interface friction and, therefore, on <math display="inline">f_s</math>. | + | Finally, as shown in Figure [[#img-124|124]](c), the mobilized stress at the friction sleeve, <math display="inline">f_s</math>, increases linearly with interface friction, and has a value that is practically independent of drainage conditions. This result may be related to the repeated field observation of poor repeatability on CPTu friction sleeve readings <span id='citeF-166'></span>[[#cite-166|[166]]]. Although other aspects of friction sleeve design may be involved, Lunne and Andersen <span id='citeF-167'></span>[[#cite-167|[167]]] already pointed out at sleeve roughness as a possible contributing factor. The numerical results support that idea: poorly controlled sleeve roughness will result in significant variance on interface friction and, therefore, on <math display="inline">f_s</math>. |
===8.2.4 Lateral earth pressure coefficient=== | ===8.2.4 Lateral earth pressure coefficient=== | ||
| − | Much has been said about the coefficient of lateral earth pressure, <math display="inline">K_0</math>. Specifically in clays, this coefficient is generally believed to be a consequence of soil constitutive parameters and the stress history. <span id='citeF-168'></span>[[#cite-168|[168]]] linked the coefficient of lateral earth pressure in normally consolidated conditions to the soil friction angle. Afterwards, several expressions for overconsolidated cases have been proposed based on laboratory data and in situ tests <span id='citeF-169'></span><span id='citeF-170'></span>[[#cite-169|[169,170]]]. | + | Much has been said about the coefficient of lateral earth pressure, <math display="inline">K_0</math>. Specifically in clays, this coefficient is generally believed to be a consequence of soil constitutive parameters and the stress history. Jáki <span id='citeF-168'></span>[[#cite-168|[168]]] linked the coefficient of lateral earth pressure in normally consolidated conditions to the soil friction angle. Afterwards, several expressions for overconsolidated cases have been proposed based on laboratory data and in situ tests <span id='citeF-169'></span><span id='citeF-170'></span>[[#cite-169|[169,170]]]. |
<div id='img-128a'></div> | <div id='img-128a'></div> | ||
| Line 10,059: | Line 10,059: | ||
One of the major applications of CPT and CPTu is the determination of soil stratigraphy and the identification of soil type <span id='citeF-122'></span>[[#cite-122|[122]]]. This is accomplished using charts that link cone parameters (net tip resistance, friction sleeve, water pressure,...) to soil behavior type. | One of the major applications of CPT and CPTu is the determination of soil stratigraphy and the identification of soil type <span id='citeF-122'></span>[[#cite-122|[122]]]. This is accomplished using charts that link cone parameters (net tip resistance, friction sleeve, water pressure,...) to soil behavior type. | ||
| − | <span id='citeF-171'></span>[[#cite-171|[171]]] developed a soil behavior type method based on the following dimensionless metrics: the normalized cone tip resistance, the normalized water pressure and the normalized friction ratio: | + | Robertson <span id='citeF-171'></span>[[#cite-171|[171]]] developed a soil behavior type method based on the following dimensionless metrics: the normalized cone tip resistance, the normalized water pressure and the normalized friction ratio: |
{| class="formulaSCP" style="width: 100%; text-align: left;" | {| class="formulaSCP" style="width: 100%; text-align: left;" | ||
| Line 10,081: | Line 10,081: | ||
The two soil behavior charts developed by <span id='citeF-171'></span>[[#cite-171|[171]]] are presented in Figure [[#img-132|132]]. In the <math display="inline">F_r-Q_t</math> interpretation chart, clayey materials are believed to have a low normalized tip resistance and high normalized friction ratios whereas sand materials show the opposite behavior: high normalized tip resistances and low normalized friction ratios. As depicted in Figure [[#img-132|132]](a), over-consolidated soils tends to have larger normalized tip resistance and sleeve friction ratio. | The two soil behavior charts developed by <span id='citeF-171'></span>[[#cite-171|[171]]] are presented in Figure [[#img-132|132]]. In the <math display="inline">F_r-Q_t</math> interpretation chart, clayey materials are believed to have a low normalized tip resistance and high normalized friction ratios whereas sand materials show the opposite behavior: high normalized tip resistances and low normalized friction ratios. As depicted in Figure [[#img-132|132]](a), over-consolidated soils tends to have larger normalized tip resistance and sleeve friction ratio. | ||
| − | Meanwhile, in the <math display="inline">B_q-Q_t</math>, sand soils develop very limited water pressure whereas clayey materials are characterized by high normalized water pressures. This is because, at the standard penetration rate (0.02 m/s), most sands exhibit drained conditions whereas completely undrained conditions typically prevail in clayey materials. With respect to normally consolidated clays, <span id='citeF-122'></span>[[#cite-122|[122]]] characterized over-consolidated clays with lower normalized water pressures and higher normalized tip resistances (Figure [[#img-132|132]](b)). | + | Meanwhile, in the <math display="inline">B_q-Q_t</math>, sand soils develop very limited water pressure whereas clayey materials are characterized by high normalized water pressures. This is because, at the standard penetration rate (0.02 m/s), most sands exhibit drained conditions whereas completely undrained conditions typically prevail in clayey materials. With respect to normally consolidated clays, Robertson <span id='citeF-122'></span>[[#cite-122|[122]]] characterized over-consolidated clays with lower normalized water pressures and higher normalized tip resistances (Figure [[#img-132|132]](b)). |
Generally, the most popular chart used for onshore CPTu interpretation is the <math display="inline">F_r-Q_t</math>. Due to technological issues, it is believed that the pore pressure has a lack of repeatability due to a poor saturation or a loss of saturation of the filter in most onshore situations since the cone is often required to penetrate several meters through unsaturated soil before reaching saturated conditions <span id='citeF-172'></span>[[#cite-172|[172]]]. A similar effect is found when the cone is pushed through saturated dense silty sand or stiff over-consolidated clay, where the measured <math display="inline">u_2</math> water pressure can become negative due to the dilative nature of the soil, resulting in air bubbles coming out of solution <span id='citeF-173'></span>[[#cite-173|[173]]]. Interestingly, it has also been claimed that the friction sleeve resistance measurements may also lack of repeatability <span id='citeF-162'></span><span id='citeF-166'></span><span id='citeF-174'></span><span id='citeF-175'></span><span id='citeF-176'></span>[[#cite-162|[162,166,174,175,176]]] | Generally, the most popular chart used for onshore CPTu interpretation is the <math display="inline">F_r-Q_t</math>. Due to technological issues, it is believed that the pore pressure has a lack of repeatability due to a poor saturation or a loss of saturation of the filter in most onshore situations since the cone is often required to penetrate several meters through unsaturated soil before reaching saturated conditions <span id='citeF-172'></span>[[#cite-172|[172]]]. A similar effect is found when the cone is pushed through saturated dense silty sand or stiff over-consolidated clay, where the measured <math display="inline">u_2</math> water pressure can become negative due to the dilative nature of the soil, resulting in air bubbles coming out of solution <span id='citeF-173'></span>[[#cite-173|[173]]]. Interestingly, it has also been claimed that the friction sleeve resistance measurements may also lack of repeatability <span id='citeF-162'></span><span id='citeF-166'></span><span id='citeF-174'></span><span id='citeF-175'></span><span id='citeF-176'></span>[[#cite-162|[162,166,174,175,176]]] | ||
| Line 10,099: | Line 10,099: | ||
|} | |} | ||
| − | <span id='citeF-177'></span>[[#cite-177|[177]]] claimed that much <math display="inline">B_q-Q_t</math> interpretation charts are unable to separate the effect of partial consolidation from the yield stress ration. This is because both factors tend to increase the normalized cone tip resistance, <math display="inline">Q_t</math>, and decrease the normalized pore pressure, <math display="inline">B_q</math>; thus, showing the same tendency in the classical <math display="inline">B_q-Q_t</math> interpretation chart. To this end, the authors developed new <math display="inline">\Delta u_2 / \sigma _{v0}^{\prime }-Q_t</math> and <math display="inline">B_q-Q_t</math> charts, that are presented in Figure [[#img-133|133]]. The figure also incorporates a comparison with the chart proposed by <span id='citeF-171'></span>[[#cite-171|[171]]]. These new interpretation charts define a much limited number of soil behavior types. | + | Schneider et al. <span id='citeF-177'></span>[[#cite-177|[177]]] claimed that much <math display="inline">B_q-Q_t</math> interpretation charts are unable to separate the effect of partial consolidation from the yield stress ration. This is because both factors tend to increase the normalized cone tip resistance, <math display="inline">Q_t</math>, and decrease the normalized pore pressure, <math display="inline">B_q</math>; thus, showing the same tendency in the classical <math display="inline">B_q-Q_t</math> interpretation chart. To this end, the authors developed new <math display="inline">\Delta u_2 / \sigma _{v0}^{\prime }-Q_t</math> and <math display="inline">B_q-Q_t</math> charts, that are presented in Figure [[#img-133|133]]. The figure also incorporates a comparison with the chart proposed by <span id='citeF-171'></span>[[#cite-171|[171]]]. These new interpretation charts define a much limited number of soil behavior types. |
<div id='img-134a'></div> | <div id='img-134a'></div> | ||
| Line 10,120: | Line 10,120: | ||
|} | |} | ||
| − | ==== | + | ====Assessment of the interpretation charts==== |
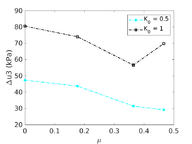
Figure [[#img-134|134]] depicts some of the numerical results in the previously introduced interpretation charts. In particular, the figure presents the set of data obtained in practically undrained conditions with two different coefficients of lateral earth pressure (<math display="inline">K_0 = 0.5</math> and <math display="inline">K_0 = 1</math>) for an identical material using different contact friction angles. | Figure [[#img-134|134]] depicts some of the numerical results in the previously introduced interpretation charts. In particular, the figure presents the set of data obtained in practically undrained conditions with two different coefficients of lateral earth pressure (<math display="inline">K_0 = 0.5</math> and <math display="inline">K_0 = 1</math>) for an identical material using different contact friction angles. | ||
| Line 10,211: | Line 10,211: | ||
where <math display="inline">r</math> is the cone tip radius, <math display="inline">\gamma _w</math> is the water unit weight, <math display="inline">I_r</math> is a rigidity index and <math display="inline">M</math> is a constrained modulus. The rigidity index is defined as <math display="inline">I_r = G/S_u</math>, the ratio between a shear modulus, <math display="inline">G</math>, and an undrained shear strength, <math display="inline">S_u</math>. Obtaining appropriate values for <math display="inline">G</math> and <math display="inline">S_u</math> is not always easy <span id='citeF-184'></span>[[#cite-184|[184]]]. When a value of permeability, <math display="inline">k</math>, is necessary, an estimate of constrained modulus, <math display="inline">M</math>, is also required, which compounds the difficulties. | where <math display="inline">r</math> is the cone tip radius, <math display="inline">\gamma _w</math> is the water unit weight, <math display="inline">I_r</math> is a rigidity index and <math display="inline">M</math> is a constrained modulus. The rigidity index is defined as <math display="inline">I_r = G/S_u</math>, the ratio between a shear modulus, <math display="inline">G</math>, and an undrained shear strength, <math display="inline">S_u</math>. Obtaining appropriate values for <math display="inline">G</math> and <math display="inline">S_u</math> is not always easy <span id='citeF-184'></span>[[#cite-184|[184]]]. When a value of permeability, <math display="inline">k</math>, is necessary, an estimate of constrained modulus, <math display="inline">M</math>, is also required, which compounds the difficulties. | ||
| − | <span id='citeF-178'></span>[[#cite-178|[178]]] presented a formula that, based on results by <span id='citeF-134'></span>[[#cite-134|[134]]], summarized the relationship between coefficient of horizontal consolidation, <math display="inline">c_h</math>, and <math display="inline">t_{50}</math> as follows: | + | Robertson <span id='citeF-178'></span>[[#cite-178|[178]]] presented a formula that, based on results by <span id='citeF-134'></span>[[#cite-134|[134]]], summarized the relationship between coefficient of horizontal consolidation, <math display="inline">c_h</math>, and <math display="inline">t_{50}</math> as follows: |
{| class="formulaSCP" style="width: 100%; text-align: left;" | {| class="formulaSCP" style="width: 100%; text-align: left;" | ||
| Line 10,235: | Line 10,235: | ||
|} | |} | ||
| − | <span id='citeF-178'></span>[[#cite-178|[178]]] proposed to estimate <math display="inline">M</math> from CPT results: | + | Robertson <span id='citeF-178'></span>[[#cite-178|[178]]] proposed to estimate <math display="inline">M</math> from CPT results: |
<span id="eq-9.5"></span> | <span id="eq-9.5"></span> | ||
| Line 10,312: | Line 10,312: | ||
|} | |} | ||
| − | ==== | + | ====Elsworth and Lee <span id='citeF-185'></span>[[#cite-185|[185]]] method==== |
Elsworth and Lee <span id='citeF-185'></span>[[#cite-185|[185]]], generalizing a previous work by Elsworth <span id='citeF-189'></span>[[#cite-189|[189]]], analyzed the flow induced by a finite size penetrometer as a moving steady state flow problem. Combining dislocation and cavity expansion analysis and assuming negligible local storage they used continuity and Darcy's law to obtain the following relation: | Elsworth and Lee <span id='citeF-185'></span>[[#cite-185|[185]]], generalizing a previous work by Elsworth <span id='citeF-189'></span>[[#cite-189|[189]]], analyzed the flow induced by a finite size penetrometer as a moving steady state flow problem. Combining dislocation and cavity expansion analysis and assuming negligible local storage they used continuity and Darcy's law to obtain the following relation: | ||
| Line 10,846: | Line 10,846: | ||
==9.5 Estimation of permeability during penetration== | ==9.5 Estimation of permeability during penetration== | ||
| − | |||
| − | |||
| − | |||
| − | |||
| − | |||
| − | |||
| − | |||
| − | |||
| − | |||
| − | |||
| − | |||
| − | |||
| − | |||
| − | |||
| − | |||
| − | |||
| − | |||
| − | |||
| − | |||
| − | |||
| − | |||
| − | |||
| − | |||
| − | |||
| − | |||
| − | |||
| − | |||
| − | |||
| − | |||
| − | |||
| − | |||
| − | |||
| − | |||
| − | |||
| − | |||
| − | |||
| − | |||
| − | |||
| − | |||
| − | |||
| − | |||
| − | |||
| − | |||
| − | |||
| − | |||
| − | |||
| − | |||
| − | |||
| − | |||
| − | |||
| − | |||
| − | |||
| − | |||
| − | |||
| − | |||
| − | |||
| − | |||
| − | |||
| − | |||
| − | |||
| − | |||
| − | |||
| − | |||
| − | |||
| − | |||
| − | |||
| − | |||
| − | |||
| − | |||
| − | |||
| − | |||
| − | |||
| − | |||
| − | |||
| − | |||
| − | |||
| − | |||
| − | |||
| − | |||
| − | |||
| − | |||
| − | |||
| − | |||
| − | |||
| − | |||
| − | |||
| − | |||
| − | |||
| − | |||
| − | |||
| − | |||
| − | |||
| − | |||
| − | |||
| − | |||
| − | |||
| − | |||
| − | |||
| − | |||
| − | |||
| − | |||
| − | |||
| − | |||
| − | |||
| − | |||
| − | |||
| − | |||
| − | |||
In this section, the previously introduced techniques to estimate permeability during cone penetration are assessed against a set of numerical data; to enhance the analysis, other results obtained through numerical simulation available in the literature are also used. | In this section, the previously introduced techniques to estimate permeability during cone penetration are assessed against a set of numerical data; to enhance the analysis, other results obtained through numerical simulation available in the literature are also used. | ||
| Line 11,205: | Line 11,097: | ||
| <math>\Delta u_{2}^{ref} / \sigma _{v0}^\prime </math> | | <math>\Delta u_{2}^{ref} / \sigma _{v0}^\prime </math> | ||
|- style="border-top: 2px solid;" | |- style="border-top: 2px solid;" | ||
| − | | style="text-align: left;" | | + | | style="text-align: left;" | Mahmoodzadeh et al. <span id='citeF-164'></span>[[#cite-164|[164]]] |
| 0.0404 | | 0.0404 | ||
| 0.205 | | 0.205 | ||
Latest revision as of 08:05, 26 August 2019
Abstract
Insertion problems in Geomechanics with the Particle Finite Element method
This work develops a numerical technique in which the Particle Finite Element method is applied to simulate solid intrusion problems in Geotechnical Engineering. The work describes the numerical developments that made the method functional and showcases its potential with various application problems.
New numerical developments include: integration schemes for large-strain, elasto-plastic constitutive models, novel integration methods for rigid body contact constraints and stabilized mixed formulations for single-phase and two-phase problems.
An explicit stress integration scheme is developed for elasto-plastic, large-strain constitutive models using a multiplicative split of the deformation gradient. This scheme uses adaptive substepping and a yield violation drift correction technique.
Rigid bodies with pre-specified shape and motion may be modeled. Contact constraints are introduced using a penalty method in which tangential behavior is treated with an elasto-plastic analogy. This elasto-plastic contact model is integrated by means of an implicit integration technique; an alternative scheme using the Implex algorithm is also described and assessed.
Low-order (linear) elements are employed to speed computation. These elements may suffer volumetric locking in quasi-incompressible conditions. For soils, such conditions appear under undrained loading or at critical state. To alleviate this problem, mixed formulations are developed and stabilization techniques are applied. Two different three-field mixed formulations for the coupled hydro-mechanical problem are presented, adding either the effective pressure or the Jacobian as nodal variables to the solid skeleton displacement and water pressure. Stabilization terms are used in the mass conservation equation of the biphasic medium and in the rest of scalar equations. Several mixed formulations are also implemented for the simplified single-phase problem, which approximates saturated soil behavior under undrained conditions.
The first application examples are three total stress problems: indentation of a rigid strip footing, T-Bar motion and a rough cone penetration test. All are frequently used benchmark problems; they allow to compare the performance of the developed numerical scheme with other techniques. It appears that the numerical strategy followed by PFEM, obtains similar results than those attained with alternative numerical methods with significant savings in computational efforts.
A total stress approach is also used in a parametric study of tube sampling in clay. The parameters explored include sampler geometry (round-tipped or beveled cutting shoes; outer diameter to wall thickness ratios); constitutive parameters, roughness factor and boundary conditions are studied. Outputs are analyzed in terms of classical sampling disturbance measures: the centerline strain path and the specific recovery ratio. The results show good agreement with experimental evidence and question the frequently accepted reference role of Strain Path method solutions.
The set of simulations in which a rough interface behavior is considered has been used to assess the theory proposed by [1] to predict the occurrence of a plug inside of an open-ended pile. The numerical results obtained here corroborate this theory: a plug inside of the tube is formed once the mobilized forces are equal to those that would mobilize a smooth closed-ended pile. Indeed, the failure mechanism that prevails during the penetration of a plugged tube is coincident with that of a closed-ended pile.
The last analysis of this work is the hydro-mechanical simulation of the cone penetration test in a Modified Cam Clay soil. A parametric analysis covers the effect of the permeability of the soil -from drained to undrained conditions- and the interface friction angle. The effect of these parameters on the cone resistance, sleeve friction and pore pressure at three potential measurement points is fully characterized. These numerical results are used to assess several techniques to estimate the permeability of soils from CPTu testing. Special attention is paid to on-the-fly techniques, in which permeability could be directly estimated from the CPTu data stream without the need for any stoppage.
Preface
This monograph is a revised version of the doctoral dissertation of the first author, entitled Insertion Problems in Geomechanics with the Particle Finite Element Method. The thesis was defended on November 5th 2018 in Barcelona. The research was conducted under the supervision of Professors M. Arroyo, J. M. Carbonell and A. Gens.
The financial support of the Ministry of Education of Spain through research grants BIA-2011-27217 and BIA-2014-59467-R is gratefully appreciated. The support provided by the European Commission funded GEO-RAMP RISE project (H2020-645665- GEO-RAMP) is also acknowledged.
1 Introduction
1.1 Introduction
Many activities in Geotechnical Engineering involve the insertion of a rigid body into the soil. Examples include most foundation solutions, that range from displacement piles -that may be driven into the soil by striking them with a hammer-, spud-can foundations or even suction caissons -in which the water pressure inside of the bucket is decreased, causing the foundation to sink into the sea floor.
Penetration problems are also involved in the processes to estimate or obtain constitutive parameters to design these structures. For instance, to perform laboratory tests on a sample, first it has to be retrieved from the ground by pushing or hammering a tube into the ground. Alternatively, constitutive parameters may be obtained from in-situ tests, in which instrumented probes are pushed into the soil and the value of constitutive parameters are estimated from test readings.
In this kind of problem large displacements and deformations of the soil mass are always present. The coupled hydro-mechanical response of the soil adds further complexity, even in cases where insertion speed is tightly controlled. Analysis of problems of rigid body insertion into soil masses had traditionally relied on highly idealized approaches such as geometrically simple cavity expansion mechanisms [2]. Although much insight is gained from such analyses, a number of basic features of the problem are left aside and, as a consequence, a host of not fully understood empirical corrections and methods have been relied upon for practical applications.
Numerical simulation seems an obvious alternative to advance understanding in this area. However, the numerical simulation of rigid body insertion into soils is a complex task, since the system is full of non-linearities, contact-related, material-related and also geometrical. This latter kind of non-linearity was a fundamental obstacle to the Lagrangian or updated Lagrangian formulations of the finite element method (FEM) that are successful in other areas of geotechnical engineering. Strong mesh distortion resulted in large inaccuracies and/or stopped calculation at relatively small displacements [3].
In the last decades several numerical frameworks have been developed to address those problems. Some approaches are not based on continuum mechanics and use instead discrete element methods [4,5,6]; however, continuum-based approaches are dominant, particularly for fine-grained soils. Within continuum-based methods the approach most frequently applied to geotechnical insertion problems has been that of Arbitrary Lagrangian-Eulerian formulations (ALE). ALE finite element formulations combine the Lagrangian and Eulerian kinematic descriptions, by separately considering material and computational mesh motions [7].
The application of ALE to insertion problems in soil mechanics may be traced to [8]. Afterwards, three main FEM ALE methods have been increasingly developed and repeatedly applied in this area: the so-called remeshing and interpolation technique by small strain (RITSS) developed by Randolph and co-workers [9,10,11], the so-called efficient ALE approach (EALE) developed by Nazem and co-workers [12,13,14] and the successive built-in implementation of ALE in Abaqus/Explicit, currently known as the Coupled Eulerian-Lagrangian (CEL) method [15] which have been applied to insertion problems by several teams [16,17,18]. A comparative review of these ALE methods has been recently presented by [19].
A second continuum-based numerical framework is that of the Material Point Method (MPM). A set of particles (material points) move within a fixed finite element computational grid. Material points carry all the information (density, velocity, stress, strain, external loads…) which, at each step, is transferred to the grid to solve the mechanical problem. The computed solution allows updating of position and properties of the material points. The application of MPM to geotechnical problems is relatively recent [20,21]. Despite that, several implementations of MPM have been already used to model rigid body insertion into soils [22,23].
The Particle Finite Element Method (PFEM) is a third continuum-based approach that seems suitable to address geotechnical insertion problems. PFEM is actually an updated Lagrangian approach, but one that avoids mesh distortion problems by frequent remeshing. The nodes discretizing the analysis domain are treated as material particles the motion of which is tracked during the numerical solution. Remeshing in PFEM is based in Delaunay tessellations and uses low-order elements. PFEM was first developed to solve fluid-structure interaction problems [24,25,26,27,28] and then extended to other areas, like solid-solid interaction and thermo-plastic problems [29,30], erosion problems [26], and Bingham-like rheology models to simulate flowslides [31].
Carbonell et al. [32,33] first applied PFEM to geomechanical problems, extending the method to deal with tool-rock interaction problems in small and large scale excavations. In their work, however, material removal at the interface, rather than tool insertion was the focus. The excavated material was treated as a single-phase solid using a damage law as a constitutive model.
Zhang et al. [34,35,36] presented a new PFEM implementation for granular flow applications, using a variational theorem to discretize the governing equations. A single-phase rigid plastic constitutive description of the soil was employed. An example of pipeline insertion into a Tresca soil was presented in [34], however most applications have focused on soil flow problems [35,36].
1.2 Aim and objectives
This work focus on developing a numerical framework capable of simulating insertion problems found in Geotechnical Engineering.
The starting point of this work is an implementation of the Particle Finite Element method (PFEM) in the numerical platform Kratos Multiphysics (Kratos Multiphysics; Carbonell et al., 2010, 2013, 2015; Dadvand et al, 2010; Rodriguez et al, 2016, 2017,a,b); this code is able to simulate the contact between multiple deformable bodies employing classical Solid Mechanics formulations and constitutive equations describing metals. As such, from a numerical point of view, the basic objectives of this work are:
- Implement a coupled hydro-mechanical formulation at large strain.
- Develop and implement a robust and accurate explicit stress integration algorithm for elasto-plastic models at finite strain.
- Incorporate geotechnical interface models to the contact algorithms.
- Mitigate the volumetric locking of low-order elements for the one-phase and coupled hydromechanical formulations.
Regarding geotechnical knowledge:
- Assess the effect of the cutting shoe-geometry, wall thickness and contact roughness in the deformation path of tube sampling problems.
- Enhance the knowledge on the cone penetration test by analyzing the influence of permeability and contact roughness on the cone readings and subsequent dissipation.
1.3 Outline of the monograph
This work is organized in 10 chapters, from which the first and last one are dedicated to the introduction and conclusions, respectively. Chapter 2 presents a general overview of the computational framework; several numerical novelties are presented from Chapter 3 to 5. The geotechnical applications of the developed numerical scheme are presented in Chapters 6 to 9.
In particular, this work is organized as follows:
Chapter 2 discusses the basis of the numerical model employed on the present work. First, the basic features Particle Finite Element method (PFEM) are described; additionally, PFEM is compared with other well-established codes used in Geotechnical Engineering. After briefly describing some basic results of non-linear Solid Mechanics, the balance equations for the one-phase problem and coupled-hydromechanical simulations are presented. The finite element method is applied to discretize the spatial domain employing an Updated Lagrangian formulation whereas completely implicit time-marching schemes are used.
Chapter 3 is devoted to the numerical treatment of constitutive models at large strains. After revising the large strains elasto-plastic theory based on a multiplicative split of the deformation in an elastic and plastic part, a novel explicit scheme is proposed. This chapter also presents the constitutive models employed in this work.
The numerical procedures to impose the contact between a deformable body and a rigid object are described in Chapter 4. Contact constraints are imposed to the solution by the Penalty method. To describe the tangential part of the contact model the so-called elasto-plastic analogy is used; two-different algorithms to integrate this model are employed: an implicit algorithm that has the same formal structure than the one-dimensional return mapping and one based on the Implex algorithm.
The low order finite elements typically employed in PFEM suffer from severe volumetric locking when the material shows a quasi-incompressible response. In Chapter 5 several mixed stabilized formulations to mitigate locking for the one-phase mechanical problem and the coupled hydro-mechanical problem at large strains are presented.
Chapter 6 presents the first application, the total-stress analysis soil-structure insertion problems in geomechanics. In particular, this chapter presents several analysis of increasing complexity; namely, the insertion of a rigid strip footing, the T-Bar and a rough cone penetration test. These three problems have been frequently as benchmark problems to assess the robustness and accuracy of large-strain geotechnical codes; thus, allows to compare the performance of the developed numerical scheme with other techniques.
Chapter 7 describes a series of simulations of the tube sampling process in clay materials using a total stress approach. In particular, a parametric analysis of the problem, in which several sampler geometries, constitutive parameters and interface behaviors are analyzed. Additionally, the occurrence of a plug is assessed in terms of the theory proposed by [1].
Chapter 8 shows the possibilities of the developed numerical scheme to simulate insertion problems unsing a coupled hydromechanical approach. The scheme is first assessed in the loading and dissipation of a footing resting in a poroelastic medium. Afterwards, results of the most challenging cone penetration test in a wide range of hydraulic conditions (ranging from practically undrained to drained) and using (tip and shaft) rough interfaces are presented. Details of the effect of these two parameters to the CPTu reactions (cone resistance, water pressure at the , and sleeve resistance) are given.
Several methods have been proposed to obtain the permeability or the coefficient of consolidation from CPTu readings. In Chapter 9, simulation outputs obtained for different input constitutive parameters and permeabilities are examined to obtain direct estimates of permeability using different methods proposed in the literature; additionally, methods to estimate the hydraulic conductivity during the piezocone penetration are also used. These estimates are then compared with the known input permeability value to assess their reliability.
Finally, in Chapter 10, the main outputs of this work are summarized, a number of conclusions are drawn and ideas for future enhancements and developments are enumerated.
This monograph also includes several appendices:
Appendix A presents a Matlab file to perform symbolic operations. In particular, this code is used to obtain an estimate for the stabilization parameter for the one-dimensional element with linear (equal-order) shape functions.
Appendix B analyzes the effect of the input values of the [42] hyperelastic model and later modified by [43] on the material response.
The linearization of the mixed formulations introduced in Chapter 5 are presented in Appendix C.
The analysis of closed-ended piles and the bearing capacity factor of tubes, a by-product of Chapter 7, are presented in Appendix D.
Some of the simulations of Chapter 8 are recalculated in Appendix E using slightly different input values of the hyperelastic model to assess its effect in a boundary value problem. The sets of employed constitutive parameters are first described, from a elementary point of view, in Appendix B.
Finally, in Appendix F, results of three-dimensional analysis are reported. In addition, in this appendix, the hyper-elastic plastic and hypo-elastic plastic constitutive models are compared in a number of representative numerical simulations.
1.4 Publications
This monograph, which contains some unpublished material, is based on the following publications wherein some ideas and figures have appeared previously.
Publications in journals:
- Monforte, L., J. M. Carbonell, M. Arroyo & A. Gens (2017). Performance of mixed formulations for the particle finite element method in soil mechanics problems. Computational Particle Mechanics. 4(3):269-284.
- Monforte, L., M. Arroyo, J. M. Carbonell & A. Gens (2017). Numerical simulation of undrained insertion problems in geotechnical engineering with the Particle Finite Element Method (PFEM). Computers and Geotechnics. 82:144-156.
- Monforte, L., M. Arroyo, J. M. Carbonell & A. Gens (2018). Coupled effective stress analysis of insertion problems in geotechnics with the Particle Finite Element Method. Computers and Geotechnics. 101:114-129.
- Monforte, L., M. Arroyo, J. M. Carbonell & A. Gens (2018). Hydraulic conductivity from CPTu on-the-fly: a numerical evaluation. Géotechnique Letters. 8(4) doi.org/10.1680/jgele.18.00108.
Pubications in conference proceedings:
- Monforte, L., M. Arroyo, A. Gens & J. M. Carbonell (2014). Explicit finite deformation stress integration of the elasto-plastic constitutive equations. In The 14th International Conference of the International Association for Computer Methods and Advances in Geomechanics (14IACMAG).
- Monforte, L., M. Arroyo, A. Gens & J. M. Carbonell (2015). Integration of elasto-plastic constitutive models in finite deformation: an explicit approach. In XII International Conference on Computational Plasticity. Fundamentals and applications.
- Monforte, L., J. M. Carbonell, M. Arroyo & A. Gens (2015). Numerical simulation of penetration problems in geotechnical engineering with the particle finite element method (PFEM). In IV International Conference on Particle-based Methods – Fundamentals and applications.
- Monforte, L. (2016). Numerical analysis of penetration problems in clay with the Particle Finite Element Method. In 25th European Young Geotechnical Engineers Conference.
- Gens, A., M. Arroyo, J. Butlanska, L. Monforte, J. M. Carbonell, M. Ciantia & C. O'Sullivan (2016). Simulation of the cone penetration test: discrete and continuum approaches. In 5th International Conference on Geotechnical and Geophysical Site Characterization.
- Gens, A., M. Arroyo, J. M. Carbonell, M. Ciantia & L. Monforte (2017). Simulation of penetration problems in geomechanics. In 15th International Conference on Computational Plasticity - Fundamentals and Applications.
- Monforte, L., M. Arroyo, A. Gens & J. M. Carbonell (2017). G-PFEM: a Particle Finite Element Method platform for geotechnical applications. In Alert Workshop.
- Monforte, L., M. Arroyo, A. Gens & J. M. Carbonell (2018). Numerical study of penetration problems in fine grained soils with the Particle Finite Element Method. In 4th International Symposium on Computational Geomechanics.
- Monforte, L., M. Arroyo, A. Gens & C. Parolini (2018). Permeability estimates from CPTu: a numerical study. In CPT’18 – International Symposium on Cone Penetration Testing.
- Monforte, L., M. Arroyo, A. Gens & J. M. Carbonell (2018). Three-dimensional analysis of penetration problems using G-PFEM. In 9th NUMGE Conference on Numerical Methods in Geotechnical Engineering.
2 Numerical model
This chapter is devoted to present the basics of the numerical model. First, the Particle Finite Element Method, the computational method used in this work, is presented. Subsequently, some basic definitions and results of continuum mechanics that will be latter used for the development of the governing equations are reviewed. Finally, the finite element formulation for the single-phase and the coupled fluid-saturated porous media at large strain is presented.
2.1 Particle Finite Element method
The Particle Finite Element Method (PFEM) is a numerical method well suited for mechanical problems involving large displacements, large deformations, intermittent separation and/or fusion of bodies. Soft porous materials, such as soils, suffer these kinds of mechanical transformations during many activities of engineering interest. Relevant examples for the case of soils include probing, sampling, pile installation, excavation and ploughing.
PFEM originated to address problems of fluid mechanics [24,25,26,27,28], including those of fluid interaction with rigid bodies. Later it was extended to deformable single-phase solids [29,44] and to the contact between multiple deformable bodies in thermo-plastic problems [30,40,41]. Subsequently, several PFEM extensions have addressed geomaterials: Carbonell et al. [32,33] used PFEM to simulate ground excavation problems. The interaction between soil and structures has been also simulated using hypoplastic formulations to describe the constitutive behavior of soft soils [45]. Flow-like landslides have been also studied using PFEM, but considering a single-phase material description: [36] employed a rigid plastic constitutive response for the soil whereas [31] used a non-Newtonian modified Bingham law. Larese et al. [46] presented a strategy to simulate the free surface flow over and throughout a rockfill; PFEM is adopted for the evaluation of the structural response, whereas an Eulerian fixed-mesh approach is employed for the fluid.
In PFEM the continuum is modelled using an Updated Lagrangian formulation; that is, a Lagrangian description of the motion is used and all variables are referred to the last known configuration. A mesh discretization of the domain is generated in order to solve the governing equations in the standard FEM fashion. Nodes in that mesh are treated as material particles whose motion is tracked during the solution.
The quality of the numerical solution depends on the discretization chosen. The original idea of the PFEM was to improve the mesh quality by performing a re-triangulation of the domain only when needed. Usually that is performed according to some criteria associated with element distortion. Mesh distortion is corrected and improved naturally with the Particle Finite Element Method (PFEM), because re-triangulation is based on Delaunay tessellations that maximize the minimum angle of all the triangles in the tessellation. Therefore, thin, stretched elements are avoided while still capturing large changes in the continuum domain without global remeshing and mesh to mesh interpolation. The process can be easily extended to 3D using tetrahedral elements.
Additionally, h-adaptive techniques are employed to obtain a better discretization of the domain. New particles are introduced in areas where large gradients in the flow variables are detected or where a high plastic dissipation is generated. These zones must be refined because the number of particles may become too low to obtain an accurate solution. On the contrary, due to high shear deformations, particles may locally concentrate in the same region of the domain. To overcome this difficulty particles that are closer than a characteristic distance are removed.
Conforming meshes are used to preserve mass in the remeshing process: the boundary of the domain remains unchanged so the volume of the discretization does not vary. The mass of the domain also depends on the density and thus on the transfer process of Gauss point variables. This, however, is relatively unimportant for soil applications, since highest mesh distortion is usually associated with shearing and the attainment of incompressible critical state conditions.
Although it is not strictly necessary (see [34,35,36]), low order finite elements are typically used in PFEM: linear triangles in two-dimensional models and linear tetrahedron in three dimensions. Linear interpolated elements have several advantages due to their simplicity: particles usually define exclusively the mesh nodes and no extra interpolations are needed after remeshing. Also, the computational cost is lower compared to high-order elements. A relative drawback is that stabilized mixed formulations are generally required instead.
The interpolation of state variables plays a crucial role in the accuracy of the results. When new particles are inserted in the domain, flow variables are linearly interpolated from those of the previous mesh element. To avoid excessive smoothing of internal variables, information is transferred directly from the previous Gauss points to the new ones. In this work, two different interpolation procedures for Gauss point variables are used. The first method is a nearest interpolation procedure; hence, new integration points inherit the information of the closes Gauss point of the previous mesh. In the second method, internal variables are interpolated over the whole domain and the values at the new integration points are obtained by employing a least square approach [47,48]. Both strategies ensure that information is not altered in elements that are preserved during the meshing process. These strategies are described in Section 2.1.1.
A typical solution algorithm of PFEM is conceptually illustrated in Figure 1 for a general case of fragmentation and deformation of a solid mass under the action of an external object; note, however, that fracture is not considered in this work. For clarity purposes we will define the collection or cloud of nodes (C) belonging to the analysis domain, the volume (V) defining the analysis domain and the mesh (M) discretizing the domain.
The simulation involves the following steps [24]:
- Begin the computation of each time step with a cloud of points defining the analysis domain. For instance denotes the cloud at time , see Figure 1.
- Identify the boundaries defining the analysis domain . This is an essential step as some boundaries may be severely distorted during the solution and, conceptually, may include separation and re-entering of nodes. The domain boundary may be identified with the method [49] or that of the previous step, using conforming meshes.
- Discretize the continuum domains with a finite element (FE) mesh .
- Solve the Lagrangian equations of motion in the domain. Compute the state variables at the next (updated) configuration for : displacements, pressure, water-pressure, strains, stresses and internal variables, etc.
- Move the mesh nodes to a new position where denotes the time , in terms of the time increment size. This step is typically a consequence of the solution process of step 4.
- Go back to step 1 and repeat the solution process for the next time step to obtain .
Further details of the numerical implementation can be found in [32,33,38] and [30,40,41].
PFEM has some similitudes with other well established methods used in geomechanics, particularly variants of the Arbitrary Lagrangian-Eulerian approach: the so-called Efficient Aribtrary Lagrangian-Eulerian (EALE) developed by [12,13] and the remeshing and interpolation technique by small strain (RITSS) [9,10]. A fundamental difference with EALE lies on mesh treatment. On one hand, in EALE, the number of nodes, elements and the topology of the Finite Element mesh are preserved during the analysis: that is, between solution steps the bounday and interior nodes are recolocated computing a complementary elastic problem [12]. On the contrary, the original idea of PFEM is to minimize nodal position changes during computation while constantly updating mesh topology using a Delaunnay's Tesselation. Later, to reduce the dependence of the solution on the initial discretization, additional adaptive techniqueds have been introduced: (i) insertion and removal of nodes based on plastic dissipation and (ii) improving the mesh quality through Laplacian smoothing [33,30]. Despite these new features, modification of original nodal position in PFEM remains relatively infrequent.
The remeshing aspects of PFEM makes it closer to RITTS, particularly in its first implementations [9,50]. These periodical remeshing was also taking place using retriangulation, -adaptive techniques and mesh smoothing. The algorithmic details are, however, different, particularly in respect to retriangulation. The degree of adaptivity of some newer versions of RITSS, that rely on Abaqus for mesh generation is perhaps more limited, as the role of users experience was emphasized by [19]. The algorithms employed for transfer of informaiton between successive meshes in PFEM are also different from those employed in RITSS.
Another significant difference is that whereas both RITSS and EALE use high-order elements to solve the governing equations (quadratic elements in RITSS and quadratic and higher in EALE); in PFEM linear elements are typically used. This, however, is not the only possible choice: Zhang et al. [34,35,36] used mixed elements with high order interpolants.
Other differences between the code presented here and previous approaches may also be a matter of choice, for instance early implementation of RITSS relied on small strain finite element formulations, but there is no major obstacle for it.
A comparative review of these two ALE methods along with the Coupled Eulerian-Lagrangian has been recently presented by [19]. In a set of benchmark problems, the results of RITSS and EALE agreed very well with each other, suggesting that differences adopted in the remeshing part of the code provide similar accuracy.
2.1.1 Mapping between evolving meshes
One of the main difficulties encountered in adaptive methods is the transfer of information between different discretizations [51,52]. In PFEM information is transferred between the previous mesh and the newly constructed one at every remeshing stage. Nodal variables (displacements, mean pressure, water pressure, ...) are mapped into the new mesh using the previous mesh shape functions.
Note that for the relatively simple constitutive models employed here (that are presented in Chapter 3), the only internal variables that need mapping are the elastic left Cauchy Green tensor -that, through the hyperelastic model uniquely determines the Cauchy Stress tensor- and plastic history variables.
Two different transfer operators have been used. The algorithms selected share a common trait: when an element of the old mesh is preserved, the new value of the variable coincides with the value on the previous mesh. The first method consists simply on copying to each element of the new mesh the information of the element of the previous mesh whose centroid is nearest to the centroid of the new element. In the second strategy, a least square interpolation procedure is used [47]: let and be some internal variable in the new and previous mesh; a piecewice constat interpolation of these variables over the whole domain is constructed, and , where the interpolation functions and are equal to the unity in elements and of the new and old mesh and zero elsewhere.
The value of the internal variable in the new mesh is computed solving the following problem:
|
|
(2.1) |
After carrying out the minimization, the following explicit expression is found for the new value of the internal variable for one integration point elements:
|
|
(2.2) |
Therefore, the value of the internal variable on an element of the new mesh is the mean value of the variable of the elements of the previous mesh that overlapped that position, averaged by the area of overlapping. This algorithm is implemented using the super-mesh concept developed by [48].
Only the first transfer algorithm (nearest point interpolation) ensures that the new state is admissible (using the second algorithm, the stress state may be outside of the yield surface); none of the two guarantee that the deformable body is in equilibrium. The first problem is directly tackled applying a yield surface drift correction algorithm if the stress state lies outside the yield surface. Possible errors due to out-of-balance forces after remeshing are ignored and a time-step is advanced before mechanical equilibrium is again imposed.
These two algorithms are numerically assessed and compared in Section 6.2, that presents the results of the simulation of a rigid strip footing on clay employing a total stress approach. It is found that effect of the interpolation technique on the results is limited; thus, the nearest element interpolation is selected in the majority of the simulations due to its relatively smaller computational cost.
2.2 Continuum mechanics
The objective of this section is to review some basic definitions and results of nonlinear continuum mechanics needed for the development of the formulation of the balance equations for the single-phase mechanical problem, the coupled hydro-mechanical problem and then the formulation of the elasto-plastic constitutive equations. Extended details may be found in [53,54,55], among others.
2.2.1 Motion and deformation
Description of motion and time derivatives
Let define the reference configuration of a continuum body and a particle of this body is labeled by . The position of this particle at time is:
|
|
(2.3) |
where is the mapping from the initial configuration to the current one. Let us define now the displacement of a material point as the difference between the current position and its original position. The displacement vector, , can be written as:
|
|
(2.4) |
The material velocity and material acceleration, denoted by and respectively, are defined as:
|
|
(2.5) |
|
|
(2.6) |
Meanwhile, a spatial or Eulerian description is also possible:
|
|
(2.7) |
|
|
(2.8) |
where the first term is known as the local derivative and the second one is the convective time derivative.
2.2.1.2 Description of deformation
![Sketch of the reference and current configuration of a deformable body [56].](/wd/images/thumb/b/bd/Draft_Content_325409517-monograph-OliverAgelet.png/480px-Draft_Content_325409517-monograph-OliverAgelet.png)
|
| Figure 2: Sketch of the reference and current configuration of a deformable body [56]. |
The deformation gradient, , is the Jacobian matrix of the motion:
|
|
(2.9) |
To further illustrate the deformation gradient, let us consider two different particles, and in the reference configuration, whose infinitesimal relative position in the reference configuration is , see Figure 2. Then, the relative position in the deformed configuration, , may be obtained as:
|
|
(2.10) |
Furthermore, a differential volume in the reference configuration, , is related to the same differential volume in the deformed configuration, , as:
|
|
(2.11) |
where the Jacobian determinant is frequently referred to as the Jacobian: .
Considering a differential of area in the reference configuration, , where is the unit normal, the following expression for the transformation is given by Nanson's formula:
|
|
(2.12) |
Several deformation measures are used in non-linear continuum mechanics. Two of the most common ones are the right Cauchy-Green tensor, , and the left Cauchy-Green tensor, :
|
|
(2.13) |
|
|
(2.14) |
where the first one is defined in the reference configuration whereas the second one is defined in the deformed configuration. In the initial state or in the absence of deformation, , both deformation measures are equal to the identity tensor.
According to the polar decomposition theorem, the deformation gradient may be decomposed multiplicatively into a stretching and a rotational part:
|
|
(2.15) |
where is a proper orthogonal tensor, called the rotational tensor, and and are two symmetric positive definite tensors. These tensors fulfill the following properties:
|
|
(2.16) |
where and are, respectively, the right and left Cauchy-Green tensors. The eigenvalues of and are coincident, whereas its eigenvectors differ:
|
|
(2.17) |
where are the eigenvalues of and , also known as principal streches, whereas and are the eigenvectors of and respectively.
Taking into account the decomposition of the previous tensors, both Cauchy-Green tensors may be redefined as:
|
|
(2.18) |
Rate of deformation tensor
Let us start by computing the rate of the deformation gradient, Equation 2.9:
|
|
(2.19) |
that is, the time derivative of the deformation gradient is equal to the material velocity gradient, .
Applying the chain rule to the previous expression:
|
|
(2.20) |
then, the spatial velocity gradient, , may be obtained as:
|
|
(2.21) |
In the development of finite element stiffness matrices and in the constitutive equations, the temporal derivative of several strain measures will be employed. For instance, the temporal derivative of the right Cauchy-Green tensor may be useful:
|
|
(2.22) |
where is the spatial rate of deformation tensor.
The temporal variation of the Jacobian determinant is:
|
|
(2.23) |
Description of Strain
To define the Green-Lagrange strain and the Almansi strain, let us compute the variation of length of the segment of Figure 2:
|
|
(2.24) |
From this previous expressions, the Green-Lagrange strain, , and the Almansi strain, , are defined as:
|
|
(2.25) |
In terms of the eigenvectors and eigenvalues of the left and right Cauchy-Green tensors, Equation 2.18, these strains may be obtained as:
|
|
(2.26) |
The unit elongation along a direction or is:
|
|
(2.27) |
Consequently, the unit elongation may be further related to the Green-Lagrange and Almansi strain tensors through the following expression:
|
|
(2.28) |
The definition of the stretch has already appeared without a proper definition, for instance in Equation 2.17. The stretch along an arbitrary direction, , is related to the unit elongation through:
|
|
(2.29) |
Another popular strain measure is the (spatial) Hencky strain:
|
|
(2.30) |
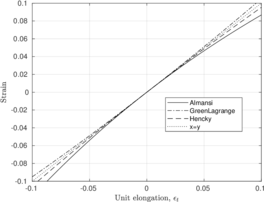
|
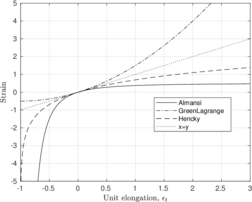
|
| (a) | (b) |
| Figure 3: Comparison of the Almansi, Green-Lagrange and Hencky strain in terms of the unit elongation in the small strain range, (a), and at finite strain range, (b). | |
In order to compare all these strain measures, Figure 3 depicts the dependency of these strain measures in terms of the unit elongation for a one-dimensional medium. In the small strain regime (unit elongations below 10 %), all these strains agree well and predict similar strain values (Figure 3(a)). However, discrepancies appear at the large deformation regime: as noted by its definition, Equation 2.26, the maximum value in extension of the Almansi strain is 0.5. On the other hand, the maximum value in compression of the Green-Lagrange strain is -0.5. Potentially, the Hencky strain may take any real value.
The former observations are restricted to one-dimensional cases. It should be noted that in a general three-dimensional continuum, the Almansi and the Hencky strain share eigenvectors, that are different from those of the Green-Lagrange tensor. By definition, the Green-Lagrange tensor assumes a material description and, thus, acts to an element defined in the reference configuration. On the contrary, the other two strain tensors have an spatial description and acts to an element of the deformed configuration [56].
2.2.2 Stress measures
Stress measures
There exist a large number of stress measures. The most intuitive one is the Cauchy stress tensor, , that is defined in the current deformed configuration . The relation between the traction vector, , and the surface normal vector, , is:
|
|
(2.31) |
From the local balance of angular momentum, it can be obtained that the Cauchy stress tensor is symmetric.
The Kirchhoff stress tensor, , is also symmetric and defined in the current configuration. One reason for its use is that, in many equations, the Cauchy stress appears together with the Jacobian and the use of it simplifies formulas:
|
|
(2.32) |
To define the Second Piola-Kirchhoff stress tensor, , let us express the force acting on a differential of area:
|
|
(2.33) |
performing a pull-back of the force and introducing the Nanson's formula:
|
|
(2.34) |
which leads to the definition of the Second Piola-Kirchhoff as:
|
|
(2.35) |
that is a symmetric stress tensor defined in the reference configuration.
Temporal derivatives of stress measures
The time derivative of stress tensors is of significance for the statement of incremental forms of constitutive equations. For the second Piola-Kirchhoff, that is referred to the initial configuration, the derivative with respect to time is given by the material time derivative:
|
|
(2.36) |
However, the temporal derivative of stress tensors related to the deformed configuration are more complex. For instance, the derivative of the Cauchy stress tensor reads:
|
|
(2.37) |
2.2.3 Objective transformation
This section is devoted to frame indifference and objective transformation. Although the discussion of which deformation measures and stress measures transform objectively seems quite arid and unmotivated, the importance of the previous discussion will become apparent in the chapter devoted to constitutive relations (Chapter 3), that need stress and strain measures independent of rigid body motions.
A spatial tensor field is said to transform objectively under superposed rigid body motions if it transforms according to the standard rules of tensor analysis [53].
Given a motion , a superposed rigid motion of the current place is the map defined as:
|
|
(2.38) |
where is a function of time and is a proper orthogonal transformation depending only on time. The superposed motion is called rigid because, for any given two points , , the following property holds
|
|
(2.39) |
in other words, the mapping preserves the distances.
Thus, the deformation gradient becomes:
|
|
(2.40) |
Then, the left Cauhy-Green tensor, Equation 2.14, reads:
|
|
(2.41) |
which transforms objectively.
On the contrary, material objects remain unaltered to the superposed rigid body motions; for instance, the right Cauchy-Green tensor, Equation 2.13:
|
|
(2.42) |
The spatial velocity gradient, Equation 2.21 is given by:
|
|
(2.43) |
which does not transform objectively because of the additional last term. However, its symmetric part, the rate of deformation tensor, transforms objectively since:
|
|
(2.44) |
Demonstrating that the Cauchy stress tensor is objective is quite straightforward: on physical grounds, it is natural to postulate that the tractions are objective, whereas unit outward normal is objective, . Then:
|
|
(2.45) |
it follows from the previous expression that . Since this equation holds for any normal, it follows that:
|
|
(2.46) |
that is, the Cauchy stress tensor transforms objectively.
However, the temporal derivative of the Cauchy stress tensor is not objective:
|
|
(2.47) |
that is clearly non-objective since it is not equal to .
Several objective rates of the Cauchy stress and the Kirchhoff stress tensor -that is, modified time derivatives constructed to preserve objectivity- have been proposed in the literature. Among others, one that will appear repeatedly in this text is the Lie Derivative, that is defined as:
|
|
(2.48) |
using the expression of the derivative of the inverse and arranging some terms:
|
|
(2.49) |
2.3 Single-phase mechanical media
In this section, the formulation for the single-phase mechanical problem is presented. The section starts by enunciating the governing equation -the linear momentum balance equation- in an Updated Lagrangian fashion. After briefly describing the weak form, the balance equation is discretized with low order shape functions and an implicit time-stepping algorithm. The non-linear system of equations is solved with a Newton-Raphson method; thus, the required linearization is derived.
2.3.1 Strong form of the balance equations
A quasi-static linear momentum formulation in an updated-Lagrangian form (i.e. expressing all quantities and their derivatives in the deformed configuration), may be written as:
|
|
(2.50) |
where is the Cauchy stress tensor, stands for the appropriate constitutive equation for path dependent materials (large strains elasto-plastic constitutive equations based on the multiplicative split [57] are used here, see Chapter 3), is the total deformation gradient and represents the set of internal variables of the model. stands for the initial displacement, is the external body force vector, is the gravity vector and () defines the boundary of the domain where displacements and tractions are prescribed.
Meanwhile, the mass conservation principle requires that the mass of the continuous media domain remains constant. The mass balance equation in its Lagrangian form reads:
|
|
(2.51) |
Finally, the local balance of angular momentum yields that the Cauchy stress tensor is symmetric:
|
|
(2.52) |
2.3.2 Weak form
The derivation of the weak form of the problem defined in Equation 2.50 starts by multiplying the local balance equation by a test function, , and integrating it in the domain:
|
|
(2.53) |
Integrating by parts the term related to the Cauchy stress gradient, applying the divergence theorem, introducing the Neumann boundary conditions and using index notation yield:
|
|
(2.54) |
This equation coincides, in a formal sense, with that obtained in the infinitessimal strain theory. However, using in the large deformation theory, stress and virtual strains have to be evaluated with respect to the current configuration. Additionally, it is integrated over the deformed configuration. As such, the non-linearities do appear, however, they are hidden.
2.3.3 Finite element discretization
In order to obtain the finite element discrete equations of the weak form, first the nodal variables are approximated with the Finite Element shape functions
|
|
(2.55) |
where is the finite element approximation of displacement whereas are the nodal values. are the shape functions whereas is the number of nodes. The same procedure is used to discretize the test functions, .
As such, the problem is then: Find the function such that:
|
|
(2.56) |
Since are arbitrary, from the previous expression independent equations may be obtained, where is the number of spatial dimensions of the problem. As such, the matrix form of the Galerkin weak form is:
|
|
(2.57) |
where the internal and external forces read:
|
|
(2.58) |
|
|
(2.59) |
where has the same formal structure than the small deformation strain-displacement matrix [58] and corresponds to the Voigt notation of tensor .
2.3.4 Temporal discretization
As already mentioned, a quasi-static loading is assumed, so that inertial terms have been neglected. Then, the Galerkin form of the linear momentum balance equation, Equation 2.57, is time independent. Then, the global problem may be directly stated, for time , as: find such that:
|
|
(2.60) |
2.3.5 Linearization
Equation 2.60 defines a non-linear system of equations, whose residual is given by:
|
|
(2.61) |
where the superscript is obviated for simplicity. Then, to evaluate numerically the solution, an iterative non-linear solver is required. In this work, the Newton-Raphson method is used. Writing an iterative correction as:
|
|
(2.62) |
where the subscript stands for the number of iteration. Using a Taylor's approximation of the residual, Equation 2.61,
|
|
(2.63) |
where is the so-called tangent or Jacobian matrix, that is defined as:
|
|
(2.64) |
Assuming that is null, the iterative correction, , is given by the following system of linear equations:
|
|
(2.65) |
It is worth noting that the term may be also obtained by using the directional or Gateaux derivative along the direction [54]. That is:
|
|
(2.66) |
Let us linearize the governing equations of the problem, Equation 2.60. However, instead of working on the discrete set of equations, which appear after the introduction of the finite element discretization, let us work with the continuum counterpart 2.54. In the case of elastic materials, the linearization of the discrete equations and the discretization of the linearization of the continuum equations are equivalent [57,54]. However, when inelastic materials are considered, both forms are no longer equivalent: in the first approach the material constitutive tensor depends upon the stress integration algorithm (the so-called consistent tangent matrix) whereas in the second approach the Jacobian matrix depends on the continuum constitutive tensor. As such, using the consistent constitutive matrix, second order convergence in the solution of the global problem may be achieved; thus, virtually representing a saving of computational time.
In order to linearize the discrete equation of the balance of linear momentum, Equation 2.54, let us first work with the internal forces term. First, a pull-back of the internal forces term is performed; this way, all the quantities are referred to the reference configuration:
|
|
(2.67) |
Then:
|
|
(2.68) |
Then, a push-forward of this expression yields:
|
|
(2.69) |
where the directional derivative of the deformation gradient, , is expressed as:
|
|
(2.70) |
whereas the term related to the second Piola-Kirchhoff may be related to the Lie derivative of the Kirchhoff stress and, also, to the spatial constitutive tensor:
|
|
(2.71) |
where is the spatial constitutive tensor.
So finally,
|
|
(2.72) |
where .
Surprisingly, the terms related to the external loads are typically not linearized; however, as it will be shown here, the term due to the prescribed tractions may induce a geometrical non-linear term.
|
|
(2.73) |
The pull-back of the term related to the gravitational loads reveals that there is no dependency on the displacements; that is
|
|
(2.74) |
![Convective coordinates on a parametrized surface. [59].](/wd/images/thumb/e/e9/Draft_Content_325409517-monograph-Wriggers_Convective.png/360px-Draft_Content_325409517-monograph-Wriggers_Convective.png)
|
| Figure 4: Convective coordinates on a parametrized surface. [59]. |
On the other side, a pull-back of the term related to the imposed tractions, making use of a parametrized description of the boundary, see Figure 4, reads:
|
|
(2.75) |
where . By using the chain rule, this term reads:
|
|
(2.76) |
According to [59], this directional derivative may be expressed as:
|
|
(2.77) |
where .
Finally, introducing the expression 2.77 to 2.76 and performing a push-forward:
|
|
(2.78) |
Roughly speaking, this term stands for the variation of the virtual work associated to the variation of area and direction of the contour where tractions are imposed. Although it has not been explicitly stated, it is assumed that the imposed traction is independent of the boundary. To exemplify this fact, let us assume that an external load is imposed in an area at the initial state; then, the imposed force, is equal to . Assuming that the body deforms but the normal to the surface where Neumann condition remains unaltered (), the area of the surface is and the total applied load at the Neumann boundary is . As such, the force in the Neumann boundary varies; since it has been assumed that the traction that is applied at the boundary is independent of the deformation of the body. Of course, this is a modeling decision and other options are possible.
Finally, the matrix form of these expressions is obtained by inserting the definition of the virtual dispalcements and the displacements, Equation 2.55:
|
|
(2.79) |
where the terms involed in the computation of the nonlinear stiffness matrix, and , may be described, for two dimensional analysis, as [60,54]:
|
|
(2.80) |
|
|
(2.81) |
where is the derivative of the local shape function 1 with respect to coordinate 1 and is the deformed radial coordinate. It should be noted that the expressions provided in Equations 2.80 and 2.81 are particularized for a two-dimensional axisymmetric case. For a plane-strain situation, only the first four columns in Equation 2.80 and the first four columns and rows in Equation 2.81 should be considered. The definition of these matrices for a three-dimensional analysis may be found in [60].
2.4 Two-phase hydro-mechanical problem
The mechanics of porous media is relevant in a broad range of engineering applications. Several models have been proposed under the small strains assumption, that slightly differ in the treatment of the dynamic terms of the formulations, see, for instance, the so-called (solid displacement-Darcy's velocity-water pressure) and the simplified of [61]. The governing equations have been obtained by a broad range of theories, from physical approach to mixture theory, but identical equations are found irrespectively of the method to derive them.
The extension of the poro-mechanical problem at large strains can be traced back to [62], that proposed a three dimensional finite element formulation for consolidation problems; finite strains constitutive models based on a Jaumann rate description were used.
Borja and Alarcón [63] developed a formulation based on the mixture theory combined with the volume fraction concept, where the constituents are considered incompressible. Constitutive models are described using a multiplicative decomposition of the deformation gradient in an elastic and plastic part.
An important extension of the formulation is due to [64], that introduced the fluid compressibility in terms of a volumetric logarithmic strain, a measure that is energy conjugated to the fluid pressure; then a free energy function for the fluid phase is defined. By doing so, the formulation is able to model the porous medium at nearly saturated conditions.
In this section, the computational framework for the analysis of fluid-saturated porous media is presented. First, the governing equations -the linear momentum and mass balance equations of the mixture- are derived at large strains. After discretizing the equations using the finite element method in space and a totally implicit time-integration algorithm, the consistent linearization required for the non-linear solver is presented. Finally, the methods to stabilize the formulation are highlighted; this includes a novel technique to estimate the value of the stabilization parameter for hydro-mechanical problems.
2.4.1 Mass balance equation
In this subsection the equation for the mass balance of the mixture is derived.
Let and be the density of the solid particles and the fluid, respectively, and the porosity in the current configuration. Then, the mass of solid and liquid, and , in an arbitrary deformed domain, , may be defined by the following integrals:
|
|
(2.82) |
Assuming that the mass is conserved along a material volume, then material derivative of the integral is null:
|
|
(2.83) |
where and are the material derivatives with respect to the solid and fluid phase and and are the solid and fluid velocities.
Note that in the previous expression the solid (or skeleton) phase is used as a reference frame for the porous media as a whole. As such, all the quantities are referenced to this configuration, leading to a modified Eulerian description of the fluid motion. Then, all the spatial gradients are taken with respect to the solid phase motion.
Since integration takes place in an arbitrary volume, rearranging terms and introducing the definition of the material derivative with respect to the solid phase, , the last expression may be recasted as:
|
|
(2.84) |
where the Darcy velocity has been introduced: .
Expanding the derivatives and dividing by the density, the following expressions may be obtained:
|
|
(2.85) |
Finally, the following expression for the mass conservation of the porous media is obtained summing both equations:
|
|
(2.86) |
Compressibility of the constituents
In the rest of the document it is assumed that the solid particles (the grains) are incompressible:
|
|
(2.87) |
In order to define a constitutive model for the fluid, Larsson and Larsson [64] introduced a logarithmic strain for each constituent, that, for the case of the fluid constituent reads:
|
|
(2.88) |
where is a reference fluid density.
Based on thermo-mechanical considerations, Larsson and Larsson [64] proposed several constitutive models relating the (Cauchy) water pressure and the logarithmic strain. The simplest model is to assume that the water pressure is proportional to the logarithmic volumetric strain:
|
|
(2.89) |
where is the water bulk modulus.
As a consequence:
|
|
(2.90) |
Darcy's law
Several extensions of the Darcy's Law at large strains have been proposed. For instance, Borja and Alarcón [63] proposed to postulate the Darcy's Laws as:
|
|
(2.91) |
where is the Kirchhoff water pressure, is the permeability tensor, is the gravity and . This is done since, in the referred work, the Kirchhoff water pressure is a nodal variable and because, accidentally, it is assumed that , which, in the general case, is not true.
On the other hand, in this work the expression proposed by [64] is used:
|
|
(2.92) |
where and is the permeability tensor with velocity units.
In order to enhance the discussion of the constitutive model for the permeability tensor, let us perform a Piola transformation of the Darcy's velocity [62,64]:
|
|
(2.93) |
where is the material gradient of the water pressure. As a consequence of the previous expression, we can relate the permeability in the reference configuration, , and in the current configuration as:
Constitutive models for the permeability tensor
After defining the Darcy's Law and showing the relation between the spatial and material definition of the permeability tensor, let us discuss the constitutive models for the permeability tensor.
At this point, two different hypothesis may be performed: On the one hand the material permeability tensor, , may be considered constant; this hypothesis may be interesting for media with anisotropic permeability tensors since the tensor rotates with the deformation of the solid phase [64]. On the other hand, the most common approach is to assume that the spatial permeability tensor, , is constant. In the majority of the simulations, the second hypothesis is assumed.
Not only a constant permeability tensor (in the reference or the deformed configuration) are used in this work; the more sophisticated Kozeny-Carman Law is also used [65]. In this law, the permeability tensor depends on the volumetric strain of the biphasic porous media through the void ratio. Then, the spatial permeability tensor is defined as:
|
|
(2.94) |
where and are the permeability and void ratio at the initial state and is the void ratio, that is defined according to:
|
|
(2.95) |
It must be pointed out that the residual form of the balance mass is not affected on the assumption made on the permeability; however, the tangent matrix to the discrete finite element method depends on the assumptions made on the permeability constitutive tensor. However, these terms have not been fully derived in this work; for instance, when the Kozeny-Carman law is used, the terms that appear due to the dependency of the permeability on the volumetric strains are not considered.
Final form of the mass balance equation
Once the constitutive equations relevant to the fluid phase have been introduced, let us further elaborate the expression for the balance of the mass of the mixture, Equation 2.86. Introducing the definition of the water phase compressibility (Equation 2.90) and assuming that the solid phase is incompressible, the following expression is found:
|
|
(2.96) |
Or, alternatively, introducing the definition of the Darcy's Law, Equation 2.92, and expressing the gradient of the water density in terms of the water pressure:
|
|
(2.97) |
It is assumed that the term , since very large water bulk modulus will be used, so the spatial gradient of the density is nearly zero. Additionally, it is assumed that the term is almost constant. Finally, the mass balance equation of the mixture reads:
|
|
(2.98) |
2.4.2 Balance of linear momentum
The local form, using an spatial description of the domain, of the balance of linear momentum equation reads:
|
|
(2.99) |
where is the mixture density and stands for the total Cauchy stress.
According to the principle of effective stress, the total Cauchy stress tensor, , is equal to the sum of the pore pressure, , and the effective stress:
|
|
(2.100) |
where the effective Cauchy stress depends on the solid skeleton deformation through the deformation gradient, , and a set of history dependent parameters, .
The porosity may be further related to the solid skeleton motion. In an infinitesimal volume of the mixture, , the initial void volume is whereas the volume of the solid fracion is . As deformation takes place, the volume of the solid matrix varies according to . Since the mass of solid particles is the same in the deformed configuration and the solid phase is assumed incompressible, the volume of the solid fraction is whereas the volume of the voids is . As such, the porosity may be described by the following expression:
|
|
(2.101) |
Then, the mixture density, , can be further elaborated to:
|
|
(2.102) |
2.4.3 Strong form of the balance equations
Let us state the system of equations governing the mechanics of the byphasic porous media in an updated-Lagrangian form for quasi-static cases along with the corresponding boundary conditions:
|
|
(2.103) |
where is the material time derivative with respect to the solid phase. The boundary of the domain is divided in two parts, (), where fixed water pressure and prescribed water flow are imposed.
2.4.4 Weak form
Balance of linear momentum
The weak form of the linear momentum balance equation reads:
|
|
(2.104) |
Integrating by parts the term related to the effective Cauchy stress divergence and water pressure gradient, applying the divergence theorem, introducing the Neumann boundary conditions and using index notation yields:
|
|
(2.105) |
where is the second order identity tensor in index notation.
Balance of mass
The weak form of the mass balance equation, Equation 2.98, reads:
|
|
(2.106) |
where is the virtual water pressure.
Note that integration takes place over the reference domain; this is not the only possibility, but it has been done this way because, as it will be shown later, some of the finite element matrices are constant and it keeps the same rational as most mixed formulations for the one-phase problem (the so-called formulations). On the other hand, Borja and Alarcón [63] integrate the mass balance equation directly over the current configuration (in other words, Equation 2.106 is multiplied by the Jacobian, ), whereas Larsson and Larsson [64] state the mass balance equation in terms of fluid content (i.e, Equation 2.106 scaled by ).
Again, the divergence theorem is applied to the weak form, that yields:
|
|
(2.107) |
2.4.5 Finite element discretization
After obtaining the weak form of the balance equations, Equations 2.105 and 2.107, the semi-discrete equations of the hydromechanical formulation are obtained. First, let us introduce the interpolants:
|
|
(2.108) |
where is the finite element approximation of the field whereas are the nodal values. and are the shape functions whereas is the number of nodes. As it can be inferred, the same order shape functions are used for both, solid phase displacements, , and water pressure, . Since the shape functions are defined in the reference configuration and, thus, time independent, , the following property holds: .
The semi-discrete equations of the hydromechanical formulation, Equations 2.105 and 2.107, are given by:
|
|
(2.109) |
where the definition of the Darcy's law has been introduced and the matrices and vectors of the previous expression are defined as:
|
|
(2.110) |
|
|
(2.111) |
|
|
(2.112) |
|
|
(2.113) |
|
|
(2.114) |
2.4.6 Temporal discretization
Since quasi-static conditions are assumed, the temporal discretization of the linear momentum balance equation is quite straight-forward. However, the mass balance has terms related to the temporal derivative of the displacements (the velocity) and the water pressure. A completely implicit integration scheme is used; then:
|
|
(2.115) |
Then, introducing the temporal discretization to the semi-discrete equations, Equation 2.109, the problem reads:
|
|
(2.116) |
2.4.7 Linearization
Both balance equations, defined in Equation 2.116, are solved in a monolithical approach. Then, the residual takes the form:
|
|
(2.117) |
where:
|
|
(2.118) |
|
|
(2.119) |
Then, applying the Newton-Raphson non-linear solver, the linear system of equations equivalent to Equation 2.65 has the form:
|
|
(2.120) |
As in the previous case, the linearization is performed for the continuum equations and then the spatial discretization will be introduced to obtain the discrete stiffness matrices. In this case, the balance equations with the temporal discretization already introduced are linearized:
|
|
(2.121) |
where the absence of subscript at displacements and water pressure stands for the value at time , and .
Linearization of the balance of linear momentum equation
In order to obtain the linearization of the balance of linear momentum equation, let us first write all the derivatives in terms of the reference configuration and introduce the expression of the density of the mixture, Equation 2.102:
|
|
(2.122) |
where the term due to the surface tractions has not been included since its linearization has been presented previously.
First, let us perform the linearization with respect to displacements. Going term by term, the linearization of the term due to the effective second Piola-Kirchhoff, , is quite straightforward:
|
|
(2.123) |
this term reflects the material constitutive model response. On the other hand, to obtain a term with the same formal structure than the geometrical stiffness matrix of the single-phase formulation let us now compute the derivative due to the last deformation gradient that appears in the integral of the internal forces:
|
|
(2.124) |
The only two terms that are still missing in the linearization are those related to the Jacobian and to the inverse of the Right Cauchy-Green tensor:
|
|
(2.125) |
similarly to the temporal derivative of the right Cauchy-Green tensor, Equation 2.22:
|
|
(2.126) |
as a consequence:
|
|
(2.127) |
Then, introducing this previous expression and the linearization of the Jacobian, :
|
|
(2.128) |
On the other hand, differently from the single-phase problem, the external load term due to the gravity also produces a second order term due to the variation of the mixture density:
|
|
(2.129) |
where it has been assumed that the water density is almost constant: that is, the term should be small since it is divided by the water bulk modulus, that is very large in comparison with all the other parameters.
Finally, the linearization with respect to the water pressure is quite straightforward:
|
|
(2.130) |
So, finally, the linearization of the linear momentum balance equation, defined in Equation 2.118, reads:
|
|
(2.131) |
Linearization of the mass conservation equation
In order to calculate the linearization of the mass balance equation, let us first perform a push-back of Equation 2.121, so that all the quantities are referred to the initial configuration:
|
|
First, let us calculate the linearization with respect to displacements:
|
|
where the first and last term of the first line of the previous equation are independent of displacements and, consequently, its derivative is null. Introducing the definition of the Darcy's velocity:
|
|
(2.132) |
First, let us work on the linearization of the first term of the previous equation:
|
|
(2.133) |
The inverse of a matrix derivative may be computed as: . Then, introducing this result to Equation 2.133 and performing a push-forward:
|
|
(2.134) |
Once the linearization of the first term has been presented, let us proceed with the second term of Equation 2.132:
|
|
(2.135) |
where, as commented previously, it has been assumed that the spatial permeability tensor, , is constant; other assumptions made on the permeability tensor may induce different large displacement terms. So, the following expression may be obtained:
|
|
(2.136) |
With respect to the water pressure, the same result is obtained either from the Updated or Total Lagrangian expression of the balance equation; then:
|
|
which has the same formal structure than the small strains counterpart.
So, finally, let us state the final form of the linearization of the mass balance equation, defined in Equation 2.119:
|
|
(2.137) |
where the first order terms have a similar formal structure than the small strains counterpart (except for the inverse of the Jacobian) and additional geometrical terms appear.
Matrix form of the linearization
Finally, the matrix expression of the terms defined in Equation 2.120 may be obtained as:
|
|
(2.138) |
|
|
(2.139) |
|
|
(2.140) |
|
|
(2.141) |
where is the Voigt notation of the tensor , and the definition of terms involved in the computation of the non-linear stiffness matrix, and , may be found in Equations 2.80 and 2.81 for two-dimensional problems and, for three-dimensional cases, in [60]. Due to the complexity, the geometrical terms of the mass balance equation that appear in Equation 2.140, , have not been obtained in matrix format; its expression using indicial notation is presented in Equation 2.137. In the code, these terms have been implemented using indicial notation.
2.4.8 Stabilization of the hydro-mechanical problem
Undrained conditions in water-saturated soils with nearly incompressible constituents results in quasi-incompressible behavior. Therefore, as the problem approaches zero permeability and incompressilibity of the soil and water constituents, the system of the discretized equations describing the formulation has the similar structure to that found when using a mixed formulation of Solid Mechanics problems [66]. Depending on the interpolants used to discretize both nodal variables, the problem may become ill-posed from a mathematical point of view, which may result in non-uniqueness and mesh-dependence of the solution, the well-known volumetric locking.
Volumetric locking introduce numerical stiffening and spurious high spatial variability in the solution, eventually leading to numerical instability The reason behind this behavior is the non-compliance of the Babuska-Brezzy conditions or the patch test due to an improper finite-dimensional space in the finite element discretization.
It is well known that in the hydro-mechanical problem, the pore pressure field tends to exhibit oscillations, which tend to increase when the time step is reduced [67]. As shown in the one-dimensional (Terzhagi's equation) analysis of the discrete equations, the use of implicit time-integration scheme produce a stiffness matrix whose eigenvalues are positive and, consequently, the overall algorithm is unconditionally stable. However, the water pressure field may exhibit oscillations if the time step is smaller than:
|
|
(2.142) |
where is the coefficient of consolidation and the element size. By numerical examples, it can be shown that this limit also applies to two- and three-dimensional analysis [67].
To avoid this problem two strategies are common: either to use more complex, but stable, finite elements with different order interpolation of displacement and water pressure fields, or to apply stabilization procedures to originally unstable finite elements [68].
Since equal-order, low-order finite element shape functions are used to discretize both, displacements and water pressure, the only possible technique that could be used to mitigate volumetric locking is the use of stabilization techniques.
In this work, two simple stabilization techniques are used: the Polynomial Pressure Projection [69] and the Fluid Pressure Laplacian [58]. Both techniques have been used in the literature [70,71,72]. By using these techniques, the discrete governing equations are modified by introducing a new term in the mass balance equation 2.116:
|
|
(2.143) |
where is the stabilization matrix, whose definition depends on the employed stabilization technique.
Polynomial pressure projection
The Polynomial Pressure Projection (PPP) stabilization method has been originally developed to stabilize Stokes equations [73,69] and has also been applied to stabilize the mixed formulation of Solid Mechanics (among others, [30]) and in Soil Mechanics to stabilize formulations similar to the one presented here [70,72].
The PPP has two main ingredients:
- A mixed equal order interpolation of the scalar and vector fields.
- A projection of the scalar variables (volume or pressure variables).
The method is obtained by modifying the mixed variational equation (i.e. the pressure continuity equation) by using local polynomial pressure projections of the pressure variable. The application of the projections in conjunction with minimization of the problem field mismatch, eliminates the inconsistency of equal-order approximations and leads to a stable variational formulation. Unlike other stabilization methods, the Polynomial Pressure Projection does not require the calculation of higher-order derivatives. It uses a projection on a discontinuous space and, as a consequence, can be implemented at element level avoiding the need of mesh dependent parameters. The implementation of this stabilization scheme reduces to a simple modification of the weak continuity equation (the incompressibility constraint).
Given a function , the projection operator is defined by
|
|
(2.144) |
where is the best approximation of the pressure in the space of polynomials of order .
Then, the stabilization term reads:
|
|
(2.145) |
where is the stabilization parameter.
Finally, the discrete stabilization matrix, , may be expressed:
|
|
(2.146) |
where are the set of polynomials introduced in Equation 2.144; in the case of linear triangles, these local element polynomials are .
Estimation of the stabilization factor
In stabilization techniques, there exist a free parameter, that depends on the size of the element size, material constitutive parameters and the time increment [58]. However, obtaining an estimate for this parameter can be very complex. In this work, to estimate the stabilization factor the same technique that was proposed by [74] to obtain the critical time-step for implicit methods is used.
The rational of the method proposed by [74] is quite simple and is based on the solution of the one-dimensional consolidation problem by using a finite element mesh whose nodes are equally spaced. It is assumed that all the nodes of the mesh have the same initial water pressure; at one extreme of the mesh the water pressure is increased whereas the other extreme of the mesh has null Neumann boundary conditions. In order to avoid oscillations on the computed water pressure, the solution has to fulfill two conditions:
- The nodal water pressure should be greater than the initial one at every time step.
- At a given time, the water pressure field should monotonically increase or decrease along the bar.
By using this rational, the authors obtained that the critical time step should be:
|
|
(2.147) |
where is the coefficient of consolidation, is the constrained modulus and is the permeability in velocity units, whereas
It should be noted that this time constraint is equivalent to the one presented by [67] using a similar method.
Assuming small strains, one dimensional conditions, null boundary loads, incompressibility of the water and linear elasticity, the problem statement, Equation 2.103, reduces to:
|
|
(2.148) |
along with the appropriate initial and boundary conditions.
Further assuming that the total stress is constant over time, the following constitutive equation can be written:
|
|
(2.149) |
Then, the problem becomes:
|
|
(2.150) |
At this moment, the consolidation coefficient, , is not introduced in order to have the governing equation in the same dimensions than the mass balance equation presented in Equation 2.103; that is, the same units than those that are implemented.
The finite element discrete equations for a totally implicit integration scheme, including the stabilization term, , are:
|
|
(2.151) |
where are the nodal values of the water pressures at , is the mass matrix, is the matrix due to the stabilization technique and is the permeability matrix. The elemental matrices are given by:
|
|
(2.152) |
where is the nodal spacing.
Let us assume that the mesh consist of equally spaced elements and that an increment of water pressure has been applied at one extreme of the domain, node 1. The last equation of the system of equations, Equation 2.151, relates the value of the water pressure at the last node of the oedometer (the one where null Neumann boundary conditions are applied) and its neighbor. Assuming that the initial water pressure is the same in all the nodes of the domain, this last equation, for the first time increment, may be expressed as:
|
|
(2.153) |
where is the excess water pressure (the current water pressure minus the initial value) at the last node of the bar at time whereas is the node adjacent to the last one.
The two aforementioned requierements that the solution must fulfill [74] may be announced as:
|
|
(2.154) |
The first inequality do not pose any restriction on the value of . Meanwhile, the second inequality is relevant; since the denominator is always positive, the numerator should also be larger or equal than zero. Then, after some manipulation, it yields:
|
|
(2.155) |
Using this previous expression and assuming that the stabilization factor should be positive, the stabilization factor may be estimated as:
|
|
(2.156) |
It is worth noting that the same expression was found by [72] using a more complex technique [75]. Other authors, [70], propose to use as a stabilization parameter; however, this value is independent of the hydraulic conditions of the problem and, consequently, may introduce excessive smoothing of the water pressure field.
As customary, it is believed that the estimated stabilization factor for a very strict hypothesis, it also holds for more complex analysis.
Fluid Pressure Laplacian=
By using the Fluid Pressure Laplacian stabilization, the stabilization term may be written as [58,71]:
|
|
(2.157) |
The same technique to obtain an estimate for the stabilization parameter than in the previous section has been used. In this case, the discrete elemental matrix due to the stabilization technique, Equation 2.157, reads:
|
|
(2.158) |
In one-dimensional cases for linear elements, the elemental matrix of the Fluid Pressure Laplacian technique is equal to that of the Polynomical Pressure Projection technique scaled by , see Equation 2.153 and 2.158. Then, the stabilization parameter is estimated as:
|
|
(2.159) |
Estimation of the stabilization factor for the one-dimensional u-pw element
In the previous section, the stabilization factor has been estimated for very strict hypothesis and only using the pressure as a field variable. In this section, the value of the stabilization factor is estimated with a similar rational but using displacement and water pressure as field variables and considering the water compressibility. That is, the governing equations read:
|
|
(2.160) |
After obtaining the weak form, both variables are discretized with linear shape functions and a completely implicit time-integration scheme is used. Again, the oedometer problem is used and the same conditions than before are enforced.
In this case, due to the complexity, the process is not performed analytically; instead a code in Matlab symbolic is used, see Appendix A.
As such, in one-dimensional analysis, for linear elements with displacement and water pressure degrees of freedom, the stabilization factor may be estimated as:
|
|
(2.161) |
In the case of incompressible fluid constituent, this expression yields:
|
|
(2.162) |
The critical time step to have a stable soltuion without the need of using a stabilization technique is remarkably larger when the problem is solved using both degrees of freedom; compare Equation 2.156 and 2.161. As expected, the critical time step is inversely proportional to the water pressure compressibility.
One-dimensional application example
In order to show the accuracy of the stabilization technique and to validate the obtained stabilization factor, this section presents results of the simulation of a one-dimensional oedometer using only the water pressure as a degree of freedom. The oedometer has the following characteristics: m, m/s. Due to the chosen constitutive parameters and geometrical data, and . In all the cases the incremental time-step is ten times lower than the the critical time-step: s; thus, the non-stabilized case should present oscillations in the water pressure field.
It is worth noting that both of the stabilization techniques that have been presented reduce to the same one under the one-dimensional hypothesis and using the stabilization parameters presented before. However, this is not the case in two- or three-dimensional cases.
First, this problem has been simulated employing two different meshes with 20 and 50 equally distributed nodes, see Figure 5. As shown in the results, at the first time step, the solution show high amplitude oscillations if the discrete equations are not stabilized; however, by using the stabilization technique with the developed stabilization parameter, the solution does not shown any oscillation using a time-increment smaller to the critical one. It is worth noting that, as dissipation proceeds, the stabilized an non-stabilized solution are almost coincident; thus, the stabilization method does not introduce numerical smoothing of the solution.
Additionally, to show that the obtained estimate of the stabilization factor may be also used for non-uniform distributed meshes, the same problem has been computed with a randomly distributed mesh, Figure 6. As before, the stabilization technique avoids high amplitude oscillations in the water pressure field if a time-step smaller than the critical one is used and, as dissipation takes place, the stabilized and non-stabilized solution converge. Although the stabilization parameter has been obtained for equally distributed meshes, seems to hold also for non-uniformally distributed meshes.
In all the previously presented results the solution obtained by the stabilized form agrees well with the analytical solution.
2.5 Concluding remarks
This chapter has presented the basic features of the numerical method and the governing equations used in this work. First, the basic features of the Particle Finite Element Method (PFEM) have been highlighted; additionally, PFEM has been compared to other well-established codes used in geotechnical engineering. Then, some basic results of non-linear Solid Mechanics, such as the definition of stress, strains and the balance equations have been presented; also, the Finite Element equations have been presented.
This chapter has also covered the basic relations of the hydromechanical problem: the mass balance and linear momentum equations at large strain for pseudo-stationary conditions have been presented and, then, the weak form and discrete finite element equations have been obtained. Since low-order elements with the same order of interpolation of displacements and water pressure fields are used, stabilization techniques are employed to alleviate volumetric locking. Finally, a novel approach to estimate the value of the stabilization factor, based on the work of [74], has been presented and assessed in one-dimensional cases.
3 Continuum constitutive models at finite strain
This chapter is devoted to the presentation of the constitutive framework used in this work. First, the large strains elasto-plastic theory based on the multiplicative split of the deformation gradient is revised [57]. After briefly discussing the benefits of the usual integration methods for non-linear constitutive equations (i.e. explicit and implicit methods), the proposed method, an explicit method based on the work of [76] for elasto-plastic constitutive equations using a multiplicative decomposition of the deformation gradient is presented. Subsequently, the constitutive models used in this work for both, total stress and coupled hydro-mechanical problems, are briefly described. Several examples of typical geotechnical tests are presented to assess the developed schemes and, finally, some conclusions are drown.
3.1 Large strain constitutive frameworks
A key requirement that a large strain constitutive framework has to fulfill is objective transformation and frame invariance. In the literature, two main families of schemes have been proposed for large deformation elasto-plastic problems [57]. One of them relies on hypoelastic based models and has been frequently regarded as the extension of the usual small strains that fulfill the objectivity requirements. Meanwhile, in the other theory, hyperleastic relations are used to characterize the elastic response and the formulation is inherently objective due to its construction.
This section first present both constitutive theories, as the discussion helps to put in perspective the advantages of the selected framework. Afterwards, the formulation of hyperleastic based plasticity is described in detail.
Hypoelastic-based plasticity
The first framework to describe finite elastoplastic deformation is based on the use of hypoelastic rate models and an additive decomposition of the spatial rate of deformation tensor in an elastic and plastic part, . This kind of schemes are regarded as extensions of usual small strains algorithms to the large strain regime. Then, the hypoelastic model is formulated to ensure stress objectivity; that is:
|
|
(3.1) |
where stands for any objective stress rate -for instance, the Lie derivative, presented in Equation 2.48-, is the elastic stiffness tensor, is the rate of deformation tensor whereas and stand for the plastic multiplier and the plastic potential.
It can be demonstrated that this formulation may be understood as a simplification at infinitesimal elastic strains of the second framework of constitutive models that will be presented below [53,57]; however, the multiplicative decomposition is the rigorous approach for the exact split of the deformation into elastic and plastic parts [77]. Because of this, it is believed that the use of such formulations should be restricted at problems involving small strains but large displacements [60].
This formulation incorporates the main drawback of hypoelastic models: closed stress or strain cycles in elastic regime may produce or dissipate energy in elastic regime. This fact is inconsistent with the definition of an elastic deformation path. Additionally, it has been found that the use of the additive decomposition of the strain tensor in finite deformation inelasticity may produce dependence of incremental elastic deformations on the deformation history [78].
This kind of schemes are popular in the literature of computational soil mechanics and have been used in conjunction of explicit integration schemes [12,13,79]. However, implicit integration schemes have also been developed for this type of models, among others by [57].
Hyperelastic-based plasticity
In the second family, deformation itself (and not a rate) is decomposed multiplicatively into an elastic and plastic part. The elastic response is always characterized by an hyperelastic model. Due to the formulation, this scheme fulfills inherently the objectivity requirement [57,53]. Additionally, since an hyperelastic law is used, closed cycles do not produce nor dissipate energy [57,77].
An advantage of this formulation is that the total elastic stretch tensor is explicitly obtained and the total elastic strain is directly computed. Then, the use of a stored energy function gives the stress without resorting to rate expressions, thus avoiding any algorithmic objectivity issue [80].
These schemes have been always integrated implicitly in time, leading to the return mapping algorithms [53,81,82].
The application of such schemes to geomechanics problems is limited, but include the formulation of the implicit return mapping for the Cam Clay model [83,84,85], a formulation to deal with unsaturated soil mechanics at large strains [86] and has been extended to double-porosity media [87].
Because this second approach is best suited to problems involving both large displacements and large deformations, it is the one adopted in this work.
3.1.1 Statement of the hyper-elastic based plasticity at large strain
This section presents the large strains elasto-plastic models [53,57]. The main ingredients of the formulation are detailed below:
- Strain decomposition. With respect to the small strains theory, the main difference is the replacement of the additive decomposition of the infinitessimal strain field by a multiplicative decomposition of the deformation gradient into elastic and plastic parts. That is, an intermediate configuration of irreversible (plastic) deformations is introduced, relative to which the elastic response of the material is characterized. Due to the chain rule, the deformation gradient, , is defined as (see Figure 7):
|
|
(3.2) |
where is the motion of the continuum body whereas and are, respectively, the elastic and plastic deformation gradients.
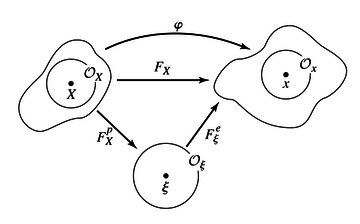 ] ]
|
| Figure 7: Multiplicative decomposition of the deformation gradient in a plastic and elastic part [57] |
- Stress-strain relation. In conjunction with the multiplicative decomposition, Equation 3.2, several elastic strain measures may be defined. For instance, the elastic right and left Cauchy-Green tensors read [53]:
|
|
(3.3) |
where the tensor is defined on the intermediate plastic configuration whereas is defined on the current configuration.
The relation between elastic strains and stresses is assumed hyperelastic. Then, the constitutive relation is defined in terms of a stored energy function, , that depends on the elastic deformation gradient. The requirement of objectivity implies that the stored energy function should depend on the elastic deformation gradient, , through the elastic right Cauchy-Green tensor, , since this tensor remains unaltered against rigid body rotations (as noted in Equation 2.2.3), see [53]:
|
|
(3.4) |
Additionally, if only isotropic hyperelastic models are considered, such as in this work, the stored energy function is a function that depends on the elastic right Cauchy-Green tensor through its invariants or principal stretches due to the representation theorem [53].
|
|
(3.5) |
where are the invariants of the elastic right Cauchy-Green and are the principal stretches, .
Then, the Second Piola-Kirchhoff tensor, , may be obtained as:
|
|
(3.6) |
Whereas the Kirchhoff stress, , may be related to the elastic left Cauchy Green tensor as:
|
|
(3.7) |
since the Elastic Left Cauchy-Green and Right Cauchy-Green tensors have the same invariants.
Another deformation measure is the Hencky strain, , that is defined as:
|
|
(3.8) |
where are the principal stretches and are the eigenvalues of both, and , and are the eigenvectors of ; in short:
|
|
(3.9) |
By using the spectral decomposition, it can be demonstrated that the Kirchhoff stress tensor may also be obtained as [53]:
|
|
(3.10) |
where .
The hyperelastic rate constitutive equation, can be obtained from time differentiation as:
|
|
(3.11) |
where is the material elasticity tensor, that is given by:
|
|
(3.12) |
By using the definition of the derivative of the right Cauchy Green tensor and the Lie derivative of Kirchhoff stress, the spatial elasticity tensor may be obtained:
|
|
(3.13) |
- Elastic domain. The yield surface defines the admissible stress space:
|
|
(3.14) |
where stands for a set of hardening parameters.
Inside the yield surface, , the behaviour of the material is purely elastic and no irreversible deformations are produced.
It should be noted that the use of the Kirchhoff stress measure in the yield surface restricts the theory to isotropic plasticity [53].
- Flow rule. The spatial plastic and elastic velocity gradient are:
|
|
(3.15) |
where the tensor is defined on the intermediate plastic configuration.
By performing the temporal derivative of the strain decomposition, Equation 3.2, the following expression relating both velocity gradients and the total velocity gradient may be obtained:
|
|
(3.16) |
This last expression leads to the definition of the spatial description of the plastic deformation gradient, , as:
|
|
(3.17) |
Based on the assumption of maximum dissipation for associative plastic models and then extending the expression to non-associative elasto-plasticity, the following expressions are found [83]:
|
|
(3.18) |
where the first equation stands for the flow rule whereas the rest are the Kuhn-Tucker conditions; is the plastic potential, is the plastic multiplier whereas
Eventually, to complete the theory it might be necessary to provide a relation for the spin velocity gradient, . However, the restriction of all the formulation to isotropic elasticity and plasticity makes the spin velocity gradient irrelevant [53].
The flow rule may be also stated in terms of the Lie derivative of the elastic left Cauchy-Green tensor [57,81]:
|
|
(3.19) |
Using some of the previously presented expressions, it can be demonstrated that both definitions of the flow rule, Equation 3.18 and 3.19, are equivalent.
Additionally, the consistency condition has to be fulfilled:
|
|
(3.20) |
- Hardening Law. A rule regarding the evolution of the hardening parameters has to be supplied. Generally:
|
|
(3.21) |
where is a function. In this work, it will be assumed that the hardening parameters are a function directly related to the Hencky plastic strain :
|
|
(3.22) |
3.2 Integration of non-linear constitutive equations
The robustness and accuracy of mechanical finite element analysis relies on the local integration scheme of the constitutive equations. In the literature, two main families of schemes have been proposed to integrate the constitutive relations at the Gauss points: explicit and implicit methods.
Implicit integration
The main component of implicit methods is the enforcement of the plastic consistency condition defined by the yield surface. A common feature of the technique is the use of an operator split strategy: first, an elastic trial state is computed -that is, the stress state is updated assuming beforehand that it is elastic- and secondly, a plastic corrector is computed [81,88]. In this strategy an implicit approximation of the governing equations is done, and, as a consequence, a non-linear system of equations has to be solved at each integration point that is in elasto-plastic regime.
Only for very few models there exist closed form solutions (for instance, elastoplasticity, see [53]); but, in general, the non-linear system of equations has to be solved numerically. Generally, this is done iteratively using the Newton-Raphson scheme. It is well known that the Newton-Raphson shows an asymptotic convergence rate to the solution; however, this property can only be assured for an initial guess close enough to the solution.
Strong non-linear features of complex plastic models, such as high curvature of the yield surface, leads to a lack of convergence of the local problem for a range of initial trial states. For instance, Pérez-Foguet and Armero [88] identified, for a set of plastic models, regions in the stress space where, due to the nonlinearity of the equations, no convergence is attained. To exemplify this fact, Figure 8 shows the number of Newton-Raphson iterations required to converge for a broad range of trial elastic strains using a Mohr-Coulomb yield surface. In fact, in the referred work, the yield surface is described by the Rounded Hyperbolic Mohr Coulomb surface developed by [89]. The -axis of the figure represents the first invariant of the trial elastic deformation (the volumetric strain) scaled by elastic and plastic parameters whereas the -axis shows the second invariant of the trial elastic deformation (the deviatoric strain) scaled again by elastic and plastic parameters. The authors identified a large region of trial elastic states where no convergence of the non-linear solver was obtained. This region is located behind the apex of the yield surface and this behavior is attributed to the high curvature that presents the smoothed Mohr Coulomb surface in the zone nearer the apex.
![Number of iterations required for converge by the Newton-Raphson Algorithm to solve the implicit integration of constitutive equations using a rounded Mohr-Coulomb yield criterion. Results depicted in the space of trial elastic volumetric strain - trial elastic deviatoric strain. [88].](/wd/images/thumb/d/df/Draft_Content_325409517-monograph-FiguraAPF.png/390px-Draft_Content_325409517-monograph-FiguraAPF.png)
|
| Figure 8: Number of iterations required for converge by the Newton-Raphson Algorithm to solve the implicit integration of constitutive equations using a rounded Mohr-Coulomb yield criterion. Results depicted in the space of trial elastic volumetric strain - trial elastic deviatoric strain. [88]. |
Implicit methods render second order convergence of the global problem if the consistent tangent matrix is used [53,82]; thus, virtually representing a potential time saving in the iterative solving of the global problem. However, the consistent tangent matrix involve terms related to the second derivative of the yield surface and the plastic potential, which may be laborious to obtain.
Explicit integration
On the other hand, in explicit methods the yield surface, hardening law and the plastic potential are evaluated at known stress states and no iterative solution scheme is required to predict the final stress state. As such, explicit methods are usually found more straightforward to implement. However, explicit methods have several drawbacks that can be corrected using more elaborated algorithms, such as the one proposed by [76].
The main drawbacks and the proposed solutions are summarized below:
- Elasticity and elasto-plasticity in a single strain increment. In implicit methods no special treatment is needed when a Gauss Point changes from elastic to elasto-plastic state. However, in explicit methods, the intersection with the yield surface has to be evaluated, so a part of the increment of strain is computed using the elastic equations and the other one with the elasto-plastic ones.
- Yield surface drift. Using implicit schemes, the resulting stress state always satisfy the yield condition up to a tolerance. On the other hand, using explicit integration schemes, at the end of each elasto-plastic increment, the obtained stress typically may not lay in the yield surface. Even using a substepping scheme, the yield surface drift violation may not be negligible and its effects are accumulative [76]. Special procedures to correct the stress state and return it back to the yield surface need to be applied [90].
It must be pointed out that, up to date, no consistent tangent matrix expression has been found for explicit integration schemes and typically a continuous elasto-plastic tangent matrix is used. As such, the convergence rate of the global problem won't necessarily tend to a quadratic rate. However, comparative studies of implicit and explicit stress integrations in boundary value problems show that while a quadratic convergence on the global problem is found for implicit methods using a consistent tangent matrix, the convergence rate is adequate using an explicit method in conjunction with the continuum tangent matrix assuming, of course, loading steps of a reasonable magnitude. This is the case of the work of [91], that compared both types of stress integration techniques in elementary tests (i.e. imposing the stress state to the integration scheme).
The accuracy of the results is heavily influenced by the magnitude of the strain increment. In the usual implicit methods, second order accuracy is obtained whereas in explicit methods it depends on the scheme used to integrate the governing elasto-plastic equations [92]. In order to enhance the accuracy of the stress integration method, usually adaptive substepping techniques are used. The solution is computed with different temporal discretizations or by different order integration schemes (such as different Runge-Kutta methods). Comparing the solution obtained by both computations an error measure appears naturally [76]. These methods are completely suitable for both, explicit and implicit integration techniques.
[76] algorithm, or modifications of it, has been frequently used in computational geomechanics and, using small strains formulations, it has been found that such scheme is able to limit the error in the computed stresses [76]. Although in this work it will be used in conjunction of a first order forward Euler discretization of the governing equations, the method is more efficient (in terms of computational cost) in conjunction of high-order Runge-Kutta [93].
Through the comparison of explicit and implicit integrations methods [91] found that there is not a significant difference between implicit and explicit methods in terms of accuracy of the computed stresses when an adaptive substepping algorithm is used.
Since complex yield surfaces with sharp edges -such as the Tresca model and the Modified Cam Clay- will be used in this work, an explicit stress integration is used.
3.3 Development of the explicit equations for a single deformation step
In this section, the basic equations to integrate a single elastic and elasto-plastic step are presented. First the elasto-plastic case is considered and the update equations for the elastic and plastic strain are obtained for an explicit integration scheme; the constitutive matrix and an approximation to the value of the plastic multiplier are described. For completeness, the equations using an implicit integration are also presented in order to compare them with those of the explicit case. Finally, the equations for the elastic regime are presented.
Table 1 summarizes the main governing equations.
| Strain decomposition: | |
| Hyperelastic model: | where |
| Yield surface: | |
| Flow Rule: | |
| Hardening Law: | |
| Kuhn-Tucker conditions: | |
| Consistency condition |
3.3.1 Elasto-plastic regime
In order to obtain the strain and stress state at the new configuration, let us begin by with the plastic configuration. Using Equation 3.15, the plastic deformation gradient at the configuration, , may be evaluated; assuming that the variation of the deformation gradient is exponential [53], the following explicit approximation is obtained:
|
|
(3.23) |
The assumption that the variation of the deformation gradient is exponential is convenient in the formulation of the implicit method since, as it will be shown below, introducing the Hencky strain the formulation retains the same formal structure than the small strains counterpart. In the explicit case, the Hencky strain cannot be introduced and, therefore, assuming that the variation of the deformation gradient is exponential is redundant. However, it is adopted here for consistency with previous works.
Introducing Equation 3.23 into the definition of the total deformation gradient, Equation 3.2, and using the definition of the flow rule, Equations 3.17 and 3.18:
|
Rearranging some terms, the elastic left Cauchy-Green tensor at the new configuration, , is expressed as:
|
In this previous expression, the relative deformation gradient, , can be clearly identified.
On the other hand, the plastic left Cauchy-Green may be expressed as:
|
|
(3.26) |
Note that these last two equations define the new elastic and plastic configuration in terms of quantities in the previous configuration, the new deformation gradient, -that is obtained in the global scheme-, and the plastic multiplier, for which an expression will be obtained hereafter. The stress tensor is obtained applying the hyperelastic law with the appropriate elastic strain tensor.
Estimation of the plastic multiplier
In the development of the equations some approximations will be made to obtain the plastic multiplier and the tangent matrix. It is believed that this fact does not affect the accuracy of the algorithm since the strain updates, Equations 3.25 and 3.26, are not approximated; however, the approximation of the plastic multiplier may produce additional yield surface drift -that will be corrected with a specific procedure- and may deteriorate the convergence rate of the solver of the global problem.
The value of the plastic multiplier is obtained from the consistency condition:
|
|
(3.27) |
The temporal derivative of the Kirchhoff stress tensor may be obtained as:
|
|
(3.28) |
where the elastic stiffness in the intermediate deformation has been used:
|
|
(3.29) |
Next, let us introduce the spatial elastic stiffness tensor:
|
|
(3.30) |
Then, Equation 3.28 may be expressed as:
|
|
(3.31) |
neglecting the first two terms and introducing Equations 3.17 and 3.18:
|
|
(3.32) |
Introducing this expression to the consistency condition reads:
|
|
(3.33) |
Now, an expression for the temporal variation of the Hencky plastic strain is required. In this work, it has been assumed that the hardening parameters are a function of the plastic Hencky strain, see Table 1, however, other possibilities exist. The temporal variation of the plastic Hencky strain might be approximated as:
|
|
(3.34) |
where the derivative of the logarithm of a matrix may be computed as if and only if the matrices and commute, , which only happens if both matrices share eigenvectors.
Then, the temporal variation of the plastic left Cauchy Green is:
|
Then:
|
|
(3.36) |
Although it seems a crude approximation, for hardening parameters defined in terms of the volumetric plastic strain, such as the Modified Cam Clay, this approximation does not introduce any error to the last term of the consistency condition, Equation 3.27; that is:
|
|
(3.37) |
where is the Kirchhoff effective pressure. To prove the validity of the last equality of the previous equation, let us compute the derivative of the plastic Jacobian:
|
|
(3.38) |
As a consequence, the derivative of the volumetric Hencky plastic strain is expressed as:
|
|
(3.39) |
So, it has been demonstrated that the approximation introduced in Equation 3.34 is exact for materials whose hardening parameters depend on the first invariant of the Hencky plastic strain (that is, all constitutive models used in this work).
Finally, the consistency condition reads:
|
|
(3.40) |
where .
As a consequence, the following approximation for the increment of the plastic multiplier will be used:
|
|
(3.41) |
Until now, all the expressions required to compute a single elasto-plastic step have been obtained; specifically, Equations 3.25 and 3.26 define the new elastic and plastic left Cauchy-Green tensors in terms of the increment of deformation, functions evaluated at the known configuration and the increment of plastic multiplier, an expression for which has been obtained in Equation 3.41. The stress tensor is obtained simply by applying the hyperelastic law.
Constitutive matrix
In order to use the developed algorithm in the context of a Finite element code with implicit integration of the global problem, an expression for the stiffness matrix is required; in particular, an expression relating the Lie derivative of the Kirchhoff stress and the symmetric part of the velocity gradient is required, that reads:
|
|
(3.42) |
where is the temporal derivative of the elastic right Cauchy Green, so:
|
|
(3.43) |
And finally, the elasto-plastic stiffness matrix for the elasto-plasticity is expressed as:
|
|
(3.44) |
It is interesting to note that [53] found that for elasto-plastic constitutive models at large strains using an implicit integration scheme, the constitutive matrix has the same formal structure than the one encountered in the small strain counterpart, plus additional terms. These new terms appear because the integration is performed in the principal axis of the strains and represent the variation of eigenvectors in time [94]. In the case that the stress integration is performed using the Cartesian components, such as in this work, the stiffness matrix may be retrieved with a similar structure than the small strains counterpart [82].
3.3.2 Comparison with implicit methods
In order to highlight the differences of the large strain elasto-plastic equations for implicit and the ones derived here for explicit integration techniques, let us now obtain the discrete equations for the implicit strategy.
The plastic deformation gradient at configuration , that is the implicit counterpart to Equation 3.23, reads:
|
|
(3.45) |
Operating as in the explicit scheme, the following expression is found:
|
Then, rearranging some terms, the following expression may be obtained:
|
where the trial elastic left Cauchy-Green tensor, , has been identified.
It is useful to note that the derivative of the plastic potential and share eigenvectors since the plastic potential is an isotropic function and the Kirchhoff stress tensor and the elastic left Cauchy-Green tensor are coaxials [53]. Additionally, the trial elastic state has also the same eigenvectors. Then, all the matrices of the right hand side of Equation 3.47 commute, that is ; consequently, the following property holds: . Then, introducing the Hencky strain measure, , the following expression is found for the implicit integration scheme:
|
|
(3.48) |
which has exactly the same formal structure of the small strain implicit integration scheme [53]. So, then, for elasto-plastic materials that hardens with the first invariat of the plastic Hencky strain, at each gauss point the problem may be expressed as, (see [81,84]):
Find such that:
|
|
(3.49) |
In the explicit method, Equation 3.25, the matrices do not share eigenvectors. As a consequence, the Hencky strain could not be introduced.
Apart from the already discussed benefits and drawbacks of implicit integration methods, the principal advantage -from an implementation point of view- of implicit stress integration techniques at large strain is that the same numerical codes used for the evaluation of stresses at small strain are completely suitable to compute the large strain counterpart only changing a few lines of the code; namely, storing the elastic left Cauchy Green tensor instead of the elastic infinitesimal strain and additional routines to compute the conversion between the left Cauchy Green tensor and Hencky strain. Additionally, the constitutive matrix may require some extra entries due to the effect of large strains [95].
3.3.3 Elastic regime
Similarly, to obtain the one step update equations for the purely elastic regime, from Equations 3.15 and 3.18, it can be obtained:
|
|
(3.50) |
Inserting this equation to the strain decomposition at :
|
|
(3.51) |
where the right hand side can be further elaborated:
|
|
(3.52) |
As a consequence:
|
|
(3.53) |
Then, the following expression is found for the elastic Left Cauchy Green:
|
|
(3.54) |
It is evident from the expression of the elastic Left Cauchy Green that, in purely elastic regime, the increment of deformation is computed analytically: that is, no error is introduced due to the temporal discretization of the equations governing the constitutive model. Additionally, since an hyperelastic model is used, stresses are also evaluated analytically. As such, in purely elastic regime, the computational cost of the evaluation of stresses is only two matrix products to obtain the new elastic Left Cauchy Green and the evaluation of the gradient of the stored-energy function to obtain the Kirchhoff stress tensor.
The elastic stiffness matrix reduces to:
|
|
(3.55) |
where .
3.4 Gauss point algorithm
As already discussed, the use of an explicit approach to integrate elasto-plastic constitutive relations require sophisticated algorithms in order to mitigate the drawbacks associated with explicit integration (for example: the violation of the consistency condition, first order accuracy in time).
This section describes the algorithm to integrate the constitutive model between two given configurations; this algorithm is based on the one developed by [76] for small strain hypoelastic-plastic constitutive equations; that has subsequently been extended to large strains hypoelastic-plastic models by [12].
Before that, key procedures needed to set up the algorithm (namely, a routine to split the relative deformation gradient and the yield surface drift correction scheme) are described.
Relative deformation gradient subdivision
The elasto-plastic update equations presented in the previous section integrate the constitutive model between two given configurations. In order to introduce a substepping scheme, a procedure that splits the deformation gradient preserving the multiplicative structure is required.
In the context of the finite elements, the solution of the motion at any point of the domain is known at configurations and . Then, the motion between two given configurations may be written as:
|
|
(3.56) |
From the previous definition, the deformation gradient is given by [53]:
|
|
(3.57) |
whereas the relative deformation gradient between configuration at time and reads:
|
|
(3.58) |
where the notation has been introduced and stands for the second order identity tensor.
As a consequence, the relative deformation gradient between two arbitrary intermediate configurations, and , is:
|
|
(3.59) |
Drift correction
As already noted, using explicit integration schemes, at the end of each elasto-plastic increment, the stresses obtained may not lay on the yield surface. In this work, stresses and hardening parameters are corrected such that the total strain (that is, the deformation gradient) remains unchanged, as proposed by [90]. In order to obtain the value of plastic multiplier to be corrected, let us perform a Taylor's series of the yield surface function around the configuration at the drift correction iteration . At iteration all stress and strains are known. In this way, the correction algorithm will be also explicit and the solution of a non-linear system of equations is not required.
|
|
(3.60) |
In order to not induce deformation ; thus, is the magnitude of the plastic multiplier to be corrected. All the quantities are evaluated at the known configuration (to compact the notation the subindex has been obviated).
Thus, the amount of correction of the plastic multiplier has the following explicit expression:
|
|
(3.61) |
Then, the corrected elastic Left Cauchy Green reads:
|
|
(3.62) |
It is interesting to note that, if this scheme is used by setting the initial state as:
|
|
(3.63) |
that is, the initial condition of the drift correction algorithm is the trial state of a typical implicit stress integration algorithm, the algorithm described above is also the Cutting-Plane algorithm as described by [95] and [57]. Although this particular algorithm enforces the yield condition and does not require the solution of a non-linear system of equations, it is practically not used in computational Solid Mechanics since it appears that the exact linearization of the algorithm can not be obtained in closed form [57].
3.4.1 Algorithm
The general scheme that is used to integrate the elasto-plastic equations is presented in Algorithm 3.1 and it is based on the work of [76].
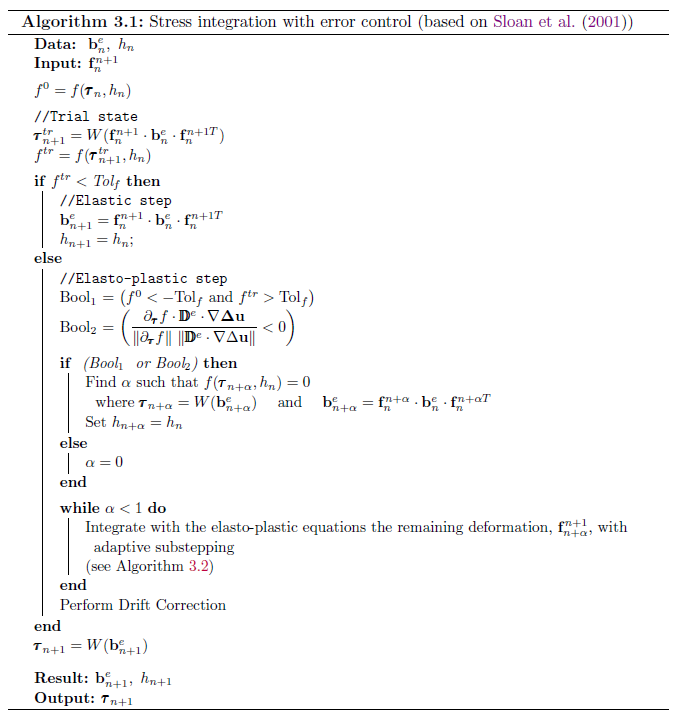
|
First, a trial elastic step is computed; if the final stress state lays inside the elastic region, deformation occurs in purely elastic regime. In this case, as mentioned before, the increment of deformation is computed analytically and no special treatment of the non-linearity of the elastic model is required in hyper-elastic based models.
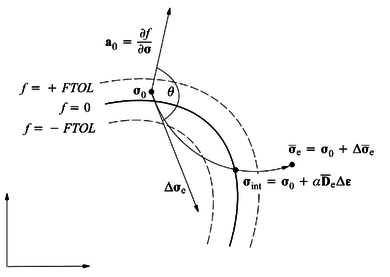 ] ]
|
| Figure 9: Yield surface intersection: Elasto-plastic unloading [76] |
Otherwise, part or all the deformation increment produce plastic flow. Two conditions control if there exist elastic loading or elastic unloading before plastic regime. The first condition stands for the cases where the previous known stress state is in the elastic region whereas the yield function of the trial state is larger than a tolerance. The second condition represents cases where the previous known stress state is in elasto-plastic regime and the yield function of the trial state is larger than a tolerance but part of the deformation is in purely elastic regime; see Figure 9. In this case the angle between the normal to the yield surface and the increment of stress is larger than 90. In both cases, it is first required to find the intermediate time ( in the algorithm) such that the stress state intersects the yield surface. Numerically, this is performed by using the bisection method: although it might be a less efficient algorithm, this method does not require the computation of gradients (as the Newton method does).
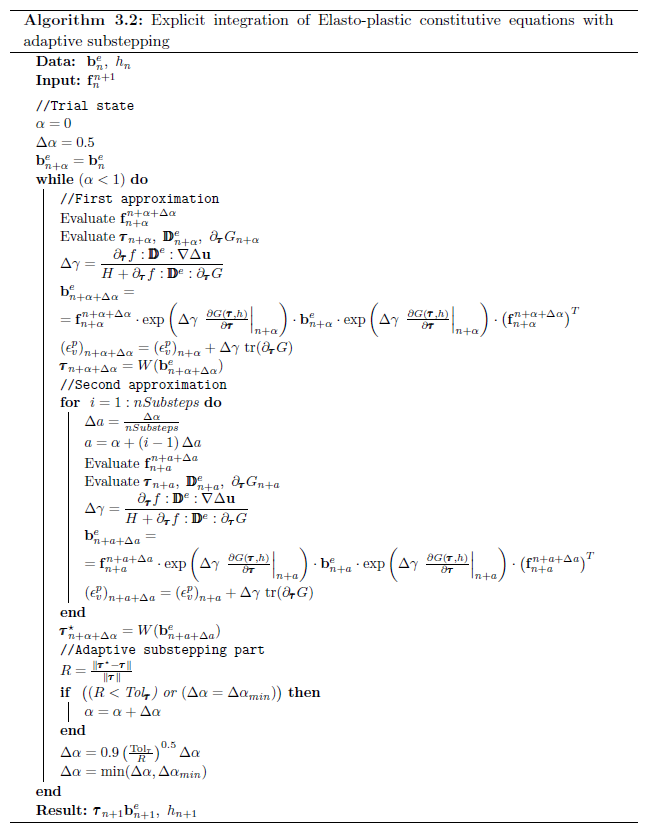
|
Elasto-plastic equations are integrated using an adaptive substepping scheme, see Algorithm 3.2. In the literature, typically, different order Runge-Kutta methods are used [76], however, in this work, the update equations have been developed only for the forward Euler Method. Then, each deformation increment is computed with two different temporal discretizations: one using only one deformation increment and the other using three deformation increments. At the end of the substep two stress approximations are obtained: and . The following error measure is defined:
|
|
(3.64) |
Only in the case that the error measure is less than a specified tolerance, Tol, the obtained state is accepted; otherwise it is rejected. In both cases the pseudo-time increment is computed according to [76]:
|
|
(3.65) |
For practical reasons, a minimum step-size is also defined to prevent very small increments; as a consequence, increments that do not fulfill the tolerance may be accepted.
Finally, the yield drift is corrected with the equations presented in the previous section and the stress is computed from the gradients of the stored-energy function. The yield correction algorithm is only applied at the end of the step and not after each elasto-plastic substep since it has been observed that, for the used constitutive equations, the amount of drift is small and does not affect the accuracy of the results.
Although it is not explicitly stated, first the yield surface for step (in the known configuration) is computed and, in the case that the previous step was elasto-plastic and the stress state does not lay in the yield surface (up to a tolerance), the drift correction algorithm is applied. The stress state of the previous iteration may violate the yield surface only for a class of transfer operators used in the remeshing step. If the remeshing step is not applied, this step is not necessary.
3.5 Constitutive models
In this section, the constitutive models used in this work are presented. Two types of constitutive relations are used, one for the purely mechanical problem (total-stress analysis) and another one for the coupled hydro-mechanical problem.
3.5.1 Tresca model
For the total stress analysis, the saturated soil is assumed to satisfy a Tresca yield criterion:
|
|
(3.66) |
where is the undrained shear strength, is the second invariant of the Kirchhoff stress and is the Lode Angle.
In the principal stress space, the Tresca surface represents an hexagonal cylinder along the -axis; it presents sharp edges, that are smoothed via the continuous approximation developed by [96].
The elastic regime is assumed to fulfil a linear model between the Kirchhoff stress and the elastic Hencky Strain:
|
|
(3.67) |
where and are the bulk and shear modulus of the material.
Therefore, the following constitutive matrix may be defined:
|
|
(3.68) |
where is the fourth order deviatoric projection tensor.
The elastic Hencky Strain, , and left Cauchy Green tenor, , are related through:
|
|
(3.69) |
where is the deviatoric part of the elastic Left Cauchy Green tensor.
3.5.2 Modified Cam Clay Model
For the coupled hydro-mechanical analysis, a hyperelastic Modified Cam Clay model is used; this model has been previously used by [84] and [85], among others.
The elastic part of the model follows an hyperelastic model proposed by [42] and later modified by [43]. The main feature of the hyperelastic law is that it is able to capture the pressure-dependent nature of the bulk and shear modulus by defining them as a function of the first and second invariants of the deformation measure. However, several shortcomings of the model have been described in the literature [42,43,97]: the crossing of volumetric strain contours (i.e.: the same stress state may be obtained from different strains) and the existence of a maximum attainable stress ratio. The hyperelastic model has four different parameters (, , and ); however, in all the literature references either or are assumed to be equal to zero. The effect of having both constitutive parameters grater than zero is presented in Appendix B.
The free energy is given by [42,43]:
|
|
(3.70) |
where is a reference pressure, , is the slope of the swelling line, is the initial void ratio, is the constant part of the shear modulus and is a parameter.
As a consequence, the volumetric and deviatoric part of the effective Kirchhoff stress, , are computed according to:
|
|
(3.71) |
where is the Kirchhoff effective mean stress.
Then, the following tangent matrix may be obtained:
|
|
(3.72) |
where:
|
|
(3.73) |
|
|
(3.74) |
|
|
(3.75) |
These last expressions show that if the volumetric and deviatoric elastic behaviour are coupled. On the contrary, by setting and , the elastic volumetric and deviatoric responses decouple, and the shear modulus becomes constant: .
The problem is completed with the yield surface and the hardening law defined by:
|
|
(3.76) |
|
|
(3.77) |
where is the slope of the Critical state line in the plane and may be made dependent of the Lode's Angle , is the isotropic preconsolidation pressure, , is the slope of the virgin consolidation line and the reference preconsolidation pressure is denoted by . In the deviatoric plane the yield surface has a Mohr-Coulomb shape; whose sharp edges are smoothed with well-established smoothing techniques [89,96,98].
3.6 Numerical assessment
This section presents a set of numerical examples in order to highlight the main features of the hyperelastic Modified Cam Clay model and evaluate the numerical implementation. The first two examples involve strain-controlled problems whereas the third one is a boundary-valued problem.
In all the simulations the chosen soil parameters are: , , , and kPa. is equal to 80 kPa for normally consolidated tests and 20 kPa for overconsolidated tests. In the numerical examples, all the tolerances -in the relative stress error, the yield surface violation and the unloading condition- are set equal to .
3.6.1 Constant Volume Simple Shear Test
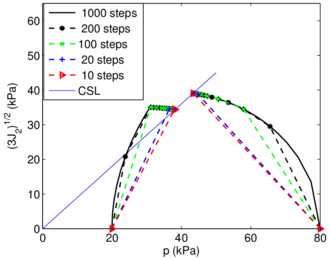
|
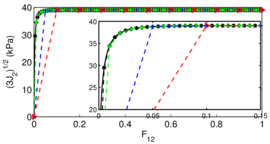
|
| (a) | (b) |
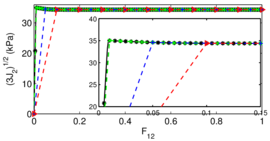
| |
| (c) | |
| Figure 10: Constant volume shear test: (a) stress trajectories for OCR 1 and 4; stress-strain relations for the normally consolidated (b) and overconsolidated (c) tests. | |
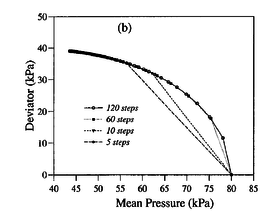
|
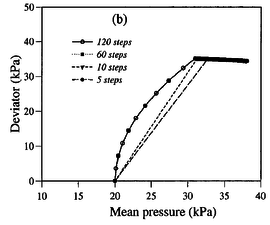
|
| (a) | (b) |
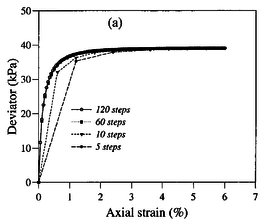
|
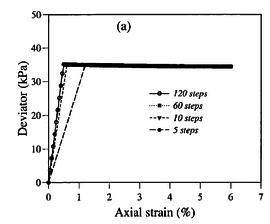
|
| (c) | (d) |
| Figure 11: Constant volume shear test: stress trajectories for OCR 1, (a), and OCR 4 (b); stress-strain relations for the normally consolidated (c) and overconsolidated (d) tests. Results from [85] | |
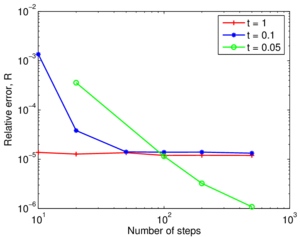
|
| Figure 12: Constant volume shear test: Stress relative error (with respect to the solution obtained with a larger number of steps) for the normally consolidated test at different pseudotimes |
The first example consists on a constant volume simple shear test. The problem is integrated with several number of steps up to a final deformation of . The displacement field is parametrized by a pseudo-time variable, , and is written as: ; as a consequence, the deformation gradient is:
|
|
(3.78) |
Figure 10a shows the stress trajectory for two overconsolidation ratios; both tests tend to the critical state line. As it can be seen in the overconslidated test, in the elastic regime there exist a change in the mean stress at a constant volumetric strain due to the coupling in the non-linear elastic model. The stress-strain relation is depicted in Figures 10b and 10c; while the normally consolidated test is characterized by a decrease on the stiffness in the plastic regime, the overconsolidated counterpart exhibits softening. The stress pathof this element test coincides with that of an undrained compression triaxial.
In both cases, the solution computed with a small number of steps converges towards that obtained using a much larger number of steps, see Figure 10. Figure 12 presents the relative error at several times in terms of the number of steps used to compute the problem. In particular, the relative error is computed as:
|
|
(3.79) |
where is the solution computed with 1000 steps, that is treated as a reference solution. As depicted in Figure 12, for a large number of steps the relative error on the stress is in the same order of the tolerance specified at the substepping scheme (). However, when the solution is computed with a small number of increments, larger errors are encountered: the substepping scheme computes several increments with the imposed minimal increment size without converging, thus introducing error to the solution.
In all cases the yield surface drift violation is small and less than three iterations are required to perform the correction.
The same problem has been solved by [85]. In the referred work, the authors develop an implicit stress integration scheme and use this example also to assess the accuracy and convergence properties of the proposed algorithm. In that work, the number of strain increments is varied from 5 to 120 up to a maximum axial deformation of 6%
The results obtained by [85] using an implicit method are depicted in Figure A. The comparison of the results obtained using the implicit method and the ones with the proposed explicit method reveals that the number of strain increments has a larger impact on the implicit method. This fact is more obvious in the curves of deviatoric strain-deviatoric deformation obtained by both methods: using the explicit method, minimal discrepancies appear on the solution irrespectively of the number of incremental steps, whereas using the implicit methods discrepancies of up to several kPa appear on the deviatoric stress for the same amount of deviatoric strain. The good accuracy behavior is attributed to the adaptive substepping algorithm.
3.6.2 Oedometer

|
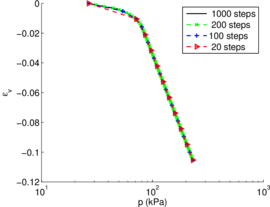
|
| (a) | (b) |
| Figure 13: Oedometer test: (a) stress trajectory; (b) stress-strain relation. | |
Figure 13 shows the results of the simulation of a drained oedometer test. As a consequence of the hyperelastic model, the trajectory on the volumetric deformation-mean stress plane is not described by two straight lines.
This problem has been solved using a different number of incremental steps and, again, minimal discrepancies appear on the solution irrespectively of the number of steps.
3.6.3 Drained triaxial
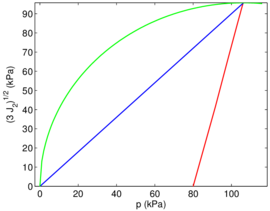
|
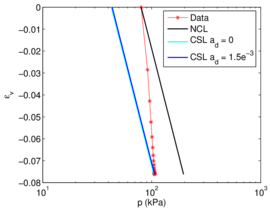
|
| (a) | (b) |
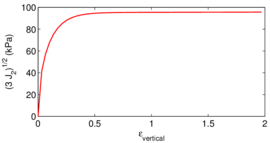
|
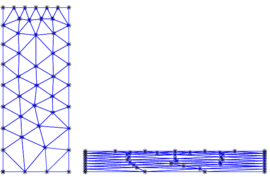
|
| (c) | (d) Triaxial test: trajectories in the (a) , (b) and (c) planes |
| Figure 14 | |
The last example corresponds to a drained triaxial of a sample of m; the initial and final axisymmetric mesh is displayed in Figure 14(d). The initial state of the soil is characterized by kPa and . A total 1400 steps are computed applying an incremental vertical displacement of m to the upper boundary.
In the stress-invariants space, the test tends towards the Critical State Line , Figure 14a. Figure 14b shows the volumetric behavior along with the Normal Compression Line and the Critical State Line. From the model definition, Equations 3.71 and 3.77, and assuming that , the following expression relating the volumetric strain and the mean stress at critical state may be obtained:
|
|
(3.80) |
where appears due to the coupling in the hyperelastic model. According to numerical simulations, this term is . Altough the CSL depends on the elastic deviatoric deformation; the volumetric (elastic and plastic) and deviatoric elastic deformations cease to increase.
3.7 Concluding remarks
In this chapter the two elasto-plastic model families for large strain problems have been presented; namely, the hypo-plastic based elasto-plasticity, in which an objective stress rate is linked to the spatial velocity gradient, and the hyper-elastic based elasto-plastic models, that decompose multiplicatively the deformation gradient in an elastic and plastic part. The main methods to integrate constitutive models (explicit and implicit) have been described and their main features discussed.
A novel explicit integration scheme in the framework of multiplicative finite strains elasto-plasticity has been developed. The accuracy of the method has been enhanced by using the algorithm proposed by [76]. In particular details of the extension of the substepping scheme and the yield violation drift correction technique (based on [90]) have been fully described.
By means of several examples using the [42] hyperelastic model and the Modified Cam Clay, it has been shown that the results obtained are accurate. Indeed, using an adaptive substepping scheme very similar results are obtained irrespectively of the number of incremental steps; the yield surface drift violation remains small and less than three iterations are required to perform the correction.
4 Numerical procedures for the imposition of contact constraints
In may problems part of the boundary of a deformable body may coincide with another part of the boundary of the same or another body. The interaction between multiple bodies produce a set of normal and tangential forces at the interface. Mathematically, contact conditions are expressed as a set of geometrical restrictions to the solution and the interaction forces are deduced from these constraints.
This chapter is devoted to the formulation of the algorithms for the imposition of the contact constraints between a rigid structure and a deformable porous media. The chapter is organized as follows: First the basic geometrical relations needed to set up the contact constraints are briefly detailed; this part is based on [59]. Afterwards, the contact constraints -including those for the hydromechanical problem- are enumerated and the boundary problem is enunciated. The implicit integration algorithm for the tangential contact stresses at the interface is presented; an alternative scheme using the Implex algorithm [99] is briefly detailed. After numerically assessing the developed algorithms, several conclusions are drawn.
4.1 Contact kinematics
The theory of contact mechanics starts by considering two different bodies, , , each one occupying a different region in . The boundary of each body, , may be parametrized by , the local convective coordinates of the parametrization. Consequently, the position of any point of the boundary of the bodies is then given by:
|
|
(4.1) |
The two tangential vectors to the surface, , , in the reference configuration and in the deformed one, , may be obtained as:
|
|
(4.2) |
This local base is not necessarily orthogonal, nor will they have unit length [100].
The normal to the surface in the reference and deformed configuration, and respectively, may be described by:
|
|
(4.3) |
Due to the chain rule, both basis are related trough the deformation gradient, :
|
|
(4.4) |
The tangent and normal vectors defined above () are the covariants vectors, that are linked to the contravariants vectors () through [59]:
|
|
(4.5) |
where and are the identity second order tensor in matrix and index notation respectively.
Then, the deformation gradient, , is obtained as:
|
|
(4.6) |
4.1.1 Normal contact
![Reference and deformed configuration. Sketch of the minimum distance function [59].](/wd/images/thumb/c/ca/Draft_Content_325409517-monograph-Contact_parametric_1.png/480px-Draft_Content_325409517-monograph-Contact_parametric_1.png)
|
| Figure 15: Reference and deformed configuration. Sketch of the minimum distance function [59]. |
The non-penetration condition for two bodies is given by (see Figure 15):
|
|
(4.7) |
where and stand for the coordinates of bodies and in the current deformation and the vector is the outward normal of the first body. Assuming that the boundary of both bodies is sufficiently smooth [59], every point belonging to can be related with the nearest point on the other surface, , by the minimum distance function:
|
|
(4.8) |
Once the projection point, , is computed, the non-penetration condition for each point of , Equation 4.7, can be redefined as:
|
|
(4.9) |
where the normal gap function has been defined and .
As it will be shown below, in Equation 4.14, the following expression holds:
|
|
(4.10) |
Then, an alternative expression for the normal suitable for methods that do not strictly impose the normal contact constraint is:
|
|
(4.11) |
Since it will be used latter in the formulation of the contact boundary problem, let us define the penetration function as:
|
|
(4.12) |
4.1.2 Tangential contact
![Sketch of the projection point and the covariant basis [59].](/wd/images/thumb/d/dd/Draft_Content_325409517-monograph-Contact_parametric_2.png/480px-Draft_Content_325409517-monograph-Contact_parametric_2.png)
|
| Figure 16: Sketch of the projection point and the covariant basis [59]. |
The response in the tangential direction can be categorized in two different states. In the first one, the so-called stick state, no tangential relative displacement exists between the two contacting bodies. The second state, the slip condition, is characterized by the relative tangential movement.
The tangential path of point on the surface can be computed from (see Figure 16):
|
|
(4.13) |
where .
However, in order to evaluate the tangential path, Equation 4.13, the value of has to be computed. This can be done from the derivative of Equation 4.8:
|
|
(4.14) |
that is equal to zero since it is evaluated at an extreme of the function.
Taking the time derivative of this equation yields:
|
|
(4.15) |
where . All this leads to a system of equation of the form [59]:
|
|
(4.16) |
where, according to [59]:
|
|
(4.17) |
where is the metric tensor.
It is interesting to note that the second term of Equation 4.15 depends on the normal penetration. As a consequence, if Lagrangian multipliers are used to enforce contact constraints this term is zero; on the other hand, if the penalty method is used this term is different from zero. As it will be shown below, in this work the Penalty method will be used to enforce contact constraints. Since the magnitude of the penetration is small compared to all the other dimensions of the problem, this term is considered negligible. Then:
|
|
(4.18) |
On the one hand, premultiplying the left hand side of Equation 4.18 by :
|
|
(4.19) |
whereas, operating in the same way to the right hand side:
|
|
(4.20) |
So, finally, the tangential path, Equation 4.13, is written as:
|
|
(4.21) |
Stick condition During stick conditions, there is not relative movement between both bodies and, as a consequence, the value of the convective coordinates should not change; that is . By using Equation 4.21 and the time derivative of the normal gap for strict contact, Equation 4.9:
|
|
(4.22) |
in other words, in stick conditions, the velocity of both bodies at the contacting point should be the same.
4.2 Contact boundary value problem
When mechanical contact problems are considered, apart from the common balance equations and constitutive relations, the contact constraints have to be introduced to the solution.
4.2.1 Mechanical contact constraints
In the normal direction of the interaction surface, the contact constraints are: (i) the penetration of both bodies is not permitted, (ii) there is a null normal force when the bodies are not in contact and (iii) there is only compressive normal forces between both bodies if adhesion forces are not considered. These restrictions may be written as the Kuhn-Tucker conditions for contact:
|
|
(4.23) |
where is the normal stress acting in the interaction surface.
The response in the tangential direction can be divided in two different states: in the first one, stick conditions, no tangential relative displacement exists between both bodies. The second state, slip conditions, is characterized with relative tangential movement. These conditions may be expressed as:
|
|
(4.24) |
where is the norm of the tangential gap, is the tangential stress due to the contact in the tangential direction and is the frictional yield surface.
4.2.2 Hydraulic contact constraints
In the case of the coupled hydromechanical problems, additional contact constraints regarding the water pressure and flow are required. For instance, in the contact between two porous media, these contact constraints read: (i) the water pressure should be equal at both sides of the contact interface and (ii) the water velocity should be continuous along the normal of the interface [101,102]. However, in the case of the contact between a porous media and an impervious media -for example, a steel structure- the hydraulic contact condition is different: the normal flux along the normal of the contact should be null.
The imposition of these contact constraints also dictate the method used to discretize the governing equations. To introduce the former contact constraint, typically (displacement - Darcy's water velocity or displacement- water pressure) elements are employed and a condition to each nodal variable at the contact interface is imposed (see [101,102]). Meanwhile, the latter may be employed to any type of elements. It is interesting to note that, using a simplified formulation (as in this work) and not specifying any other boundary condition in the contact boundary, the contact constraint is naturally imposed: in the absence of an hydraulic boundary condition (prescribed water pressure or water flow), null Neumann conditions are imposed; that is, zero water flow at the interface.
4.2.3 Weak form of the boundary value problem
Traditionally, the most popular discretization technique in the context of deformation contact problems is the node-to-segment approach; the main idea is that a specific node on the slave side must not penetrate the opposing master segment. Another discretization method is the segment-to-segment using mortar methods; by using this approach, contact constraints are not enforced at discrete nodal points but are formulated along the entire contact boundary in a weak integral sense. Recently, several authors, [103,104,32,33], have proposed new contact strategies, in which the interface is meshed with a set of non-overlapping patches (or contact elements) that have the same spatial dimension than the deformable body. These formulations are popular in the PFEM literature of Solid Mechanics. However, in this work, one of the contacting bodies -the structure- is assumed to be rigid; this hypothesis is approximated enough when the Young's moduli ratio between the structure and the soil is large [105].
Once the contacting surfaces are discretized, contact constraints may be imposed to the solution in several ways: using Lagrangian multipliers, the restrictions are completely fulfilled; however, new degrees of freedom are incorporated to the problem and the system of equations become very non-linear, making convergence challenging [105]. On the other hand, penalty methods eliminate the constraints by adding a term proportional to the error of the constraint in the residual. As a consequence, the restriction is only approximately fulfilled; large penalty factors impose more severely the constraint but the resulting system matrix becomes ill-conditioned.
Then, weak form of the momentum balance equation for a contact problem reads [59]:
|
|
(4.25) |
where are the contact contributions associated with the active contact boundary. As in Chapter 2, stands for the test functions.
In single-phase problems, the contact problem only affects the momentum balance equation and is completely independent of the formulation (primal or mixed formulation). Meanwhile, as already commented, no special treatment of the hydraulic contact condition is required in the hydro-mechanical problem using the simplified formulation in the case that the interaction between an impervious and a porous media is considered: the contact constraint (null water flux at the contact boundary) is inherently fulfilled. This is the reason beneath the fact that Equation 4.25 only presents the linear momentum balance equation.
The contact contribution term depends on the method to introduce the contact constraints to the solution; in the case of the penalty method, the contact contributions for stick conditions read:
|
|
(4.26) |
whereas for slip conditions:
|
|
(4.27) |
where and are the normal and tangential virtual gaps, is the contact interface and and are the normal and tangential penalty factors. is the tangent contact stress whose definition and calculation is presented in the next section.
The virtual normal gap is defined as:
|
|
(4.28) |
where the last term of this equation vanishes since and the term is also equal to zero. Hence, the normal virtual gap is expressed as:
|
|
(4.29) |
On the contrary, operating as in the previous section, the tangential virtual gap is expressed as:
|
|
(4.30) |
Introducing these two previous expressions to the contact contributions, , without making a distinction for stick and slip conditions:
|
|
(4.31) |
where the term has been identified as the normal stress acting on the contact.
Integration of the contact constraints
The integration of the contact constraint, Equation 4.31, may be performed with a Newton-Cotes quadrature. Assuming that one of the surfaces is rigid and using the Trapezoidal rule, the contribution at node reads:
|
|
(4.32) |
where is the contributory area to node and the stresses and the normal are those referred also to node .
It is interesting to note that by using the Trapezoidal rule the contact constraint at each node only depends on the displacement at that node. On the contrary, a Gauss quadrature would couple the contact constraint at each node with its neighbors.
4.2.4 Linearization
An approximation to the linearized form of to be used for the non-linear solver may be obtained as follows:
|
|
(4.33) |
where some large strains terms, such as the variation of the normal in terms of displacements, are omitted.
The calculation and linearization of the tangential contact stresses, , is the topic of next section. Operating in the same way than in the derivation of the normal virtual gap, Equation 4.28, the following expression is obtained:
|
|
(4.34) |
4.3 Elasto-plastic analogy
The key idea of the elasto-plastic analogy is to split the tangential gap, , in an elastic and plastic part [59]:
|
|
(4.35) |
where the so-called stick condition -no permanent tangential displacement between the two contacting bodies- correspond to the elastic part and the slip condition -characterized by permanent relative tangential movement- is represented by the plastic flow.
The elasto-plastic analogy may expressed as:
|
|
(4.36) |
where is the tangential contact stress, is the tangential contact stiffness or penalty factor, is the slip yield condition, is the plastic multiplier, is a hardening (strain-like) variable and is the normal effective pressure. In addition to these equations, the solution must fulfill the Kuhn-Tucker conditions:
|
|
(4.37) |
and also the consistency equation:
|
|
(4.38) |
Differently form other works and in order to have a similar formal structure than hypo-elastic-plastic large strains formulations for continuous elements, the Lie derivative of the tangent stress is related to the rate of elastic gap in order to make the tangent stress objective. On other works, for instance in [106], the definition of the tangential gap 4.13 is slightly different:
|
|
(4.39) |
and the Lie derivative is introduced in the flow rule and the tangent contact stress is directly related to the tangential gap: .
The contact forces are calculated by the use of an implicit integration procedure. The Lie derivative of the tangent stress can be algorithmically approximated as:
|
|
(4.40) |
Then:
|
|
(4.41) |
The integration algorithm used to evaluate the tangential contact stress is detailed in Algorithm 3. It has the same formal structure than the well-known return mapping algorithm of elasto-plastic constitutive equations [57]. First, a trial elastic step is computed as:
|
|
(4.42) |
where is the increment of tangential gap in the time-step. The yield function is evaluated at this trial state; if it is lower or equal to zero the increment of displacement is purely elastic and no plastic slip appears.
In the elasto-plastic regime, the problem reduces to finding the value of the plastic multiplier, , such that the stress state belongs to the plastic surface, , where:
|
|
(4.43) |
From this last equation, it can be seen that all the vectors (tangential stress, trial tangent stress and the direction of the plastic slip) share the same direction:
|
|
(4.44) |
and this is the reason why in Algorithm 4.1 the integration of stresses is performed with only the modulus and not vectors.
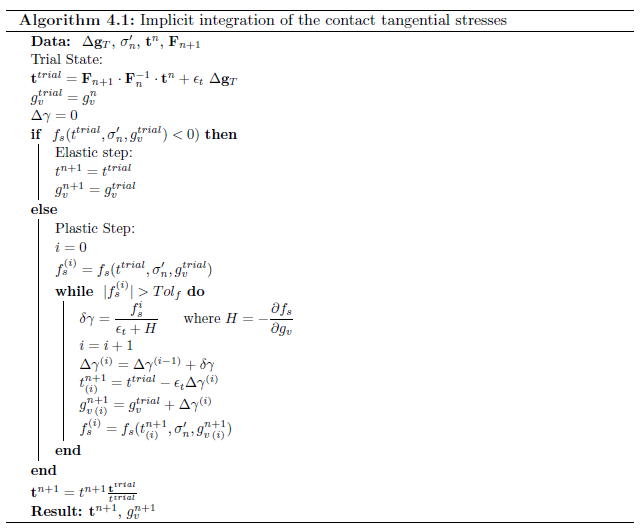
|
4.3.1 Linearization
In order to evaluate the derivative of the tangential stress, let us express the stress as:
|
|
(4.45) |
then:
|
|
(4.46) |
The modulus of Equation 4.43 is:
|
|
(4.47) |
During elasto-plasticity, the yield surface of the tangential part of the contact and its temporal derivative are zero:
|
|
(4.48) |
which, after some manipulation, yields:
|
|
(4.49) |
where
So, finally, the derivative of the modulus of the tangential stress is expressed as:
|
|
(4.50) |
Introducing the previous equation into Equation 4.46:
|
|
(4.51) |
where and:
|
|
(4.52) |
|
|
(4.53) |
From Equation 4.21:
|
|
(4.54) |
Finally, the tangent matrix is approximated as:
|
|
(4.55) |
On the other side, the linearization in the elastic regime, Equation 4.53, reads:
|
|
(4.56) |
4.3.2 Implex integration
Oliver et al. [99] presented an integration scheme for non-linear constitutive models whose aim is to provide additional computability and robustness and reduce the computational cost in the analysis of Solid Mechanics problems. The algorithm may be summarized as a two steps solver with a prediction step and a correction step. In elasto-plastic problems, the first step (extrapolation step) consist on computing the boundary problem using an extrapolated value of the increment of the plastic multiplier; that is, the magnitude of the plastic strains is assumed before-hand. In the second step (correction step) the constitutive equations are correctly evaluated at each integration point with the displacements obtained in the extrapolation step and the resulting increment of plastic strains is used in the next extrapolation step.
Extrapolation step In the extrapolation step, the global balance equations are solved with an extrapolated value of the plastic multiplier: . During the extrapolation step, the contact tangential stress is computed as:
|
|
(4.57) |
these last expressions can be rephrased as:
|
|
(4.58) |
where we can observe that the tangential stress decomposes in two parts: the first one is a predictor stress whereas the second one is a correction step. A similar decomposition is found in the formulation of the Implex strategy for continuum elasto-plastic problems [99]; however, in that case the predictor stress does not depend on displacements, whereas in this problem the predictor stress varies with the current displacement through and the term . A more detailed interpretation of this decomposition will be given in Figure 21, that plots the predictor, the Implex extrapolation and the implicitly integrated contact stress in terms of the tangential gap.
As it will be demonstrated in the linearization section, the tangential stress is independent of the (effective) normal stress acting on the interface since the constitutive equation is only approximately fulfilled. As such, the tangential stress is is not coupled to the water pressure nor the normal gap.
Correction step During the correction step, contact stresses are evaluated following Algorithm 3.
Linearization of the extrapolation step
The linearization of the extrapolated elasto-plastic tangential contact stress yields:
|
|
(4.59) |
where the first term appears due to the linearization of the corrector contribution and the second one is an approximation to the derivative of the predictor contribution (again, as in Equation 4.53, the derivative of has been omitted).
It is worth noting that the first term of the tangent matrix is the same as the tangent matrix of stick conditions; additionally, in general, , so the first term is much larger than the second one. As such, the tangent matrix of the Implex step is more similar to the one of the stick conditions (elasticity), see Equation 4.56, than to the one encountered for slip conditions (elasto-plasticity), see Equation 4.55.
One of the key properties of the Implex strategy for continuum elasto-plastic elements is that the iterative solving process may converge in a unique iteration per time step, making the solving procedure becomes step-linear [99]; this property is a consequence of having a constant tangent matrix to the Newton-Raphson procedure. This property only appears in small strain problems in conjunction with linear elasticity and a set of plastic flow rules.
A closer look to the tangent matrix of the tangent contact stress for the Implex strategy, Equation 4.59, shows that for two dimensional cases the last term is null and the tangent matrix in elastoplasticity coincides with the elastic tangent matrix. As a consequence, the contact problem may be step-linear. However, several large deformation terms have been neglected in the derivation of the tangent matrix, in particular, the derivative of and the covariant basis. Despite that, all these derivatives are null if the contacting object is a rigid plane, so a step-linear behaviour may be expected when a two dimensional, deformable body becomes in contact with a rigid plane.
4.4 Numerical assessment
This section presents a set of numerical simulations in order to assess the previously introduced algorithms. The first analysis, the contact patch test, serves to validate the normal contact algorithm. In the second one, the sliding of a deformable body over a rigid plane, the influence on the results of several numerical parameters, such as the time-step and the penalty factors, is evaluated. Finally, the robustness of the algorithms is illustrated in more challenging simulations: the three-dimensional, total stress simulation of the ball penetrometer and drained and undrained triaxials in Modified Cam Clay soils.
4.4.1 Patch test
The contact patch test can be used to check the capability of a contact formulation to exactly transmit the constant normal stress between two contacting surfaces, regardless of their discretization [107]. In particular, through the use of a contact surfaces and Dirichlet boundary conditions, the solution is expected to have a constant strain field.
In this section, results of the patch test for plane strain, axisymmetric and 3D analyzes are reported. In all the cases, the material is elastic. The bottom surface has its displacements fixed in all directions whereas the horizontal displacements are restricted in the vertical boundaries. On the top of the domain a smooth, rigid plane is placed that is moved downwards. As such, the displacement field in the deformable body is expected to be non-zero only in the vertical direction and the stress state should be homogeneous in all the domain.
Figure 17 presents the vertical stress profiles for the tests. It can be seen that in plane strain conditions, the formulation fulfills the patch test. Indeed, results with two different meshes are presented, one with a structured mesh with uniform distribution of the element size and one with non-structured and non-uniform distribution; in both cases the vertical stress does not present any variation along the mesh. The same behaviour is found in the 3D computation.
However, the axisymmetric case fails the patch test if a Newton-Cotes with two integration points (i.e: the trapezoidal rule) is employed. This behaviour may be explained by an insufficient integration of the contact constraints. For this particular case the Contact contraint, Equation 4.31, reads:
|
|
(4.60) |
This last equation shows that the term inside of the integral is, at least, a polynomial of second order since it includes the product of the radii and the shape functions, that are both linear with the radii. As such, integrating this term with the Trapezoidal rule results in a sub-integration of the term. For this reason, Figure 17(d) also presents the results of the patch test employing a Gauss-Legendre quadrature with two integration points. As expected, the quadrature integrates the contact constraints with exactitude and the formulation fulfills the patch test.
The use of a higher order integration rule shows that the Patch test is only fulfilled in axisymmetric conditions if the quadrature used to compute the contact constraints is able to integrate the term without committing error. Nevertheless, it must be pointed out that the internal forces are computed with an insufficient integration, since only one Gauss point is used; however, if the stress state is homogeneous, the exact value of the internal forces is obtained because the term inside the integral of the internal forces is linear with the radii.
Although the benefits of using a sufficient integration of the contact constraints have been highlighted, during the rest of the work this term is always integrated using the Trapezoidal rule since, by using this rule, the contact force at one node only depends on the displacements (and water pressure) of this particular node and it is hypothesized that this fact will result in a more robust and simple implementation.
4.4.2 One-way sliding of a square over a plane
In this example a square of deformable media moves on top of a rigid plane; the geometry of the example can be observed in Figure 18. The movement of the rigid plane has two phases: in the first one the plane moves upwards whereas in the second one the plane moves on the horizontal direction. The movement of the plane is described by:
|
|
(4.61) |
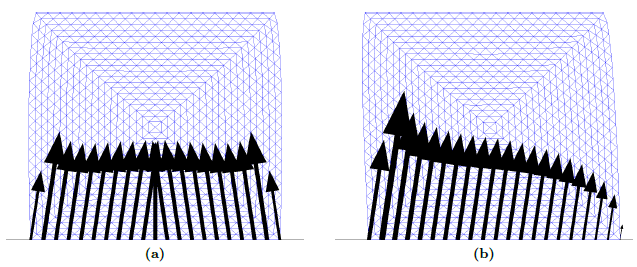
|
| Figure 18: Contact forces along the interface for the one-way sliding of a square over a plane: at the end of the indentation, (a), and at the end of the problem, (b). |
The deformable body is characterized by kPa and and it is discretized with mixed stabilized elements (this mixed formulation is described in Section 5.2.1). The top boundary has its displacements restricted in all directions.
The interface is assumed to obey a Coulomb friction law with :
|
|
(4.62) |
Figure 19 shows the evolution against time of the total horizontal and vertical forces acting at the rigid plane (the sum of all contact forces) using s. During the first phase, the normal force increases linearly, whereas the resulting tangential stress is almost zero. In this phase, all the nodes lying in the interface are in sliding conditions, see Figure 18(a), except the one lying in the middle of the segment, that experiences null tangential gap. When the plane begins to move tangentially to the deformable body, the resulting tangential forces increase until all the nodes of the mesh reach again the plastic state. During this phase the total normal force slightly varies. However, as shown in Figure 18(b), normal forces increase in the left hand side of the interface and decrease in the right hand side.
To investigate the effect of the ratio between the tangential and normal penalty factors, , Figure 19 compares the results obtained for different ratios maintaining constant the value of the normal penalty factor. Using the implicit method results appear to be almost independent of the tangential penalty factor for values larger than . However, for lower values, it requires more tangential relative displacement to reach the sliding state. It must be noted that the slope of the increase of the resulting tangential force is almost independent of the tangential penalty factor (if it is large enough) and it is due to the deformation of the elastic body.
Comparing both integration schemes, no remarkable discrepancies are observed in the sum of the contact forces, Figure 19. However, numerical results show large oscillations in time on the calculated forces at some nodes for large tangent penalty factors using the Implex technique. Additionally, the displacement field obtained with the Implex strategy also presents oscillations in time for large values of the penalty factor. This behaviour may be observed in Figure 20, that depicts the evolution of the tangent force and the horizontal displacement in a node that lies in the middle of the interface. As larger penalty factors are used larger oscillations on the horizontal displacement field are observed once all the interface reach the sliding state.
To understand this oscillatory behavior, Figure 21 shows the evolution of the tangential force, , in terms of the tangential gap, . In particular, this figure shows the predictor, the Implex (the one used to achieve equilibrium) and the corrected (Implicit) force; see Equation 4.58. These stresses along with the module of the tangential gap may be depicted in the same figure with ease since it is a two dimensional problem and the contacting surface is a rigid plane so all the vectors have the same direction. Additionally, normal stress acting on the surface hardly varies in this particular node.
As expected from Equation 4.59, the slope between the tenso-deformational state in the prediction and Implex is equal to the tangential penalty, . Larger penalty factors produce that the distance between the Implex force and the one computed with the implicit method increases; as a consequence, the extrapolation introduces more error to the solution. This behavior causes the oscillation in the displacements previously observed in Figure 20.
Additionally, for large penalty factors the prediction force has the opposite direction of the Implex and the Implicit ones; although this is corrected during the Newton-Raphson iterations (i.e. the Implex stress has the correct direction), this may become a problem with more complex problems.
In order to enhance the analysis, the influence of the time-step has also been studied in a different parametric analysis. The value of has been chosen since is the one that produces less oscillations for the previous time-step capturing accurately the interface behaviour.
Figure 22 compares the obtained total horizontal force acting on the rigid plane using different temporal discretizations and both strategies: the implicit time-marching scheme and Implex. Using the implicit scheme, the resulting load-time curves seems independent of the number of time-steps used. On the other hand, using the Implex scheme results are slightly influenced by the temporal discretization: as the number of time-steps used to compute the solution increase, the obtained curve tends to the one resulting from the implicit scheme. However, the first phase of the problem -which also has some contact conditions in plasticity- and the final plastic sliding are well captured.
Figure 22 also depicts the evolution of the horizontal displacement of a node lying at the center of the interface. Again, using the implicit technique, results seem independent of the number of time steps. On the other hand, using the Implex strategy, only accurate solutions are found if the number of time-steps is sufficiently large. On the contrary, with a very low number of time-steps high amplitude oscillations on the displacement field are observed. The same argument that the one presented before to interpret the oscillations caused for high penalty factors also holds for this case.
To finalize with this exercise, the effect of the mesh coarseness is also assessed. Figure 23 presents the three finite element meshes used for the computations with the same penalty factor and time step s. These meshes are composed by 400, 1600 and 2304 elements respectively. The figure also depicts the contact forces along the interface and the vertical stress, that do not show any size effect.
Figure 24 compares the obtained results for the three previously introduced meshes. Using both integration strategies, a slightly higher total frictional force is obtained for the coarser mesh (Mesh-A). However, in terms of displacement and contact forces, the solution is almost insensitive to the mesh size for this particular problem. For the Implex strategy, the same oscillations on displacements is found for Mesh-B and Mesh-C; in the coarser mesh the amplitude and decay of the oscillations is similar but with a lower frequency.
To compare the computational cost of both integration strategies, the number of iterations of the Newton-Raphson scheme is used. Figure 25 shows the evolution of the norm of the residual during the iterative process of solving the global problem. Curves at the three main states are presented: during the normal movement of the plane, during the first steps of tangential movement of the plane and, finally, during the sliding of the plane.
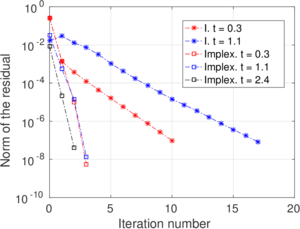
|
| Figure 25: Evolution of the norm of the error of the global problem during the Newton-Raphson scheme at different steps. The label I denotes implicit integration. |
In the first phase almost all of the contact conditions are in slip condition whereas half of them are in elasto-plastic conditions in the second phase. During these phases and using an implicit method, it requires a large number of iterations in order to achieve the desired tolerance of the norm of the residual. Part of this bad convergence may be a consequence of some simplifications on the derivation of the linearization and varies with the the computational time step, , and the ratio of the penalty factors, . On the other hand, using the Implex technique, the problem converges with only four iterations, showing a quadratic convergence rate. This behaviour appears to confirm the hypothesis that the Implex technique may convert the problem in step-linear (under the hypothesis stated before) since it has a constant tangent matrix, Equation 4.59. The global problem is not step-linear due to the geometrical nonlinearity and the utilized hyperelastic model, that introduces a non-linear dependency between stresses and displacements.
During the last phase, the plane moves tangentially and the deformable body reaches a steady state. The implicit integration scheme does not require to perform any iteration and the norm of the residual is always below . This is because the obtained tangent force at all the contact conditions is equal to the force obtained in the previous step. On the other hand, using the Implex scheme the first guess in elasto-plastic regime is always different from the force obtained in the previous step, see Figure 21 and Equation 4.57.
4.4.3 Ball penetrometer
To assess the algorithms in a more challenging problem, the development of contact forces in a Ball is studied. Although the problem is clearly axisymmetric, it is solved using a 3D mesh; this way, the effect of neglecting several large strain geometrical terms in the derivation of the linearized form can be assessed. Since it is beyond the scope of this chapter, the mesh used for this example is only very fine near the penetrometer. Due to the coarseness of the mesh and a relatively small domain, the solution is not compared to analytical or other numerical solutions [108,11].
An undrained penetration is assumed; as such, the soil is modelled with stabilized elements and the constitutive model is characterized by kPa and and a Tresca plastic model with an undrained shear strength of kPa; as such, the rigidity index is .
The tangential behavior of the interface follows a von Mises yield criterion:
|
|
(4.63) |
as such, the maximum shear stress admissible between the soil and rigid body interface is a fraction of the undrained shear strength of the soil. The problem is axisymmetric and, in T-Bar and Ball penetrometers, a flow-around mechanism is expected.
The penetrometer is discretized with an sphere of radii m and the domain is a cube whose edges lengths are . The horizontal displacements are restricted in all the vertical boundaries whereas all the displacements are null in the bottom boundary. At the beginning of the simulation the soil is undisturbed and the penetrometer is placed in the middle of the domain. A vertical stress of 100 kPa is applied in the upper boundary to ensure the contact between the whole penetrometer and the soil throughout the simulation. The initial stress condition follows . The geometry of the problem may be inferred from Figure 28, that depicts the vertical stress along two different planes.
The Ball advances at a velocity of 1 m/s and the computational time step is s. Since a high rigidity index is used, it is expected that resistance will be mobilized at moderate penetrations. For this reason and in order to eliminate the effect of remeshing, the same mesh is used during all the simulation.
|
|
Implex element | Implex contact | |
|
S1 |
0 | no | - |
| S2 | 0 | yes | - |
| R1 | 1 | no | no |
| R2 | 1 | yes | no |
| R3 | 1 | no | yes |
| R4 | 1 | yes | yes |
This example is computed six times, see Table 2: in the first two, the interface is assumed smooth and in one of them the Implex scheme is applied in the integration of the elasto-plastic constitutive equations whereas in the other one the explicit stress integration scheme is used. A completely rough interface () is considered in the last four cases and combinations of applying the Implex scheme to integrate the continuum constitutive equations and the interface interaction tractions are considered.
Figure 26 shows the contact stresses along the interface for a fully smooth and rough computations. In both cases the same tendencies are observed: very large stresses are found in the lower part of the sphere whereas they tend to decrease at the upper part. It is clear that stresses computed with a rough interface have a tangential component that opposes to the movement.
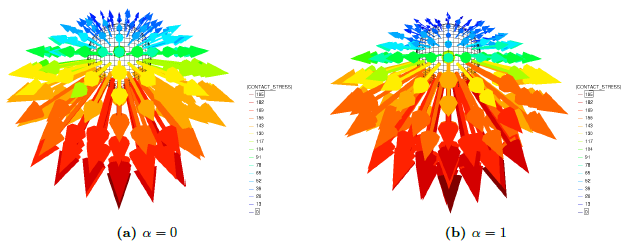
|
| Figure 26: Ball. Contact stresses (kPa) along the interface for a smooth and completely rough interface, (a) and (b) respectively. |
For this analysis, the main result of interest is the resistance factor, , defined as the total vertical force acting on the ball divided by the projected area and the undrained shear strength, . Figure 27 shows the evolution of the resistance factor in terms of the penetration. Overall, the effect of the integration strategy is limited: the same tendencies are found in all cases and an error lower than 2% is committed in the final resistance factor.
Applying the Implex technique only to the constitutive equation of the continuum (cases S2 and R2) tends to overestimate the resistance forces. At the initiation of the plastic regime (approximately at ) both curves exhibit an over-stress effect, that tends to get corrected. On the contrary, if Implex is just applied to the contact constraints (case R3), the overall response is slightly underestimated at the initiation of the problem, however as penetration progresses the solution almost matches that obtained with the implicit algorithm. Surprisingly, applying the Implex technique to both elasto-plastic models (case R4) -at the continuum constitutive equations and at the contact constraints- results in a lower error in the initial steps of the problem and, at the end, the same response than the case R2 is achieved.
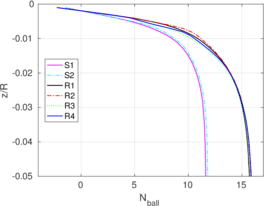
|
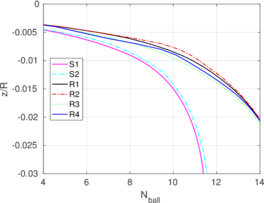
|
| (a) | (b) |
| Figure 27: Effect of the contact roughness and the integration schemes on the normalized penetration curves for the Ball. Subfigure (b) is a detail of subfigure (a). | |
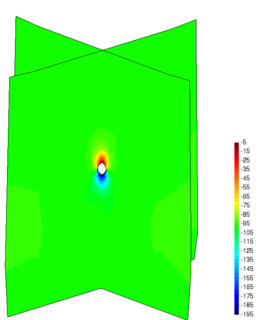
|
| Figure 28: Ball. Vertical component of the Cauchy stress tensor (kPa) along two vertical planes. Smooth interface. |
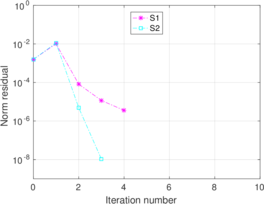
|
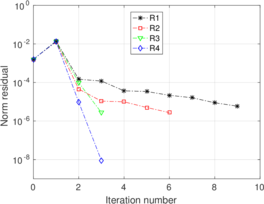
|
| (a) | (b) |
| Figure 29: Evolution of the norm of the error of the global problem during the Newton-Raphson scheme at . Smooth cases, (a), and rough cases, (b). | |
Again, to evaluate the computational cost of the integration methods the number of iterations required in the iterative solver of the global problem is used. Integrating correctly both, the continuum elements and the interface forces, represents an upper bound of the computational cost: it requires up to 5 iterations for the smooth contact and 9 in the fully rough case to converge. On the other hand, applying the Implex technique at both elasto-plastic models represents the lower bound of the computational cost: convergence is achieved in only 3 iterations; additionally, these are the only cases where a quadratic convergence rate is achieved.
In this particular example, the cases where the Implex technique is not set at the interface are the ones that present a higher computational cost (R1 and R2). On the other hand, the reduction of computation cost due to the application of Implex in the continuum elements is limited (compare S1 against S2 and R3 against R4).
Exact linearization
By using the Matlab symbolic toolbox, the computation of the exact linearization is quite straightforward in some special cases. For instance, Code Contact:NormalMatlabCode presents the Matlab file to generate the exact linearization of the normal contact constraint particularized for a rigid sphere. This file generates two different codes that are then transferred to the code: one of them computes the normal force and the other the tangent matrix to the normal force. It must be pointed out that it is not verified that the penetration function is less than zero since it is performed elsewhere in the code.
Eventually, the same procedure could be applied to the linearization of the tangential contact forces. An script to compute this linearization has been coded. However, due to the complexity of the tangent matrix, version 2017a is not capable of exporting the linearized form to a code.
In short, by using this procedure it is expected to obtain the exact linearization of the normal in Equation 4.33, which has been neglected. The nodal contribution of the normal contact constraint may be obtained from Equation 4.31 that, after some manipulation, yields:
|
|
(4.64) |
where is the current position of node whereas is the contacting area associated to node . is the current center of the sphere and its radius. The variation of is not considered in this linearization.
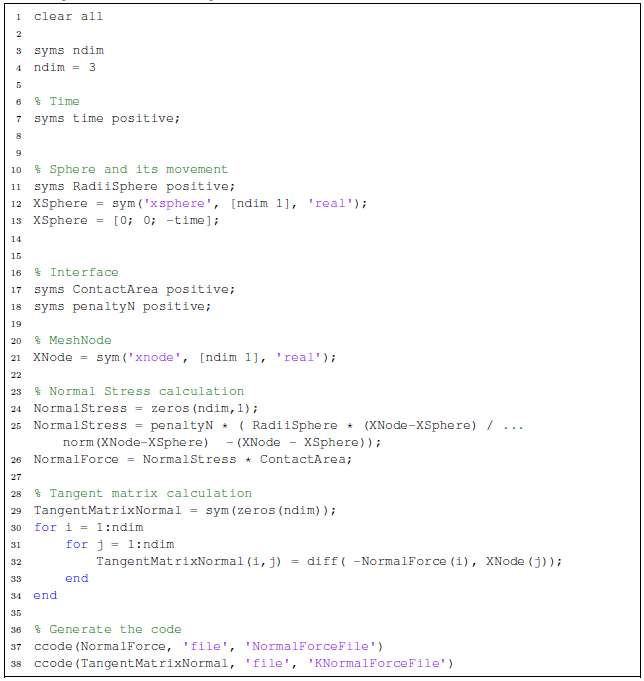
|
Interpreting the results of Matlab, one can get that the linearization of the normal contact constraint between a rigid sphere and a deformable media is:
|
|
(4.65) |
In order to evaluate the use of the exact linearized form the previous example is recomputed for the smooth contact interface. This way, the effect of the non-linearity induced by the elasto-plastic contact condition is obviated. The only result of interest is the computational time, since the same results are obtained because the only difference between both analyses lies in the tangent matrix of the system.
Figure 30 compares the evolution of the norm of the residual in the iterative procedure to solve the global problem. Surprisingly, the first step requires 9 iterations to converge using the exact linearization whereas only 4 with the approximated one. At the tenth step both simulations converge with a similar rate.
This behavior can be easily understood comparing both tangent matrices. The only difference appears in the second term of the exactly linearized form, Equation 4.65, that is not considered in the approximated one. In fact, a large penalty parameter produce that ; as such, this term is negligible compared to the first one. As a consequence, the exact and approximated matrices are not that different and the same convergence rates are observed.
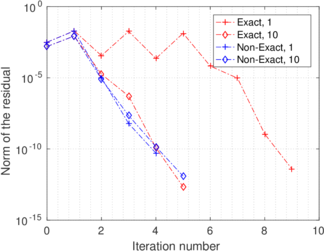
|
| Figure 30: Evolution of the norm of the error of the global problem during the Newton-Raphson scheme at the first and tenth steps using the exact and an approximated linearization. |
4.4.4 Triaxial test
The final example of this chapter consists on the simulation of drained and undrained triaxials in a Modified Cam Clay soil, where the friction between the soil and the plates is also considered. The difficulty of this example lies in the complex constitutive model of the deformable domain (where softening is expected) and the use of the Coulomb friction law in terms of effective stress:
|
|
(4.66) |
An sketch of the problem is depicted in Figure 32, that consists of an axisymmetric mesh; due to the resulting symmetry only the top half of the problem is simulated. The height of the sample is twice its radium. Then, the radial displacement is restricted on the left boundary whereas null vertical displacement is imposed in the bottom of the domain. In the undrained simulations null flux boundary conditions are imposed in all the boundary of the domain; on the other hand, a very large permeability is considered to allow for equalization. Table 3 presents the values of the constitutive parameters. The continuum is discretized with elements (see Section 5.3).
Figure 31 shows the load-axial strain curves for both, drained and undrained conditions. All curves share a common trade: at large axial deformations the load tends to slightly increase. This effect is produced due to the inclusions of large strains in the formulation: during the deformation the sample increases its base. Drained simulations present a remarkable softening, whereas the undrained counterpart doesn't show any. The load-displacement curves do not seem to be affected by the inclusion of the rough interface. In addition, the smooth case has been computed with two different structured meshes with two different characteristic element size; it is found that the load-displacement curve is not much influenced by the element size.
Figures 32 and 33 presents the contact force along the interface of drained and undrained simulations, respectively. Although very low interface friction ratios have been considered ( ranging from 0.05 to 0.1), tangential contact forces only appear at the distal part of the interface and almost the same results are obtained with both friction coefficients.
These figures also depict the preconsolidation pressure for all the analyses. Only the undrained simulations with a smooth interface presents almost uniform distributions. A uniform distribution might also have been expected from the drained simulations with the smooth interface. However, even at the first elastic computational steps the stress distribution is not uniform since the used contact strategy does not fulfill the contact patch test, as shown before. This small non-homogeneities in the stress fields during elasticity facilitate that the sample deform very differently in subsequent steps. As such, the inferior part of the sample remains in elastic regime in almost all the analysis whereas the upper part presents high levels of softening. This problematic can be easily solved prescribing displacements on the top of the sample instead of a contact interface. It must be pointed out that the results with two different computational meshes suggest that the used formulation does not suffer from high levels of mesh-sensitivity.
|
|
(kPa) | (kPa) | (kPa) | M | OCR | ||
|
0.01666 |
10.0 | 23.50 | 400.0 | 0.10 | 70 | 1.0 | 7 |
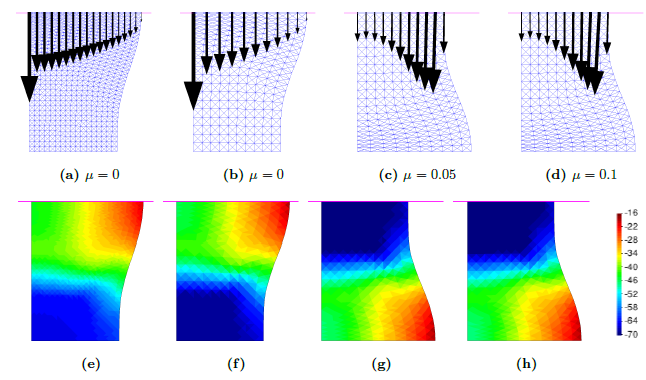
|
| Figure 32: Drained triaxial. Contact stresses along the interface and preconsolidation pressure (kPa) for different meshes and interface frictions |
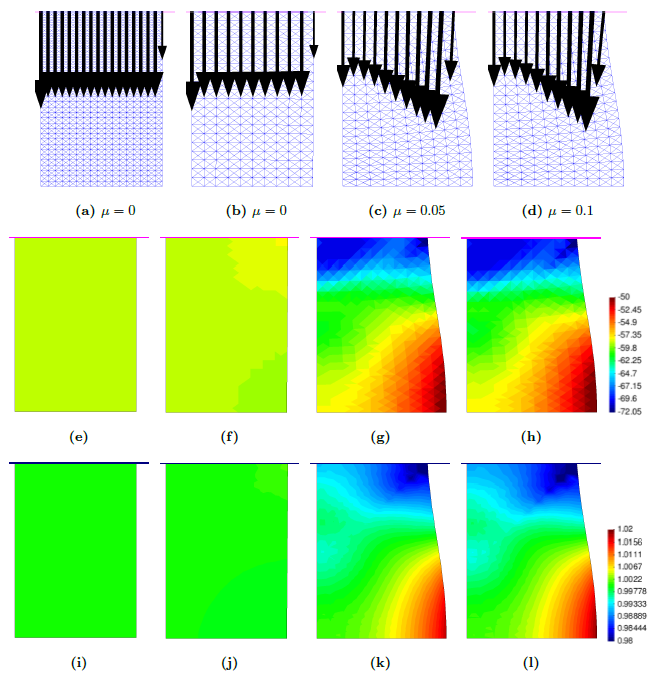
|
| Figure 33: Undrained triaxial. Contact stresses along the interface, preconsolidation pressure (kPa) and Jacobian for different meshes and interface frictions |
4.5 Concluding remarks
In this chapter, the basic relations of contact kinematics, the contact constraints and the contact boundary problem have been reviewed. In this work, contact constraints are discretized with a penalty method and the tangential part is modeled by an elasto-plastic analogy, that has been formulated in a way that fulfills the objectivity requirements. The contact tangential stresses are integrated implicitly and the developed algorithm retains the formal structure of one dimensional return mapping. Meanwhile, it has been noted that in the contact between an impervious rigid body and a deformable porous media, contact constraints are fulfilled naturally by using the simplified formulation.
In order to assess the implementation, first the contact patch test has been evaluated. While the plane strain and 3D implementation fulfill the patch test, the axisymmetric counterpart fails this test; it has been shown that this behavior is a consequence of an insufficient integration of the contact constraints.
The effect of the mesh discretization, the time step and the ratio between the tangential and normal penalty factors has been assessed in a simple example, the sliding of a deformable body on a rigid plane. Using the implicit integration technique results are not highly influenced by the time-step nor the spatial discretization. It has been shown that results are independent of the ratio between the penalty factors if this ratio is large enough.
Due to the similar formal structure of the elasto-plastic analogy with the classical gauss point elasto-plastic return mapping, an Implex integration scheme has been considered [99]. Numerical results have shown that the Implex method applied to the contact algorithms supplies additional computability capabilities with respect to the implicit integration of the contact forces. Due to the extrapolation nature of this scheme, results are influenced by the time-discretization and the ratio between penalty-ratios. However, the inclusion of a non-smooth interface may not introduce a new source of non-linearity: in some cases (the contact between a deformable body with a rigid plane) the tangent matrix to the contact forces is constant, making the problem step-linear. Evidences of this behaviour have been shown.
5 Development of mixed stabilized formulations for Soil Mechanics
The main items of the computational framework have been presented in the previous chapters; namely, the Particle Finite Element Method, the numerical treatment of the balance equations, the constitutive models along with the imposition of contact constraints. As such, the basic framework for the simulation of geotechnical insertion problems in clay have been described.However, an important feature of this kind of problem is that incompressibility may arise either from undrained conditions or as a consequence of material behavior; incompressibility may lead to volumetric locking of the low-order elements that are typically used in PFEM.
In this chapter, two different three-field mixed formulations for the coupled hydro-mechanical problem are presented, in which either the effective pressure or the Jacobian are considered as nodal variables, in addition to the solid skeleton displacement and water pressure. Additionally, several mixed formulations are described for the simplified single-phase problem due to its formal similitude to the poromechanical case and its relevance in geotechnics, since it may approximate the saturated soil behavior under undrained conditions. In order to use equal order interpolants in displacements and scalar fields, stabilization techniques are used in the mass conservation equation of the biphasic medium and in the rest of scalar equations. Finally, all mixed formulations are assessed in some benchmark problems and their performances are compared.
The linearization of the mixed formulations developed in this chapter is presented in Appendix C.
5.1 Introduction
For many porous materials, and particularly for water saturated soils, most observed mechanical responses cannot be explained without considering the fluid filling its pores. The appropriate general framework is that of poromechanics in which the continuum is considered to be composed of two phases (solid skeleton and water) whose interaction is expressed in appropriately formulated linear momentum and mass balance conservation laws. Extending PFEM to deal with poromechanics-based hydromechanical coupling seems then a necessary step to make the method relevant to a large class of soil mechanics problems.
There are two extreme situations for hydromechanical coupling [109]. The first one corresponds to freely drained conditions. In this case, there is no change in the fluid pore pressure and changes in total and effective stress coincide. The second situation corresponds to fully undrained conditions: there is no relative motion between water and soil skeleton and the mixture behaves like an incompressible material. These extreme situations may be dealt with using simpler single-phase formulations. For instance, for undrained conditions, elasto-plastic formulations using a quasi-incompressible elastic model alongside an isochoric plastic law are applicable.
Simpler models have several advantages, amongst them faster computation, but their field of applicability is limited to purely drained or undrained situations. A fully coupled formulation is required to address the full range of potential geotechnical problems. Naturally, a fully coupled formulation should have both free draining and undrained behaviour as limiting cases.
Undrained conditions in water-saturated soils result in quasi-incompressible behavior. This causes a well-known numerical problem when using the Finite Element method: volumetric locking of low-order finite elements. Volumetric locking introduces numerical stiffening and spurious high spatial variability in the solution, eventually leading to numerical instability. The reason behind this behaviour is the failure to satisfy the Babuska-Brezzy conditions [110,111] or the equivalent inf-sup condition [112] due to an improper finite-dimensional space in the finite element discretization. To avoid this problem two strategies are common: either to use more complex, but stable, finite elements [113,114], or to apply stabilization procedures to originally unstable finite elements [71,115,116]. In the latter approach, locking is mitigated at the cost of using a mixed formulation, thereby introducing extra degrees of freedom per node with respect to the primal formulation. Incompressibility may also arise under general drainage conditions in constitutive models of materials that predict zero volume change. This is the case, for instance, when failure is reached in Critical State soil models.
Addressing volumetric locking is thus necessary either in the fully coupled hydromechanical formulation or in the single-phase undrained approximation. The option adopted here to deal with this problem is the use of mixed formulations solved with low-order stabilized elements. This option has several advantages. First, in most cases it offers equal performance at lower computational cost than the use of higher order elements. Secondly, as pointed by [72,117], it is better adapted to cases were incompressibility may result from the mechanical behavior of the solid phase itself. Finally, it is easily adaptable to both the coupled hydromechanical and single-phase undrained formulations, taking advantage of their similar formal structure.
There are several possible mixed stabilized formulations which are relevant for these problems [66,71]. In this work alternative mixed stabilized formulations both for total stress and for coupled hydromechanical analyses at large strains are explored. In the total stress case, only the linear momentum balance equation is solved with a nearly incompressible elastic model and an isochoric plastic law. In the coupled hydromechanical case, the system of equations of linear momentum and mass balance equations is solved using a monolithic approach whereas the solid skeleton follows a critical state plasticity model. Thus, volumetric locking caused either by incompressibility at nearly undrained conditions or by incompressibility of the solid skeleton are both dealt with.
This chapter is structured as follows: first, the balance equations for the mechanical problem and the hydromechanical problem are described in its primal and mixed form including the stabilization terms. A brief discussion on the value of the stabilization parameters is also included. Then, the comparative performance of the different formulations implemented is explored via benchmark problems: first for the single-phase mechanical problem, and then for the hydromechanical problem. Finally, a number of conclusions are drawn. The linearization of the mixed formulations may be found in Appendix C.
5.2 Single-phase mechanical media
This section presents the balance equations relevant for the case of a single-phase continuous media. The governing equations are presented both in their primal form and then using mixed forms. After describing the stabilization procedures, the stabilized Galerkin expressions of the formulations are presented.
5.2.1 Strong form of the balance equations
A quasi-static linear momentum displacement-based finite element formulation in updated Lagrangian form (i.e. expressing all quantities and their derivatives in the deformed configuration), valid for two- and three- dimensional conditions may be written as:
|
|
(5.1) |
where is the Cauchy stress tensor, stands for the appropriate constitutive equation for path dependent materials (large strains elasto-plastic constitutive equations based on the multiplicative split [53] are used here, see Chapter 3), is the total deformation gradient and represents the set of internal variables of the model. stands for the initial displacement, is the external body force vector and () defines the boundary of the domain where displacements and tractions are prescribed.
The same problem may be restated using a mixed two-field displacement-pressure formulation. Introducing a volumetric/deviatoric decomposition of the Cauchy stress tensor, the standard expression of the strong form of the equilibrium equation becomes [58]:
|
|
(5.2) |
where is the deviatoric part of the Cauchy stress tensor, is the Cauchy pressure and stands for the second order identity tensor.
This kind of formulation is usually employed in Solid Mechanics to treat quasi-incompressible, pressure-insensitive materials. However, the aim is this work is to employ complex elasto-plastic models with coupled volumetric-deviatoric response even in the elastic regime. This is the reason beneath the fact that, in contrast with the common approach in Solid Mechanics [58,60], the definition of the volumetric constitutive model -Equation 5.2- has not been introduced.
A three-field displacement-Jacobian-pressure finite element mixed formulation of the same problem is also possible [53,58], where the volume in the current configuration per unit volume in the reference state, , is introduced in addition to displacements and pressure.
On the one hand, [53] proposed a formulation based on the same strong form where pressure and volume change variables are approximated by different order shape functions; not only that, these variables are discretized by element-discontinuous shape functions, so the value of the pressure and volume change fiels may be evaluated explicitly at element level based on displacements and the stress tensor. As such, the non-linear system of equations that appear after introducing the discretization may be written only in terms of the displacement field. Additionally, in the development of the formulation it is assumed that the volumetric and deviatoric response are uncoupled, the pressure field is computed with in plane strain conditions and, finally, instead of approximating the Jacobian, , the degree of freedom corresponding to the volume change is used for the Hencky strain, .
On the other hand, the formulation proposed by [58] admits constitutive models whose volumetric and deviatoric resopnse is coupled. However, no special treatment to plane strain conditions is given. As it will be shown in Appendix C, the tangent stiffness matrix to be used in the Newton-Raphson algorithm is different in plane-strain conditions and three-dimensional problems.
The mixed strong form of the equilibrium is now given by
|
|
(5.3) |
where is the determinant of the deformation gradient, is the volumetric deformation and is the Cauchy stress evaluated with the assumed deformation gradient . For this formulation, the second Piola-Kirchhoff stress tensor is related to the Cauchy stress tensor as:
|
|
(5.4) |
The assumed deformation gradient is defined as:
|
|
(5.5) |
That is, the deviatoric part of the deformation gradient, , is preserved whereas the volumetric part, , is replaced with the variable. Note that in this formulation the Cauchy stress tensor depends on both, displacements and on the Jacobian. Despite that, the usual form of strain-driven stress integration schemes are completely suitable for this formulation.
In plane strain conditions, the assumed deformation gradient, Equation 5.5, has to be redefined in order to guarantee that the out of plane component of the deformation is equal to unity. As in the -method (F-bar method), the two-dimensional assumed deformation gradient is [118,119]:
|
|
(5.6) |
Then, the constitutive model is evaluated with the three dimensional assumed deformation gradient:
|
|
(5.7) |
The previous formulation adds two extra balance equations with respect to the displacement-based formulation. As it will be shown in Section 5.2.3, where the discrete Finite Element equations are presented, this fact results in the addition of two degrees of freedom per node ( and ) with respect to the primal formulation. It becomes unclear which of the two extra equations may be then responsible for any improvement on the volumetric locking effect. To clarify this point, a third mixed formulation, having only the displacement and the volume deformation as independent variables (the formulation), will also be assessed:
|
|
(5.8) |
5.2.2 Weak form
The weak form of the formulations are obtained as usual, multiplying the strong form of the balance equations for test functions and integrating over the entire domain. To show the expression in the most complex case, the weak form of Equation 5.3 is written as:
|
|
(5.9) |
where is the deviatoric projection tensor. Being , and valued functions in the space of virtual displacements , virtual volume Jacobians , and virtual pressures , respectively.
5.2.3 Finite element discrete equations
In order to obtain the finite element discrete equations of the weak form of the mixed formulations, first the nodal variables are approximated with the FE shape functions
|
|
(5.10) |
where , and are finite element approximations of displacement, the Jacobian and the pressure whereas , and are the nodal values. The same order interpolation functions are used for scalar fields and displacements: and where is the number of nodes.
The matrix form of the Galerkin expression of the formulation, Equation 5.3, is obtained introducing the previous approximations to the weak form, Equation 5.9:
|
|
(5.11) |
where the matrices and vectors of Equation 5.11 are defined as
|
|
(5.12) |
|
|
(5.13) |
|
|
(5.14) |
|
|
(5.15) |
|
|
(5.16) |
|
|
(5.17) |
where has the same form that the small deformation strain-displacement matrix [120] and corresponds to the Voigt notation of tensor .
5.2.4 Stabilization of the mechanical problem. Final matrix form.
In our approach, linear shape functions are used for all the variables of the mixed formulations. The stabilization method used is the so-called Polynomial Pressure Projection (PPP) proposed by [69,73]. This technique has already been introduced in Section 2.4.8.1, where it has been applied to stabilize the mass balance equation of the hydro-mechanical problem.
To stabilize the mixed forms given by Equations 5.2, 5.3 and 5.8 we add at each element the projection operator to the scalar continuity equations.
|
|
(5.18) |
where is the stabilization parameter, is the material shear modulus and is the best approximation of the pressure in the space of polynomials of order .
Then, the discrete and stabilized finite element equations of the formulation, Equations 5.3 and 5.11, are written as:
|
|
(5.19) |
where the stabilization factors for and for are and respectively and
|
|
(5.20) |
where are the set of projected polynomials; in the case of linear triangles, these local element polynomials are .
On the other hand, the discrete stabilized equation of the formulation, Equation 5.8, is expressed as
|
|
(5.21) |
And finally, the equations of the formulation, Equation 5.2, read
|
|
(5.22) |
5.3 Fluid-saturated multiple phase porous media
This section extends the previously introduced stabilized mixed formulations for one-phase problems to the hydromechanical formulation of fluid-saturated porous media. As such, first the strong form of the governing equations is presented in its primal form and two mixed formulations are proposed. After describing the discrete finite element matrix expression, the stabilizations methods are presented.
5.3.1 Strong form
The balance of mass and linear momentum equations for multiple-phase deformable porous media using a displacement-water pressure formulation in quasi-static cases, may be written in the current deformed configuration as:
|
|
(5.23) |
where is the Cauchy water pressure, is the material time derivative with respect to the solid phase, is the water compressibility and is the Darcy's velocity. The boundary of the domain is divided in two parts, (), where fixed water pressure and prescribed water flow are imposed.
According to the principle of effective stress, the total stress tensor, , is equal to the sum of the pore pressure, , and the effective stress, :
|
|
(5.24) |
and the effective stress, which only depends on the strains of the solid skeleton, is defined as
|
|
(5.25) |
Two different mixed formulations for the coupled poromechanics problem are explored for use in PFEM. The first one is the displacement-effective pressure-water pressure (), which is expressed in the strong form as follows:
|
|
(5.26) |
The second mixed-formulation explored is a displacement-Jacobian-water pressure () formulation given by:
|
|
(5.27) |
In both formulations (Equations 5.26 and 5.27), the appropriate initial and boundary conditions are considered.
For completeness a displacement-Jacobian-effective pressure-water pressure formulation could have been also eventually tested. This has not been done, since, as shown below, results for the single-phase media indicated that the extra degree of freedom added in the more complex formulation did not achieve any relevant improvement in the solution with respect to simpler mixed formulations.
5.3.2 Finite element discrete equations
After obtaining the weak form of the problem, the semi-discrete equations of the primal formulation, Equation 5.23, are given by:
|
|
(5.28) |
where the water pressure is approximated as , the constitutive equation of the Darcy's flow has been introduced and
|
|
(5.29) |
|
|
(5.30) |
|
|
(5.31) |
where is the gravity.
5.3.3 Stabilization of the mass conservation equation. Final matrix form.
As already commented -Section 2.4.8- , the monolithic approach of the hydromechanical problem fails to satisfy the inf-sup condition in the undrained limit if equal order interpolants are used for both displacement and water pressure [66].
Introducing the Fluid Pressure Laplacian stabilization term (FPL) [71] -that has been presented in Section 2.4.8.3-, the semi-discrete equations of the primal formulation, Equation 5.23, are given by
|
|
(5.32) |
where
|
|
(5.33) |
is the stabilization matrix and is the stabilization factor.
On the other hand, the mixed formulations, Equations 5.26 and 5.27, read
|
|
(5.34) |
|
|
(5.35) |
where and
|
|
(5.36) |
As before PPP stabilization of the scalar balance equation is applied in the and formulations. In addition, the mass balance equation is also stabilized in all cases, using the procedure that is described above.
These equations are solved with a monolithic approach and an implicit time integration scheme is used. That is, the derivative of the water pressure is approximated as and the velocity of the solid skeleton is .
On the mixed formulation the following relation is used
|
|
(5.37) |
5.4 Selection of the stabilization factors
The discrete equations of the mixed forms for the mechanical problem, Equations 5.19, 5.21, and 5.22, include several stabilization factors that need to be estimated, namely and . For the case of the equation of balance of pressure, the value proposed by [58] is used:
|
|
(5.38) |
whereas, in the equation of the Jacobian, .
In the extension of these mixed forms to the hydromechanical problem, Equations 5.34 and 5.35, an additional stabilization parameter appears related to the stabilization of the balance of mass of the mixture in addition to those related to the effective pressure and the Jacobian. For the equations related to the effective response of the mixture -that is, the equations of the effective pressure and the Jacobian-, the same values of the stabilization parameters than those used for the mechanical problem are utilized ( and ). Meanwhile, the value proposed in section 2.4.8 for the stabilization factor for the equation of balance of mass of the mixture is employed:
|
|
(5.39) |
where is the element size, is the constrained modulus and is the coeffient of consolidation.
5.5 Numerical assessment
In this section, a set of examples of increasing numerical complexity are employed to assess the performance of the different mixed formulations presented above in PFEM. An effort is made to separate effects due to the specific choice of mixed formulation from issues that are related to other aspects of PFEM. The first two examples involves the indentation of a rigid-strip footing into a single-phase incompressible material (representing an undrained soil). In the third example, a flexible circular footing resting in a Modified Cam Clay soil is used to assess the two-phase formulations; a wide range of loading conditions -ranging from drained to undrained- are used. Finally, the method is applied to the modeling of a more challenging geo-mechanical problem: a Cone Penetration Test with pore pressure measurement (CPTu).
5.5.1 Footing nearer a vertical cut on a one-phase deformable media
The first computational analysis consist of total stress penetration of a strip footing that is located near a vertical cut. This is a classic example problem analyzed, among others, by [68]. The domain consists of a square whose edges are five times the width of the footing; all the displacements are restricted at the bottom of the domain whereas the horizontal displacements are restricted to zero in the right boundary. The objective of this example is to compare the displacement-based finite element formulation with the mixed stabilized displacement-pressure () formulation to tread quasi-incompressible materials.
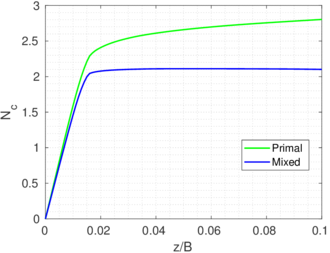
|
| Figure 34: Footing near a vertical cut. Normalized settlement vs normalized resistance using the primal and mixed displacement-pressure formulation. |
The soil is assumed weightless and characterized by a shear modulus, kPa, a Poisson’s ratio, = 0.49, and the undrained shear strength, kPa. Due to the symmetry of the problem, a two-dimensional plane-strain model is used. A vertical velocity is applied on the top of the footing, idealized as an elastic material of shear modulus two orders of magnitude higher than that of the soil. Remeshing is disabled in a first computation, to assess the effect of the mixed formulation in isolation. The mesh is depicted in Figure 35.
Figure 34 presents the curve normalized settlement vs normalized soil resistance. The first thing to note is that in the curve obtained by using the primal formulation the normalized resistance increase continuously. On the other hand, by using the mixed stabilized formulation after a normalized penetration of the value of the resistance remains almost constant. In general higher resistances are found at every displacement when using the primal formulation. Finally, it is noted that the normalized resistance obtained with the mixed-stabilized formulation is slightly higher than 2, which is in agreement of the results presented by [68].
The behavior of the primal formulation is a consequence of the severe volumetric locking affecting low order finite elements. Furthermore, as shown in Figure 35, the results obtained using the primal formulation present high amplitude spatial oscillations on the total mean stress field whereas a much smoother distribution is found when using the mixed-stabilized formulation. It should be noted that for the primal formulation, the total mean stress is computed as the trace of the Cauchy stress tensor at integration points whereas for the mixed formulation corresponds to the nodal variable. Additionally, using the primal formulation, localization takes place in a shear plane whose orientation is influenced by the preferential mesh orientation. On the other hand the localization plane obtained by the stabilized-mixed formulation is very similar to that obtained by [68].
5.5.2 Rigid footing resting on a one-phase deformable media
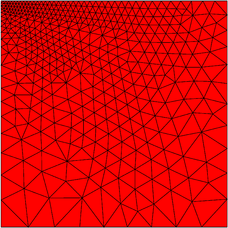
|
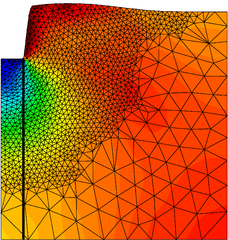
|
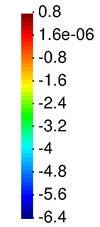
|
| (a) | (b) | (c) |
| Figure 36: Rigid Footing test. . Initial and final finite element mesh with indication of the position of the vertical profile. Contour plot of the pressure (kPa). | ||
![Rigid Footing test. Ir=33. Normalized load-displacement curve for different formulations along with the reference solution of [14].](/wd/images/thumb/5/59/Draft_Content_325409517-monograph-Fig_LD1.png/300px-Draft_Content_325409517-monograph-Fig_LD1.png)
|
| Figure 37: Rigid Footing test. . Normalized load-displacement curve for different formulations along with the reference solution of [14]. |
In this example, a rough rigid strip footing is pushed into a weightless Tresca soil. Footing displacement is imposed using Dirichlet boundary conditions. Due to the symmetry of the problem, only half of the problem is computed. The geometry of the domain (initial and final mesh) is depicted in Figure 36. Geometry and constitutive parameters ( kPa, and kPa; resulting in a rigidity index, , of 33), are identical to those used by [14]. These authors analyzed this problem using an ALE (Arbitrary Lagrangian-Eulerian) method, investigating the effect of different high-order elements on the primal formulation.
Figure 37 presents curves of normalized settlement vs normalized soil resistance for the three stabilized formulations. The normalized limit resistance provides a bearing capacity factor for this problem, , where is the vertical stress applied by the footing and the strength of the soil. A reference solution from [14] (obtained with 21-noded elements) is also included for comparison purposes.
It is clear that all the solutions obtained with stabilized formulations match the reference solution. The oscillations in these curves result from errors introduced at remeshing events and are independent of the mixed formulation employed. Indeed, the sudden drops in resistance are related to the size of the elements close to the rigid footing. With the mesh adaptive procedures of PFEM nodes initially belonging to the contour of the domain are kept at the contour and its position is never modified. However, to maintain accuracy, new nodes may be inserted when the distance between two adjacent nodes at the contour becomes to large, or a node may be deleted when it comes too close to another node. In this problem, the last node with prescribed displacements (representing the footing corner) and the first node without restrictions (corresponding to the soil adjacent to the corner) tend to separate. The insertion of a new node in the middle of this segment causes the periodic drops in the resistance curves.
The effect of the different mixed formulations is more visible in the vertical profiles of stresses presented in Figure 38(a). Stresses obtained with the and formulations show smaller scatter than those resulting from the formulation show more. This is even clearer when the stress invariants alongside the same vertical are plotted (see Figure 38(b)); the main differences affect the Lode angle, that it is almost coincident for the two formulations that have the Jacobian as a nodal variable. In contrast, in the formulation that does not have the Jacobian as a nodal variable, the Lode angle shows a large scatter, particularly on the upper 2 m, where the plastic region is located. Due to the definition of the yield surface, the scatter in Lode angle explains also the variations of the second stress invariant () in the same region.
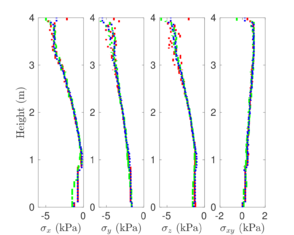
|
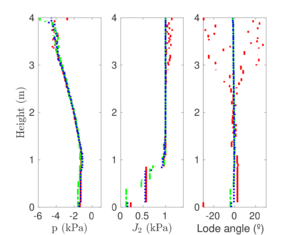
|
| (a) | (b) |
| Figure 38: Rigid Footing test. . Stress state along the vertical line indicated in Figure 36 at a penetration depth of ; Cartesian components of the Cauchy stress (a) and stress invariants (b). (red), (green) and (blue). | |
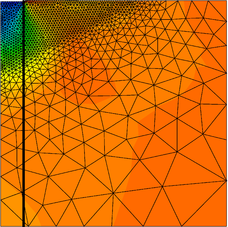
|

|
| (a) | (b) |
| Figure 39: Rigid Footing test. . Final finite element mesh with indication of the position of the vertical profile. Contour plot of the pressure (kPa). | |
It may be questioned if the stress scatter noticed above is due solely to the choice of mixed formulation. To clarify this aspect a further analysis has been performed. The geometry and definition of the problem are the same, but now the soil is considered more rigid ( kPa, , kPa resulting in ), so that failure will be reached at lower displacements. Also, mesh refinement is disabled.
Figure 39 shows the mesh at the end of computations; since displacements are small, the mesh is not distorted, despite the achievement of a clear limit load (at a footing penetration ; see Figure 40). As before, the differences in normalized resistance between the formulations are small, with the formulation indicating a slightly higher (2%) limit load. More importantly perhaps, the vertical profiles of stress components and invariants, Figure 41, show unequivocally that including the Jacobian as a nodal variable practically eliminates the scatter on computed Lode angle. Although in this problem such scatter has not caused significant problems at the global scale, this may not always be the case.
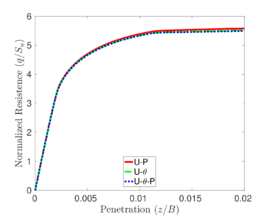
|
| Figure 40: Rigid Footing test. . Normalized load-displacement curve for different formulations. |
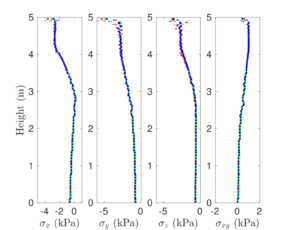
|
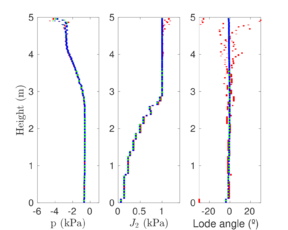
|
| (a) | (b) |
| Figure 41: Rigid Footing test. . Stress state along the vertical line indicated in Figure 39 at a penetration depth of ; Cartesian components of the Cauchy stress (a) and stress invariants (b). (red), (green) and (blue). | |
5.5.3 Flexible circular footing resting on a two-phase deformable media
The various two-phase formulations are examined using a problem that involves a flexible circular footing loading in a compressible clay. A similar geometry to the previous example is used; however, this case is axisymmetric and the footing is discretized with a load boundary condition. The model has a 0.25 m thick layer of elastic material placed on the top of the domain in order to avoid the problems that arise in the Modified Cam Clay model when the stress state approaches zero effective pressure. This layer of elements is always discretized using elements. The initial stress state is obtained using a value of the coefficient of lateral stress, . The problem and the values of the constitutive parameters (Table 4) are similar to the ones presented in [121]; although they were using plane strain conditions and the initial stress state was obtained differently.
A vertical load of 100 kPa is applied at a constant rate over a period of time; afterwards, this load is held constant to allow consolidation. Three different loading times () are used: 0.001, 10 and 1000 days. The computational time-step is .
Figure 42 depicts the vertical displacement at the centerline of the footing as a function of the normalized time, . For the fastest and slowest loading rates displacements cease to increase once the loading phase ends. Loading at the intermediate rate shows initial stiffness similar to the fast case and final settlement similar to the slow case. Figure 42 also plots the variation of water pressure at a point located below the footing center at a depth equal to the footing diameter. For the fastest loading rate, water pressure increases until the end of the loading phase; then remains constant. At the slowest loading rate no excess of pore pressure is generated, although a small hydrostatic increase (from 10 kPa at the initial state to 10.30 kPa at the end of the problem) is computed due to the settlement of the observation point. For the intermediate loading velocity the water pressure increases initially, attains a maximum at the end of loading and then decays.
In summary, the response is fully undrained in the fast case, fully drained in the slowest case and shows some consolidation at the intermediate loading rate. For the three loading rates there is little discrepancy between the solutions computed with the different formulations. The formulation predicts slightly smaller settlements and (at the faster loading rate) smaller pore pressure generation.
|
|
OCR | M | E | ||||||||
| (kPa) | (kPa) | (m/s) | (kPa) | ||||||||
|
MCC |
0.05 | 10.0 | 0.0 | 200.0 | 0.10 | 1.5 | 1.0 | - | - | ||
| Elastic | - | - | - | - | - | - | - | 1000 | 0.0 |
5.5.4 Cone penetration test
The cone penetration test (CPTu) is one of the most widely used in situ geotechnical testing methods. During the test an instrumented cone is pushed into the ground at a controlled rate. Tip resistance and sleeve friction are always recorded, and, very frequently, the pore water pressure just behind the cone tip ( position, see [122]) is also measured. From these measurements, stratigraphy and constitutive soil parameters are estimated based mostly on empirical correlations.
A CPTu in a Modified Cam Clay soil is performed. The cone is assumed rigid and smooth; contact between cone and soil is enforced using a Penalty method. Soil parameters are listed in Table 5; these values and the geometry of the problem try to mimic the case examined by Sheng et al using an ALE method [123].
The soil is weightless and the initial stress state imposed is given by kPa and kPa. At the beginning of the computation the cone is wished-in-place with the tip at a depth of 2.8 cone radii. The cone is advanced downwards at cm/s; a parametric analysis performed by [123] indicates that undrained conditions will prevail at that velocity.
|
|
(kPa) | (kPa) | (kPa) | M | (m/s) | ||
|
0.016 |
10.0 | 23.50 | 400.0 | 0.10 | 70 | 1.0 |
Net cone tip resistance, , computed adding vertical forces from nodes at the cone tip and subtracting the initial vertical stress, is represented against normalized penetration in Figure 43. Pore water pressure at the position -computed interpolating from boundary nodes closer to the cone shoulder point- is shown in Figure 43(d). Results are presented for the and for the formulations (the gave similar results to the latter).
Although the cone resistance shows some scatter, Figure 43(a), a stationary state may be identified after a penetration of 10 radii. At that stage net cone resistance is approximately 155 kPa for the formulation and 170 kPa for the formulation. In [123] a value of 150 kPa was obtained although using a different numerical approach. The formulation results in a smoother penetration curve. This smoother response is even clearer on the pore-pressure curve, Figure 43(b), whereas the amplitude of the pore pressure oscillations is very large for the formulation.
Figure 44 presents the values of water pressure and volumetric deformation obtained for both formulations at . The small volumetric deformations confirm that the analysis is performed in almost undrained conditions. The water pressure field exhibits large gradients close to the position. This explains the oscillatory nature of the numerical record but not why the oscillations have smaller amplitude for the formulation. Indeed the distribution of the water pressure field is similarly smooth in both cases at the overall domain scale. This is consistent with the fact that both formulations use the FPL stabilization method in the mass balance equation.
The overall smoothness hides some local differences. In the formulation some oscillations appear just below the tip of the cone; in addition, along the shaft of the penetrometer, slightly higher water pressures are found compared to the other formulation. Also, in the formulation, marginally higher volumetric deformations are obtained at the shaft, indicating slightly higher water pressure dissipation.
Local differences are more noticeable when the stress fields are considered. Figure 45 compares the stress state at the final penetration position for both formulations. Using the formulation, the effective mean pressure, the deviatoric stress invariant and the preconsolidation stress, exhibit large oscillations near to the penetrometer; that is in areas where the soil has undergone large plastic shearing. On the other hand, when using the formulation all these stress fields are smoother. This is consistent with the fact that the momentum equation is also stabilized for this formulation. Stress field oscillations close to the penetrometer affect also the normal contact stresses along the shaft: a smoother stress profile is obtained with the formulation, see Figure 43. These local variations in normal contact stress are the likely cause behind the observed large amplitude oscillation of the pore pressure record at the position in the formulation. The benefits of extended stabilization for this coupled case are therefore evident.
5.6 Concluding remarks
For many porous materials, and particularly for saturated soils, most observed mechanical responses cannot be explained without considering the fluid filling its pores. Thus, the appropiate framework is that of poromechanics, in which the governing equations are the linear momentum and mass balance of the mixture; the constitutive models are well-established for soil mechanics formulations (Cam-Clay with Houlsby hyperelasticity; Darcy’s law). Additionally, a classical formulation for undrained problems is the use of a single-phase formulation with a quasi-incompressible elastic model alonside an isochoric plastic law.
These two material descriptions have in common a potential for incompressibility that may cause numerical problems if not addressed in the formulation of the problem. The focus of the chapter has been the development of stabilized mixed formulations for low order finite elements.
Three different one-phase mixed formulations for the mechanical problem have been assessed: the , and formulations. In all of them the Polynomial Pressure Projection (PPP) technique is applied to stabilize the scalar field variables. In the case examined (penetration of a rigid strip footing) all the alternatives appear to perform well at the global response level. However, the formulation , which does not have the Jacobian as a nodal variable, presents significant spurious oscillations in the value of the Lode Angle. When the Jacobian is present no particular advantage is obtained from adding also the mean pressure as field variable.
Noting that the effective pressure and the specific volume change are here the relevant nodal variables, analogous mixed formulations -() and ()- were explored for the poromechanical formulation. In addition to the PPP stabilization, a Fluid-Pressure-Laplacian stabilization of the mass conservation equation was also applied to the primal hydromechanical formulation, .
The performance of the alternative mixed formulations was similar as in the single-phase case. For the first example -a flexible circular footing resting on a Modified Cam Clay soil- a very similar global response was obtained in terms of water pressure and displacements. Significant differences between formulations arose in the more challenging final example, a CPTu in clay, that involves a contact problem with severe geometric non-linearities in almost undrained conditions. Using the primal formulation, with only a FPL mass-stabilization, was not enough to avoid high amplitude oscillations of the excess pore-pressure record at the -experimentally crucial- cone shoulder position. That was a consequence of oscillations in the stress fields in regions of large plastic deformations. The use of a Jacobian based mixed formulation () with extra PPP stabilization terms resulted in a significantly improved response. This better behaviour obtained with the formulation makes this mixed form the best candidate to face soil mechanics problems within PFEM.
6 Numerical simulation of undrained insertion problems in geotechnical engineering
This chapter presents total-stress numerical analyses of large-displacement soil-structure interaction problems in geomechanics using the Particle Finite Element Method (PFEM). The performance of the method is demonstrated by several numerical analysis of increasing complexity; namely, the insertion of a rigid strip footing, the T-Bar and a rough cone penetration test. These three problems have been frequently used as benchmark problems to assess the robustness and accuracy of large-strain geotechnical codes; thus, allows to compare the performance of the developed numerical scheme with other techniques. It is shown that the proposed method requires fewer computational resources than other numerical approaches addressing the same type of problems.
6.1 Introduction
The coupled-hydromechanical problem encompasses two different extreme situations [109]. The first one corresponds to freely drained conditions. In this case, there is no change in the fluid pore pressure and changes in total and effective stress coincide. The second situation corresponds to fully undrained conditions: there is no relative motion between water and soil skeleton and the mixture behaves like an incompressible material. These extreme situations may be dealt with using simpler single-phase formulations. For instance, for undrained conditions, elasto-plastic formulations using a quasi-incompressible elastic model alongside an isochoric plastic law are applicable (total stress approach). Of course, the coupled formulation is required to address the full range of potential geotechnical problems, but, naturally, the fully coupled formulation have both free draining and undrained behavior as limiting cases.
In a total stress setting, the behavior of the biphasic porous medium is completely captured by using a quasi-incompressible elastic model and an associated perfectly-plastic Tresca model; as such, only two parameters are required to describe the medium: the undrained shear strength, , and the shear modulus, . These undrained constitutive parameters -in contraposition to effective parameters- are more straightforward to obtain in standard field and laboratory tests [124].
The study of penetration problems in clay soils have traditionally relied on the simplified total stress concept, since the loading velocity is significantly larger than the dissipation rate and, thus, practically undrained conditions prevail. Consequently, simpler constitutive models and balance equations may be used.
This chapter focuses on numerical simulations employing a total stress approach. As already noted in Chapter 5, quasi-incompressible elastic models in conjunction with isochoric plastic laws lead to volumetric locking of the low order elements typically used in PFEM; to alleviate this pathology mixed stabilized elements are employed.
The material behavior is described with an quasi-incompressible elastic-perfectly plastic Tresca model. The interface tangential slip follows a von Mises yield criterion:
|
|
(6.1) |
where is the tangential contact stress at the interface. Then, the maximum shear stress admissible between the soil and rigid body interface is a fraction of the undrained shear strength of the soil, .
In this chapter several analysis of increasing numerical complexity are presented to illustrate the performance of the method; additionally, the results reported here are compared with previous numerical and/or analytical solutions. The first one involves the penetration of a perfectly rigid rough footing into a soil and it is used to discuss the influence of remeshing procedures. Afterwards, results of two important penetration problems involving contact interface slip of increasing difficulty, namely the T-Bar and the CPT, are reported to assess the accuracy and robustness of the numerical method.
6.2 Strip footing on clay
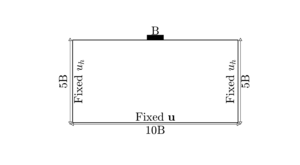
|
| Figure 46: Problem definition: a strip footing on undrained soil layer. |
| Case | Formulation | Mapping | Initial Mesh | Initial number of elements | Final number of elements | (z/B = 1) |
| PFEMF1 | Displacement (-only) | Centroid | Coarse | 14427 | 14556 | 9.34 (at z/B = 0.25) |
| PFEMF2 | Mixed stabilized () | Centroid | Coarse | 14427 | 14601 | 7.14 |
| PFEMF3 | Mixed stabilized () | Centroid | X-Coarse | 1669 | 4669 | 7.04 |
| PFEMF4 | Mixed stabilized () | Least Square | X-Coarse | 1669 | 4977 | 7.17 |
| PFEMF5 | Mixed stabilized () | Centroid | Half X-Coarse | 832 | 2551 | 7.16 |
The first analysis involves the computation of bearing capacity for a strip footing lying on a weightless uniform Tresca soil (Figure 46), pushed to a depth equal to the footing width. The contact algorithm is not yet involved, because instead of simulating the footing as a rigid body the problem is simplified prescribing a uniform vertical displacement as boundary condition. The example is used instead to illustrate the benefits of the stabilization procedure and to explore the influence of the different mesh mapping schemes described above. As this problem has been frequently addressed in the literature, it does also allow some comparisons with other numerical approaches.
As shown in Table 6, the first 5 cases analyzed differ in several numerical aspects: formulation of the governing equations, mapping rule, number of elements at the beginning and at the end of the simulation. The mixed stabilized formulation of the governing equations was applied in all cases, except in PFEMF1, where a displacement only formulation was used. The stabilized cases differed in the choice of initial mesh and in the mapping procedure applied between successive meshes.
The terminology used to label the different meshes employed was inspired by [14]. For instance, the “coarse” discretization employed for cases PFEMF1 and PFEMF2 used twice the number of nodes of Kardani:2014 “coarse” case (the difference arising because here the symmetry of the problem was not used to reduce the model).
All these cases used the same set of material parameters, also taken from Kardani:2014 and are characteristic of a very soft clay ( kPa, kPa, ). These values imply a rigidity index, , of 33. The rigidity index is defined as the ratio between the shear modulus, , and the undrained shear strength, .
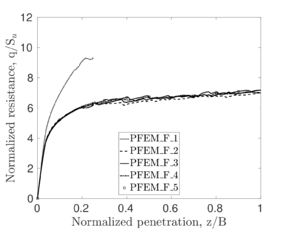
|
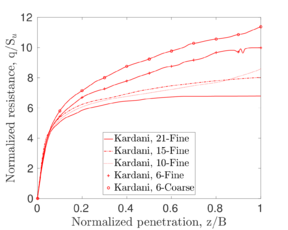
|
| (a) | (b) |
| Figure 47: Rigid footing penetration on Tresca soil. Effect of different numerical options on the normalized load settlement curves. for all cases (a) G-PFEM parametric analyses (see Table 6) (b) EALE parametric analyses presented by [14] (see Table 7 for details). | |
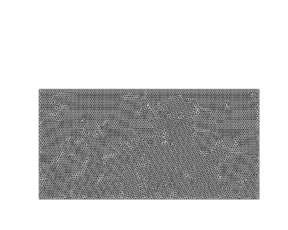
|
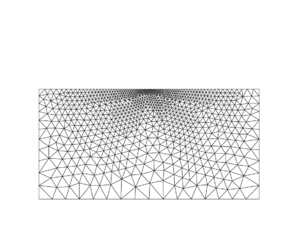
|
| (a) PFEMF2 | (b) PFEMF4 |
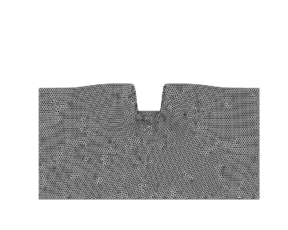
|
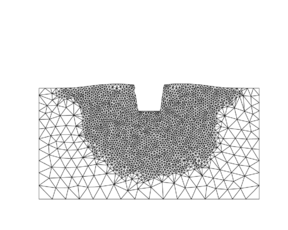
|
| (c) PFEMF2 | (d) PFEMF4 |
| Figure 48: Initial, (a) and (b), and final, (c) and (d), mesh for two different initial discretizations of the footing problem. | |
Figure 47(a) presents curves of normalized settlement vs normalized soil resistance for these 5 cases. The normalized limit resistance provides a bearing capacity factor for this problem, , where is the vertical stress applied by the footing and the strength of the soil.
The first thing to note is that the curve obtained using the displacement only formulation (PFEMF1) is much higher than those obtained using the mixed stabilized formulation. This is a consequence of the spurious increase in stiffness that results from volumetric locking. Indeed, the oscillations on the mean-pressure field caused by this problem became so severe that the computation of this case could not be finished.
The other four cases show a very similar response. Normalized load-displacement curves show some small oscillations that are mostly due to the lack of equilibrium of the interpolated fields after remeshing. It is apparent that these oscillations remain controlled. Neither the coarseness of the initial mesh, (compare PFEMF2 and PFEMF3), nor the enforcement of problem symmetry, (compare PFEMF3 and PFEMF5), seem to have much influence in the solution.
The mapping algorithm came more into play for simulations using the initially coarser mesh (termed “X-coarse” or extra-coarse), because there mesh refinement was more pronounced (Figure 48(d)). Again, the effect of this numerical choice on the solution was minimal. Because of the good performance of nearest-neighbor interpolation and its relatively smaller computational cost, this strategy was adopted in all the following examples.
It is interesting to compare these results with those of a parametric study of the same case presented by [14] using the EALE method. They analyzed the problem with different higher-order elements (6-node, 15-node and 21-node elements) using structured meshes in which the number of degrees of freedom was maintained constant –hence trading element order for number of elements. Two levels of discretization were explored, a coarse mesh with 3721 nodes and a fine one with 14641 nodes. The results obtained in several of their analyses are reproduced here as 47(b).
| Case | Elements | Interp. order | Degrees of freedom | Gauss points | |||
| Initial | Final | Initial | Final | () | |||
| PFEMF5 | 3-noded triangle | 1 | 1371 | 3978 | 832 | 2551 | 7.16 |
| EALE-6-Coarse | 6-noded | 2 | 7442 | 7442 | 10800 | 10800 | 11.38 |
| EALE-6-Fine | 6-noded | 2 | 29282 | 29282 | 43200 | 43200 | 9.99 |
| EALE-10-Fine | 10-noded | 3 | 29282 | 29282 | 19200 | 19200 | 8.59 |
| EALE-15-Fine | 15-noded | 4 | 29282 | 29282 | 21600 | 21600 | 8.02 |
| EALE-21-Fine | 21-noded | 5 | 29282 | 29282 | 18432 | 18432 | 6.73 |
The stiffer response obtained in EALE with smaller-order elements may be interpreted as an effect of volumetric locking. It is well-known that one possible strategy to attenuate locking is, precisely, to increase the interpolation order of the elements. This, however, adds some extra computational cost. Table 7 presents a comparison of computational cost indicators (interpolation order, degrees of freedom, Gauss points) for this EALE models and model PFEMF5 -the one closer in geometry, as all the EALE models had imposed symmetry. It would seem that for this type of problem GPFEM offers some computational advantage: similar performance is obtained with order of magnitude savings on integration point numbers and d.o.f.
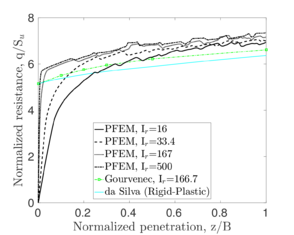
|
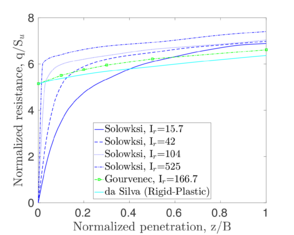
|
| (a) | (b) |
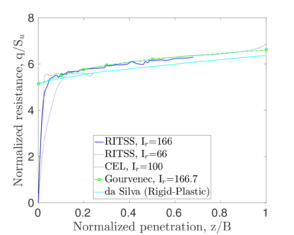
| |
| (c) | |
| Figure 49: Rigid footing penetration on Tresca soil. Effect of rigidity index on the normalized load settlement curves. (a) G-PFEM parametric analyses using model PFEMF3 (see Table 6) (b) MPM parametric analysis by [22] (c) ALE results. | |
A separate parametric analysis of this case has been performed to explore the effect of the rigidity index on the solution. The base model used in the analysis is PFEMF3. The undrained shear strength and Poisson ratio is kept constant and Young modulus is varied to cover a range of between 16 and 500, (16, 33.4 167 and 500).
Figure 49(a) shows the normalized load vs penetration curves that result from this analysis. As may be expected, the effect of rigidity index is very pronounced at the beginning of the loading, becoming less important as penetration progresses. The analysis was stopped at a penetration depth equal to footing width (1 m). At that stage the normalized resistance is similar for all the cases, between 6.9 and 7.3; larger values are encountered as the rigidity index increases.
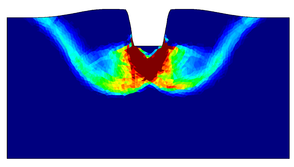
|
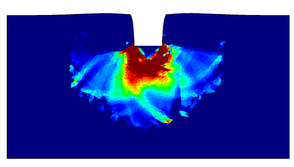
|
| (a) | (b) |
| Figure 50: Strip footing on undrained soil layer. Magnitude of the Plastic deviatoric incremental strain at for case = 500, (a), and = 16, (b). | |
![Influence of analysis type on bearing capacity factor at z/B = 1. MPM: [22], Small Strain FEM: [128], EALE: [14], RITSS: [130], ALE: [131] and Limit analysis: [127].](/wd/images/thumb/8/8a/Draft_Content_325409517-monograph-FigureFooting6.png/420px-Draft_Content_325409517-monograph-FigureFooting6.png)
|
| Figure 51: Influence of analysis type on bearing capacity factor at . MPM: [22], Small Strain FEM: [128], EALE: [14], RITSS: [130], ALE: [131] and Limit analysis: [127]. |
In soils with low rigidity index, the first loading steps are dominated by elastic loading. For example, in the case of a rigidity index of 16, the first plastic gauss point appears at a normalized penetration depth of z/B = 0.05 and the failure surface does not reach the ground surface at the end of the computation (Figure 50(a)). On the other hand, with a rigidity index of 500, the first plastic gauss point appears at a z/B = 0.001 (that is, at the first computational step), and the failure mechanism reaches the ground surface at z/B = 0.014; this point corresponds to the drastic change of slope of the penetration curve (Figure 49(a)). The small effect of rigidity on the bearing capacity factor for the large strain analyses is more clearly illustrated in Figure 51.
Figure 49(b) shows the result of a similar parametric analysis conducted by [22] using a MPM method. The results obtained are remarkably similar (Figure 51). Because the methods are quite different it is difficult to compare performance through indicators. [22] obtained those results using a model with 60.000 grid cells, requiring 46 h of machine time (3.4 GHz single core). The PFEM simulations presented in Figure 49(a) required between 0.5 and 3.5 h of machine time (1.8 GHz x 4).
In Figure 49 and Figure 51 are also plotted the values obtained by [127] using sequential limit analysis, for a rigid-plastic material. Although they describe the formulation used as an upper bound the penetration curve lies below the large deformation ones once these enter the plastic regime. Interestingly, the small-strain wished-in-place analyses presented by [128] lie between the rigid-plastic and large strain results.
Finally, for completeness, Figure 49(c) presents results for the same problem using other ALE-based methods -RITSS [129,130] and CEL [131]. The RITSS computations show good coincidence with the results of the small-strain wished-in-place results of [128]. That coincidence is somewhat perplexing, since small strain analyses cannot represent the effect of the small, but noticeable, surface heave that accompanies footing penetration (Figure 48). The CEL computation stops earlier and shows almost no increase after a penetration of ; this behavior may be due to the relatively small soil domain considered (only , assuming symmetry), far smaller than the extension of the active plastic zone encountered using PFEM (Figure 50).
6.3 T-bar
In this example, the displacement of an embedded T-bar is studied assuming plane strain. The penetrometer is placed in the middle of a square domain of 20 times the T-bar diameter (Figure 52). The horizontal displacement is restricted in the vertical boundaries and the bottom boundary is fixed. At the beginning of the simulation, the soil is undisturbed; a vertical stress of 100 kPa is applied to the upper boundary to ensure the contact between the whole penetrometer and the soil throughout the simulation. is 0.95. The soil is weightless and characterized by undrained strength = 10 kPa, a Poisson's coefficient equal to 0.49 and a shear modulus of 1000 kPa (hence ).
Interface tangential slip follows a von Mises yield criterion (i.e. ). The maximum shear strength admissible between the soil and rigid body interface is a fraction of the undrained shear strength of the soil. A parametric analysis is then performed on the effect of interface roughness.
In this problem the contact nodal density (i.e. the number of nodes in contact with the rigid structure) plays a significant role in the accuracy of the solution. A characteristic length, , is defined so that a new node is inserted midway between two contacting nodes if the distance between them is larger than . Coarsening i.e. contact node removal takes place when the distance between two adjacent contact nodes is smaller than , where is the coarsening parameter.
Figure 53 shows the normalized penetration vs resistance curves for the simulations of the embedded T-bar. For this analysis, the main result of interest is the resistance factor, , defined as the total vertical force acting on the T-bar divided by the projected area, plotted against normalized penetration. The curves are punctuated by periodic drops. These correspond to interface remeshing events. As indicated in Table 8 the variability induced by this numerical noise on the capacity estimate is small, with coefficient of variation (Standard Deviation /Mean) below 1% For all of these analyses the characteristic length value was fixed at , where is the T-bar radius; as a result the number of nodes in contact with the bar varied between 22 and 55 nodes. The initial overall node number is the same for all cases (1175) and does not change very much during simulation.
| Refinement | Roughness Factor, | Characteristic lenght, | Interface nodes (Nmin-Nmax) | Final number of nodes | Final number of elements | |||
| Mean | STD | UB Einav and Randolph (2005) | ||||||
| Reference | 0 | 9.71 | 0.083 | 9.20 | 0.28 | 22-55 | 1040 | 1923 |
| Reference | 0.25 | 10.48 | 0.065 | 10.09 | Idem | 22-55 | 1191 | 2221 |
| Reference | 0.5 | 11.16 | 0.617 | 10.83 | Idem | 22-55 | 1302 | 2501 |
| Reference | 0.75 | 11.71 | 0.062 | 11.46 | Idem | 22-55 | 1080 | 2656 |
| Reference | 1 | 12.14 | 0.048 | 11.94 | Idem | 22-55 | 1259 | 2418 |
| Intense | 0 | 9.45 | 0.029 | 9.20 | 0.12 | 50-125 | 2215 | 4087 |
| Reduced | 0 | 9.77 | 0.105 | 9.20 | 0.34 | 18-46 | 704 | 1257 |
The dependence of on interface roughness that is obtained from these simulations is plotted in Figure 54, where it is compared with previous upper bound results [108] as well as with small strain (Updated Lagrangian) FE solutions [132] and RITSS results [133]. The results obtained with G-PFEM are slightly above (between 1.2% and 5.5%) the plasticity upper bound solution, with a smaller discrepancy for larger interface roughness values.
These observed discrepancies are mostly a byproduct of the relatively coarse mesh employed in the simulations. A numerical exercise was performed to prove this: two more cases were run at 0 interface roughness in which the only change was in the interface characteristic length, . In one case and contact refinement was more intense than in the reference case, whereas in other and contact refinement was reduced.
The results of this exercise are presented in Figure 55(b). A more intense discretization of the interface contact has direct impact on the factor, which becomes closer to the UB limit as the refinement proceeds (Figure 55(a)). The trend of the G-PFEM simulations, in this respect, is aligned with a previous RITSS result [133]. It does also have a direct impact on the smoothness of the numerical solution (Figure 55(b)), which increases with contact refinement. Finally (Figure 56) it does also allow more precise definition of the full flow mechanism [132].
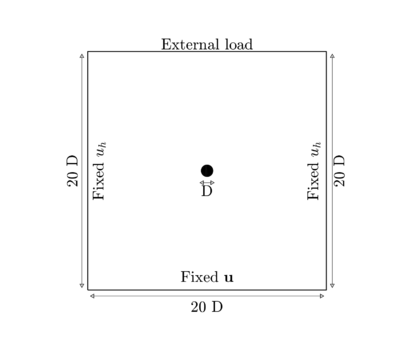
|
| Figure 52: Problem definition: a T-bar inserted in an undrained soil layer. |
![Effect of contact roughness on normalized penetration curves for the T-Bar. Thin black lines: upper bound-strain path solution of [108].](/wd/images/thumb/1/17/Draft_Content_325409517-monograph-FigureTbarPenetration.png/390px-Draft_Content_325409517-monograph-FigureTbarPenetration.png)
|
| Figure 53: Effect of contact roughness on normalized penetration curves for the T-Bar. Thin black lines: upper bound-strain path solution of [108]. |
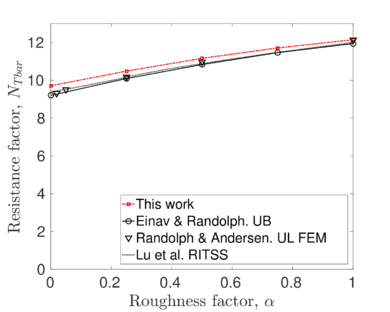
|
| Figure 54: Dependence of factor on surface roughness for the G-PFEM simulations and previous literature results. |
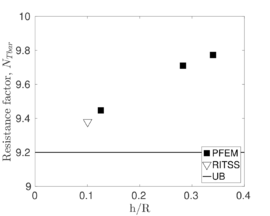
|
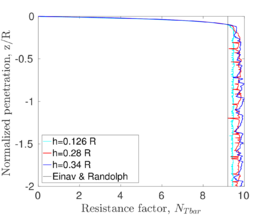
|
| (a) | (b) |
| Figure 55: Effect of characteristic nodal refinement length (h) on the embedded T-bar simulation (a) on the factor (b) on the penetration curve. | |
6.4 Cone Penetration Test (CPT)
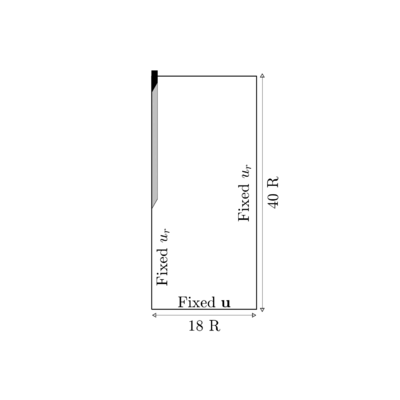
|
| Figure 57: Problem definition: Cone Penetration Test. Outlined in black is the initial position and in gray the final one. |
In this section, the proposed numerical technique is applied to an axisymmetric case: the cone penetration test (Figure 57). A CPT with standard dimensions (D = 35.7 mm; apex angle 60) is pushed 25 radii into a weightless Tresca material. In order to bypass the numerical problems that arise at the first steps of the calculation, when only a node of the soil is in contact with the rigid structure, the cone tip starts from a prebored situation, at a depth of 2.8 radii.
No initial stress is imposed in the soil domain, hence the initial stress state is isotropic. Identical constitutive parameters to those in the previous example are used ( kPa; ; ). These conditions also allow comparisons with previously reported work on the same problem. Both the cone tip and the whole shaft are rough. A parametric study is carried out on the effect of interface roughness.
The relevant bearing capacity factor in this case is given by the cone factor . Cone tip resistance, , is computed adding vertical forces from nodes at the cone tip. Vertical forces are also integrated on a shaft length 7.5 radius behind the cone tip to evaluate sleeve friction.
Figure 58 shows the evolution of cone factor and sleeve friction vs normalized depth for different adhesions (ranging from 0 to 0.7 ). All the cone factor curves seem to reach a steady state at around 20 penetration radii. It is worth noting that all the differences appear within the first penetration radius; afterwards all the curves seem parallel. As expected, the resistance in the friction sleeve is equal to the imposed adhesion.
| Reference | Method | Failure criteria | |
| [134] | Strain path method +FE | 9.4 | Mises |
| [16] | ALE | 9.5 | Mises |
| [19] | CEL | 11.1 | Mises |
| [19] | EALE | 10.2 | Mises |
| [19] | RITSS | 9.8 | Mises |
| [135] | ALE | 11 | Tresca |
| [10] | RITSS | 10.77 | Tresca |
| [136] | MPM | 10.2 | Tresca |
| This work | PFEM | 10.26 | Tresca |
There has been much previous work on this problem [134,135,10,136]; which has been also used for benchmarking purposes [19]. In general, tip resistance depends on cone roughness, on initial stress anisotropy and on the rigidity factor. For the isotropically stressed, smooth, , case Table 9 compiles previously reported cone factors, which show some variation. Some of the differences reported can be attributed to the different yield envelope used: many computations employ a Mises envelope, a shape less realistic for soils but more computationally-friendly than the Tresca model. When using the same method, computations using a Mises strength envelope result on smaller cone factors by about 10% (something similar had been observed for the T-bar problem by [133]). The value obtained using G-PFEM is well within the range obtained in other computations using a Tresca model.
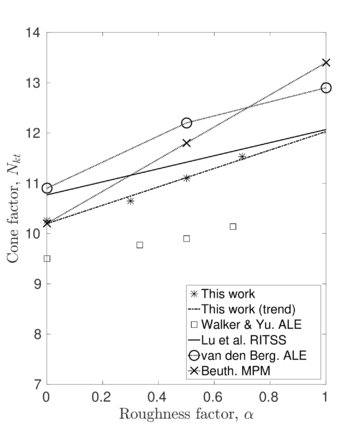
|
| Figure 59: Influence of contact roughness on cone factor |
| Figure 60: Mean stress field (kPa) and mesh for the case at the initial and final stages of the computation. |
| Roughness Factor | Initial number of nodes | Initial number of elements | Final number of nodes | Final number of elements | Cone Factor | Friction Ratio | [10] RITSS | |||
| Mean | STD | Mean (%) | STD | |||||||
| CPT0 | 0 | 1360 | 2485 | 2501 | 4650 | 10.26 | 0.1792 | 10.77 | ||
| CPT3 | 0.3 | 1360 | 2485 | 2526 | 4696 | 10.64 | 0.1171 | 2.45 | 11.16 | |
| CTP5 | 0.5 | 1360 | 2485 | 2595 | 4823 | 11.11 | 0.1227 | 4.50 | 11.42 | |
| CPT7 | 0.7 | 1360 | 2485 | 2407 | 4476 | 11.53 | 0.1212 | 6.07 | 11.68 | |
As roughness increases, the cone factor at steady state increases almost linearly. The gradient of the variation of the cone factor as the roughness increases is 1.8; this value is within the range of previous analyses (see Figure 59). A detailed analysis of the numerical reasons for the observed variation in this slope is beyond the scope of this work.
The initial mesh employed in the CPT analysis is illustrated in Figure 60. The characteristic length, was again , now being the radius of the cone. Because the contact surface was longer, the model was more demanding in terms of mesh refinement that that of the T-bar and by the end of the computation the number of elements had roughly doubled (Figure 60(b) and Table 10). The finer mesh used here results in a very small numerical oscillation, with coefficient of variations for the cone factor of around 1% and even smaller for sleeve friction.
Although the mesh used is relatively fine, the computational load remains moderate. The initial mesh is composed by 1360 nodes and 2485 elements whereas the coarser final mesh has 2595 nodes and 4823 elements (Table 10). For reference, [19] used 5000 quadratic elements in their EALE mesh, whereas [136] used more than 20.000 elements and one order of magnitude more material points (a 20 slice of the axisymmetric problem was simulated in 3D).
6.5 Concluding remarks
The method performance has been illustrated by means of several numerical examples using a total stress approach. In the first one, the penetration of a rigid strip footing, it has been shown that stabilized formulations alleviate the severe volumetric locking that suffer low order elements; in addition, the effects of rigidity index on the penetration response appear to be well captured. In the T-bar and CPT examples the contact algorithm comes into play. The degree of interface refinement has an important effect on the precision of the numerical solution. Interface refinement is easy to control and adapt to the requirements of the specific problem being analyzed. Despite using relatively coarse meshes, the results obtained agree well with previous analyses using other methods.
It appears that the numerical strategy followed by PFEM, using adaptive low-order discretization of the domain, obtains similar results than those attained with alternative numerical methods with significant savings in computational effort.
7 Analysis of sampling in clay soils
The most commonly used sampling method is tube sampling. During the process -that encompasses boring, sampling, storage, extrusion and the early stages of testing- the sample may suffer significant disturbance and the soil may no longer be representative of the in situ state [137,138,139]. The adverse effect of the sampling process on clay parameters (amongst them, the undrained shear strength, elastic modulus, initial effective stress and the axial strain at peak deviatoric stress) has been characterized by experimental programs (for instance, by [140]).
This chapter describes a series of simulations of the tube sampling process in clay materials using a total stress approach. After a brief literature review, a parametric analysis of the problem, in which several sampler geometries, constitutive parameters and interface behaviors are analyzed. Afterwards, the occurrence of a plug is assessed in terms of the theory proposed [1]. Finally, some conclusions are drawn.
Additional results steaming from the simulations reported in this chapter -the bearing capacity factors of tubes- are presented in Appendix D, that also includes the analysis of closed-ended piles.
7.1 Literature review
This section presents a literature review of sampling in clay soils. First, the main geometrical descriptors of samplers are briefly described. Secondly, traditional methods to infer the quality of the sample are discussed; namely, the centerline strain path and the magnitude of recovery. Finally, the theory of [1] to predict the occurrence of a plug in open-ended piles and tubes is highlighted.
7.1.1 Geometrical description of soil samplers
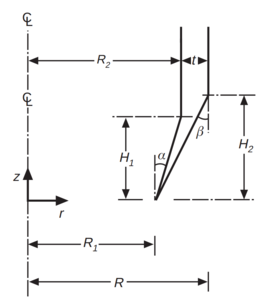
|
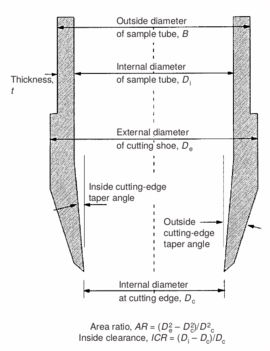
|
| (a) | (b) |
| Figure 61: Geometrical descriptors of soil samplers. [139], (a), [141], (b). | |
Hvorslev [137] evidenced that the deformations that suffer the soil that enters the sampler depend on the sampler geometry, the pushing method and the material. [137] proposed several dimensionless descriptors to characterize the geometry of tubes (see Figure 61): (i) the area ratio, the ratio between the projected cutting shoe area to the internal area, (ii) the inside clearance ratio, that measures the relative increase of the diameter inside of the tube, and (iii) the outside clearance ratio, that accounts for the difference between the external diameter of the cutting shoe and the outside diameter of the sample tube. For simpler sampler geometries (round-tipped samplers with null inside and outside clearance angles), Baligh et al. [138] proposed to work in terms of the ratio between the outer diameter to the wall thickness, , rather than the area ratio. Samplers are also characterized by the angles of the cutting shoe; particularly, the inside and outside cutting edge angles, and in Figure 61(a).
It is generally accepted that sample disturbance decreases with smaller cutting area ratios and with sharper cutting edges [141,142,143]. Meanwhile, a null internal clearance ratio has been traditionally associated to large disturbance of the sample due to the high frictional forces that develop in the internal shaft and, also, the formation of a plug [137]. Non-zero internal clearance ratios may induce lateral expansion of the sample. This effect seems undesirable; however, it might significantly reduce the frictional forces that develop in the interior interface and, thus, reducing the susceptibility of the formation of a plug [143,144].
7.1.2 Magnitude of recovery as a sampling disturbance measure
![Physical descriptors to characterize the recovery of the sample. [137]](/wd/images/thumb/7/7e/Draft_Content_325409517-monograph-Hvorslev.png/552px-Draft_Content_325409517-monograph-Hvorslev.png)
|
| Figure 62: Physical descriptors to characterize the recovery of the sample. [137] |
Hvorslev [137] proposed several physical descriptors based on sample recovery to characterize the soil disturbance. These metrics are presented in Figure 62; the total recovery ratio is defined as the length of recovered sample divided by the length of the tube whereas the specific recovery ratio is its continuous counterpart: how much soil enters the sampler per advance of the sampler.
Hvorslev [137] stated that an undisturbed sample should have an specific recovery ratio similar to the unity. However, a total recovery ratio of 1 may be caused due to an expansion of part of the sample and contraction in the others; as such, the total recovery ratio might not be a good indicator for disturbance.
Although the specific recovery ratio delivers important information on the process; it is not used in the current practice due to the difficulty of its measurement.
7.1.3 Strain history as a sampling disturbance measure
Strain Path Method
![Deviatoric strain contours during undrained simple sampler penetration (B/t=40): radial strain, (a), circumferential strain, (b), deviatoric strain ϵrz, (c), and vertical strain, (d), considering compression positive. [138].](/wd/images/thumb/1/1f/Draft_Content_325409517-monograph-BalighStrainContour.png/360px-Draft_Content_325409517-monograph-BalighStrainContour.png)
|
| Figure 63: Deviatoric strain contours during undrained simple sampler penetration (): radial strain, (a), circumferential strain, (b), deviatoric strain , (c), and vertical strain, (d), considering compression positive. [138]. |
Baligh [145] proposed the Strain Path Method (SPM) to study the strain response caused by the undrained, steady and deep penetration of rigid objects into clay materials. The main hypothesis of the method is that, due to the severe kinematic constraints that exist in this type of problems, the soil deformations and strains are independent of the shearing characteristics of the soil. The penetration problem may be idealized as that of an incompressible material that flows around the rigid, penetrating object. The stresses may be obtained from the strain paths through a constitutive model. Importantly, due to the hypotheses of the method, the contact between the soil and the structure is considered smooth [141].
Baligh et al. [138] applied the strain path method to evaluate the strain path due to the sampling process. In the referred work, the strains due to the penetration of simple samplers -samplers with a curved tip characterized by the ratio between the outer diameter to wall thickness - are reported.
The examination of these strain contours reveals that there exist two different regions in the soil located inside the sampler: in the outer half inside of the tube, the strains of the soil are significant and non-uniform, leading to significant disturbance; whereas in the inner half inside of the tube soil suffer the least disturbance and strains are low and uniform, see Figure 63. Additionally, in the inner half of the sample, the vertical component of the strain is dominant, the radial and circumferential components are approximately equal and the tangential component is zero; that is:
|
|
(7.1) |
As a result of the deformation process, reasonable estimates of soil disturbances in the inner part of the tube can be estimated based on the strains at the sample centerline [138].
![Centerline vertical strain path for a simple sampler for different aspects ratios, B/t. [138].](/wd/images/thumb/b/b7/Draft_Content_325409517-monograph-BalighCenterLineStrain.png/360px-Draft_Content_325409517-monograph-BalighCenterLineStrain.png)
|
| Figure 64: Centerline vertical strain path for a simple sampler for different aspects ratios, . [138]. |
The straining history at the centerline is depicted in Figure 64. As noted before, Equation 7.1, soil elements located at the centerline of the sampler are subjected to triaxial shearing. Three different straining phases of undrained triaxial shearing may be identified in Figure 64 [138]:
- An initial compression phase ahead of the sampler where the axial strain increases from zero to a maximum value.
- A second phase, in the vicinity of the cutting edge, where the axial strain rapidly decreases from the maximum value to the minimum value.
- Finally, the vertical strain increases from the minimum value and tends to zero.
The minimum and maximum value of the vertical strain are equal in absolute value and is given by ; the value of the maximum and minimum vertical strain is inversely proportional to the aspect ratio (the ratio between the outer diameter to the wall thickness). Additionally, the normalized location of these extremes is , which is independent of other problem parameters. The vertical strain along the centerline of the sampler may be approximated by [138]:
|
|
(7.2) |
A more detailed parametric analysis assessing the influence of the area ratio, cutting-edge angles and inside clearance was performed by [139] by means of a Strain Path method implemented via a finite element approach. In particular, the authors analyzed the effect of the area ratio, the cutting-edge angle and inside clearance on the sample disturbance, evaluated on the basis of the strains imposed on the center-line of the soil sample.
Shallow Strain Path Method
Sagaseta et al. [146] developed an extension of the Strain Path method, the Shallow Strain Path method (SSPM), to explicitly include the effects of the stress free ground surface. The authors concluded that shallow penetrations cause a heave at the ground surface, while settlements only occur in the region around the tip and in a thin region of material adjacent to the shaft of the penetrometer. At large penetrations, settlements only occur at all points below the tip of the tube.
![Evolution of the vertical strain at the centerline for several initial depths. B/t = 41. [146].](/wd/images/thumb/a/ab/Draft_Content_325409517-monograph-Sagaseta_CSL.png/360px-Draft_Content_325409517-monograph-Sagaseta_CSL.png)
|
| Figure 65: Evolution of the vertical strain at the centerline for several initial depths. . [146]. |
Due to the complexity of the method, it is very difficult to derive the centerline strain paths from scratch. However, the referred work include the evolution of the vertical strains at several depths of the centerline during the penetration of a tube whose aspect ratio is . Figure 66 presents these results analyzed in terms of Centerline Strain Path; for comparison purposes the curve developed by [138] is also depicted. The first thing to notice is that soil elements that initially are located at deep positions ( below the initial position of the cutting-shoe) do not suffer compression strains as the tube tip advances; once the tube is located at above the soil element, vertical compression strains increase. Meanwhile, soil elements located at shallowest positions first suffer some compression strains as the tube advances, that reverse to extension strains in the vicinity of the tube (in some cases above or below); once the soil element is inside of the tube and at some distance of the cutting shoe, these extension strains decrease.
For this particular example, the peak extension strain obtained by the SSPM more than doubles the one predicted by the SPM (although, using different boundary conditions). On the contrary, the compression strains of the SSPM are almost one half of those of the SPM. By using the SPM, extension strains are predicted inside of the tube whereas compression strains only occur below the cutting shoe; a different behavior is predicted by the SSPM.
![Specific recovery ratio for a simple sampler for different aspects ratios, B/t, using the Shallow Strain Path Method [146].](/wd/images/thumb/4/42/Draft_Content_325409517-monograph-Sagaseta_SRR.png/360px-Draft_Content_325409517-monograph-Sagaseta_SRR.png)
|
| Figure 66: Specific recovery ratio for a simple sampler for different aspects ratios, , using the Shallow Strain Path Method [146]. |
The authors include a closed-form solution of the the vertical displacement field of a point located at the surface, just in the center (r=0, z=0):
|
|
(7.3) |
where , and is the penetration depth.
Assuming that the displacement of this point is representative of the vertical displacements of the inner free surface (the vertical displacement is not constant inside of the tube and may vary up to a factor of 1.7 for very thin tubes, see Figure 12 of [146]), the specific recovery ratio may be computed for different wall thicknesses. Figure 66 presents this curves in terms of the aspect ratio of the sampler. The peak recovery takes place at very shallow penetrations, , and the maximum value decreases with the aspect ratio, . Once the peak value is attained, the specific recovery ratio decreases until it reaches a steady state of 100%
Finite element simulations
Very limited numerical work has been performed on the sampling process. The origins of these simulations may be traced back to [147], that used the finite element method. The authors employ a viscoplastic flow approach: assuming that the elastic strains are negligible, the deformation process is comparable to that of a viscous fluid of non Newtonian kind; the viscosity is considered non-linear and depends on the assumed constitutive model for the soil. Nonetheless, [148] claimed that the discretization used by [147] was too coarse to provide sufficient accuracy: the finite element mesh consisted only of 50 quadrilateral elements.
Budhu and Wu [148] performed a set of hydro-mechanical simulations of the sampling on normally consolidated Modified Cam Clay soil. The authors analyzed the effect of the penetration rate, sampler-soil interface friction and thickness of the tube; although the amount of disturbance varied due to these factors, in all the cases disturbance concentrated near the soil-sampler interface and at the top of the sample. Additionally, sampling disturbance due to friction at the soil-sampler interface increase as the sampler penetrates the soil: as such, long samples may result be seriously degraded. It is worth noting that the penetration of the sampler is simulated by splitting a group of nodes ahead of the penetration route up to a sufficient depth and applying incremental displacements to match the geometric configuration of the sampling tube; the accuracy of this approach is not demonstrated. In all the cases, the obtained vertical strains in the centerline are in the same order of magnitude of those obtained by [138]. A typical finite element mesh consists of 400 quadrilateral elements.
Physical modeling
In terms of physical evidences, Hover et al. [149] and Hover [150] developed a small-scale physical modelling system to investigate the effect of tube sampling. The authors used an artificial, transparent soil with embedded seeding particles. The process of the penetration of a glass sampler was recorded with digital photographies, that were analyzed by Particle Image Velocimetry (PIV).
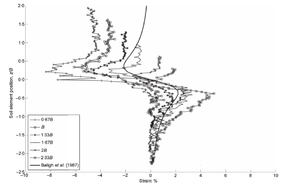
|
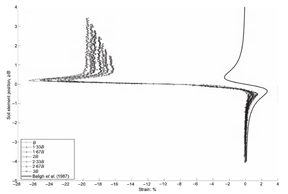
|
| (a) | (b) |
| Figure 67: Vertical strain history at the centreline of the sample without a pressure plane, (a), and with a pressure plane, (b). Curves are labeled in terms of the initial depth of the soil element. [149] | |
| Depth = | Depth = | ||||||
| Peak compressive strain (%) | Peak extensive strain (%) | Residual strain (%) | Peak compressive strain (%) | Peak extensive strain (%) | Residual strain (%) | ||
| Test 1 | 17.6 | 1.0 | -6.0 | -3.4 | 5.0 | * | * |
| [138] | 17.6 | 2.4 | -2.4 | 0 | 2.4 | -2.4 | 0 |
| Test 2 | 14.5 | 0.1 | -26.5 | -19.5 | 1.1 | -21.7 | -16.5 |
| [138] | 14.5 | 2.6 | -2.6 | 0 | 2.6 | -2.6 | 0 |
Hover et al. [149] present the results of two different tests with a round tipped, thick penetrometer. Altough the diameter and thickness of the samplers used in each test is different (one has an aspect ratio of and the other is 17.6), the main difference between the two tests is that in one of them a pressure plate with a hole to let the tube pass through was placed on top of the soil with a pressure of 50 kPa whereas on the other no pressure plate was considered. Both samples where first prepared and consolidated with an external load of 50 kPa.
The results of these two tests are shown in Figure 67, that depicts the vertical strain history of soil elements located at the centerline of the sampler; curves are labeled in terms of the initial depth of the soil element. The first thing to note is that the presence of the pressure plate plays a prominent role: as shown in Table A, using a pressure plate a peak extensive strain of is observed whereas without the pressure plate the maximum extensive strain is after the sampler has penetrated one diameter. Nonetheless, these values are much higher than those predicted by the Strain Path Method [138,139].
From these two tests additional conclusions may be drawn: the three different stages of straining obtained by [138] are identified, however centerline strain path is not anti-symmetrical and the peak compression and extension strains are different. After the sampler has passed a soil element, some residual extensions strains remain.
Although the results are compared to the solution obtained through the Strain Path Method (SPM) by [138], some of the basic hypothesis are not fulfilled: (i) the glass-transparent soil interface has a similar interface friction angle than that of the clay-steel [150] and, in contrast to SPM, is different from zero and (ii) due to the relatively slow driving speed, some drainage occurred; the estimated volume loss during the whole test was around compared to the internal volume of the tube [149].
Results using different geometries of the cutting edge and thickness of the wall are presented in [150]. In the referred work, almost all the tests are performed with the pressure plate.
7.1.4 Occurrence of a plug
During the installation of open-pipe piles or during tube sampling processes, soil enters the tube until the inner-soil cylinder develops sufficient resistance to prevent further soil intrusion and the structure becomes plugged; then the structure assumes the penetration characteristics of a closed-ended pile [1]. The occurrence of a plug has been generally linked to the shaft inner friction and, in the case of soil samplers, to very high levels of disturbance in the soil inside of the tube [141].
Paikowsky and Whitman [1] proposed a quite simple method to estimate the susceptibility of the formation of a soil plug in open ended piles, that is based on the pile capacity. The authors state that a plug is formed when the static capacity of the open-ended pile is equal to that of a closed-ended pile; in other words, the plug of an open-ended pile is mobilized when the accumulated inside skin friction exceeds the ultimate static bearing capacity of the soil below the toe of the pile. Consequently, in these conditions, the pile behaves as though it is closed ended.
In the referred work and specifically for clays, the authors propose to approximate all the forces (end resistance of open and closed ended piles, skin resistance, tip resistance, ...) to cone penetration results (cone resistance and sleeve friction resistance) and link them to the undrained shear strength () through classical CPT interpretation techniques (cavity expansion).
7.2 Details of the simulation program
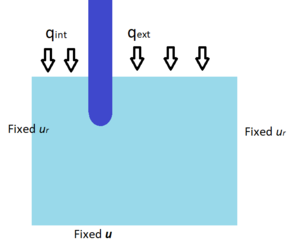
|
| Figure 68: Sketch of the geometry employed in the numerical simulations. |
Figure 68 presents an sketch of the geometrical model used in the numerical simulations. Due to symmetry of the problem, an axisymmetric model is employed. To bypass the numerical problems that arise during the first steps of the calculation, when only a node of the soil is in contact with the rigid structure, the sampler starts from a prebored situation. Displacements are fixed in both directions in the lower boundary of the domain, whereas null radial displacement is imposed in the two vertical boundaries. Load boundary conditions are imposed on the top free-surfaces and the inner load is different from the outer one.
The sampling process occurs at relatively high velocity compared with the hydraulic properties of clays; as such, it is modeled with a total stress approach. The material is assumed to satisfy a Tresca yield criterion and the elastic model is linear between the Kirchhoff stress and the elastic Hencky strain. A Poisson's ratio of is used. Therefore, techniques to alleviate volumetric locking are required: in this chapter, elements are used.
As customary in total stress analyses, the tangential behavior of the interface follows a von Mises yield criterion:
|
|
(7.4) |
where is the contact tangential stress and is the so-called adhesion or roughness factor. The maximum shear stress admissible between the soil and rigid body interface is a fraction of the undrained shear strength of the soil.
7.3 Thick, round tipped sampler
In this section, the analysis of thick, rounded tipped samplers with a ratio equal to 10 is presented. The first section covers the reference case, where a smooth interface behavior is assumed and the self weight is obviated. Then, the following three sections report the results of the parametric analysis. The first one is devoted to analyze the effect of the external loads (difference between internal and external load), the initial stress state (considering different initial anisotropic stress states or initial mean stress) and the rigidity index. As it will be shown, in all these cases the same failure mechanism than the reference case prevails and only the specific recovery ratio is presented; although the deformation path obtained in all these simulations is very similar, in some cases the stress state slightly varies. The following two parametric analyses assess the effect of the soil self-weight and the soil-structure interface behavior; since a different deformation path is obtained, a more detailed examination of the results is presented.
7.3.1 Reference case

|

|

|

|
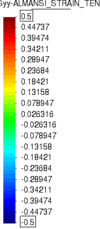
|
| (a) | (b) | (c) | (d) | (e) |
| Figure 69: Thick, round tipped sampler. Reference case. Vertical component of the Almansi strain tensor at several normalized penetrations. | ||||
For the reference case, a rigidity index, , equal to 100 is considered; the contact interface is smooth and the inner and outer boundary loads are equal to 200 kPa. At the initial state, the soil is characterized by kPa and ; the self weight of the soil is not considered.

|

|

|

|

|
| (a) | (b) | (c) | (d) | (e) |
| Figure 70: Thick, round tipped sampler. Reference case. Magnitude of the normalized velocity. | ||||

|

|

|

|
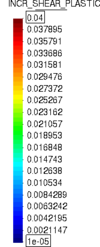
|
| (a) | (b) | (c) | (d) | (e) |
| Figure 71: Thick, round tipped sampler. Reference case. Incremental plastic shear strain. | ||||
Figure 69 depicts the vertical component of the Almansi strain tensor, an spatial strain measure defined in Equation 2.25. As noted by its definition, the interpretation of the Almansi strain tensor is not straightforward. However one thing is clear: all the material that enters to the sampler suffers from very high extensions vertical strains. High compression vertical strains are found in just below the cutting-shoe of the sampler. Differently from the results obtained through the Strain Path Method by [138] (see Figure 63), strains appear uniform inside the tube. Low strains are found in the rest of the soil mass.
To further investigate the failure mechanism, Figure 70 depicts the magnitude of the normalized velocity -that is, the incremental displacement vector divided by the time-step and normalized with the soil sampler velocity- whereas Figure 71 presents the incremental plastic shear strain. From these two figures it can be interpreted that the failure mechanism is as follows: soil elements located just beneath the tube sampler suffer extension plastic vertical strains and compression strains in the radial and circumferential directions; once the soil element is inside the tube sampler the soil remains in elastic regime. All the plastic deformation occurs in the area of the cutting shoe of the sampler; the soil mass outside of the sampler remains in elastic regime during all the problem.
Inside of the soil sampler, some regions have a very small plastic deformation (see Figure 71) and, thus, are not in elastic regime; it is believed that this small plastic regions appear due to numerical reasons: stresses may oscillate due to the remeshing processes and also because the employed contact formulation due not fulfill the contact patch-test in axisymmetric cases.
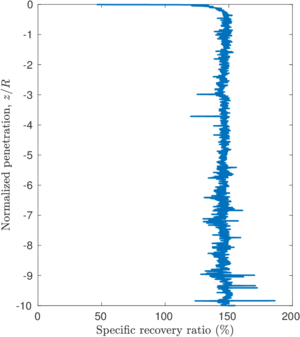
|
| Figure 72: Thick, round tipped sampler. Reference case. Specific recovery ratio in terms of the normalized penetration. |
Figure 72 depicts the evolution of the specific recovery ratio in terms of the normalized penetration. The specific recovery ratio remains constant during the whole penetration and has a value in the order of 146% Although this value seems very large, it is totally plausible from a physical point of view. Assuming that the previously described failure mechanism is correct (i.e. all the soil below the sampler is squeezed inside and deformation takes place just below the sampler cutting edge), an infinitesimal volume of soil below the sampler is where is the soil height whereas stands for the outer radium of the sampler; once this control soil mass enters the sampler its volume is where is the deformed soil height whereas stands for the sampler inner radium. Since the material is quasi-incompressible, the reference volume must be (almost) equal to the deformed one: . Thus, assuming the failure mechanism described below, the recovery ratio is equivalent to the vertical deformation () and may be obtained as:
|
|
(7.5) |
that, for the case of the aspect ratio , an specific recovery ratio of % is obtained; this value is in the same order of the one obtained in the numerical results.
The obtained recovery ratio, Figure 72, does not show any similitude with that obtained from the Shallow Strain Path Method [146], that has been presented in Figure 66. The one predicted by the SSPM predicts a peak recovery (in the order of 108%) at a very shallow penetration and then a monotonically decrease of the recovery to 100% at a penetrations in the order of . On the contrary, the one obtained here is constant during all the simulation and in the order of 146%
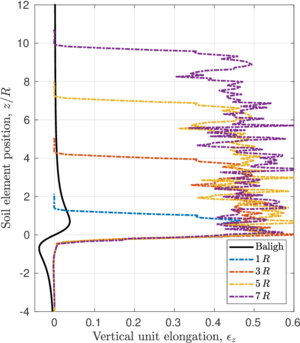
|
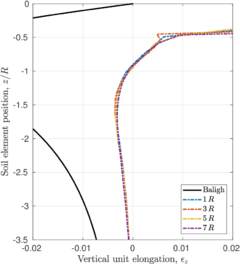
|
| (a) | (b) |
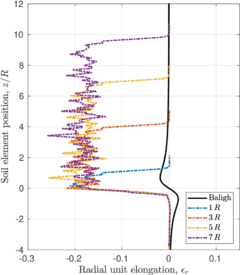
|
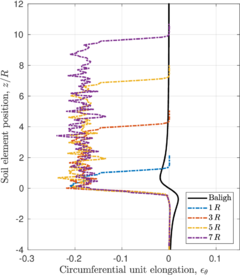
|
| (c) | (d) |
| Figure 73: Thick, round tipped sampler. Reference case. Centerline straining path: vertical unit elongation, (a) and (b), radial unit elongation, (c), and circumferential unit elongation, (d). Reference solution by [138]. Curves are labeled in terms of the normalized penetration. | |
To ease the interpretation of the centerline strain histories, the unit elongation is used as strain measure. As described in Equation 2.27, the unit elongation along a spatial direction is defined as:
|
|
(7.6) |
where and is the infinitessimal length of a vector along direction in the deformed and reference configuration. This strain measure may be further linked to the Almansi strain tensor, see Equation 2.28. It is worth noting that in the infinitesimal regime, the unit elongation is linked to the small strains deformation tensor, , through: .
Figure 73 depicts the vertical centerline strain path; curves are labeled by the amount of penetration of the sampler. For comparison purposes, the curve developed by [138] is also depicted in the figure. It is evindent that the proposed curve does not agree with the numerical simulation: the predicted strains are an order of magnitude larger than those of the Strain Path Method. In fact, even the shape of the curve is different: minimal compression strains are found in the simulation, whereas [138] predict vertical compressions below the tube. It is worth noting that the results obtained by [138] suggest that the deformation inside the tube sampler is elastic since it is reversible. In the numerical simulations it has been found that a shear zone is developed beneath the tube sampler and once the soil element enters the tube it behaves almost elastically.
Figure 73 also reports the radial and circumferential centerline strain paths; both elongations are almost coincident. In agreement with [138], it is observed that inside the tube the vertical strain is dominant, the radial and circumferential strains are approximately equal and, thus, triaxial shearing prevails.

|

|

|

|
|
| (a) | (b) | (c) | (d) | (e) |
| Figure 74: Thick, round tipped sampler. Reference case. Vertical component of the Cauchy stress tensor (kPa) at several normalized penetrations. | ||||
The straining history is similar to the one proposed by [138] (reported in Figure 64) and may be summarized as:
- An initial compression phase ahead of the sampler () where the axial strain increase from zero to a maximum value (see Figure 73(b)). In this phase the soil mass behaves elastically.
- A second phase, in the vicinity of the cutting edge, where the soil suffers triaxial extension; first in elastic regime () and then in elasto-plastic regime ()
- Afterwards, plastic strains are dominant and cease to increase.
The maximum vertical unit elongation in extension lays in the range of 48% whereas the maximum in extension is 0.32%
To characterize the stress state, Figure 74 presents the evolution of the Cauchy vertical stress at several steps. A bulb of high stresses is formed just beneath the cutting shoe. Inside of the tube the stress state is similar to the in situ stress; meanwhile higher vertical stresses are found in the zone adjacent to the outer shaft.
A detailed description of all the Cartesian components of the Cauchy stress tensor, stress invariant and also the Almansi strain tensor is presented in Figures 84, 85 and 87, that compares these stress and strain measures for smooth and rough interface behaviors.
It must be pointed out that, for this reference case, a typical Finite Element mesh has the order of 7500 nodes (thus, 22500 degrees of freedom) and 15000 elements. These numbers greatly contrast with the proof of concept of [147] (50 quadrilateral elements) and the work of [148], that employed discretizations of approximately 400 quadrilateral elements. Each simulation has an approximated computational cost of 24 hours.
7.3.2 Parametric analysis. Rigidity index and external loads.
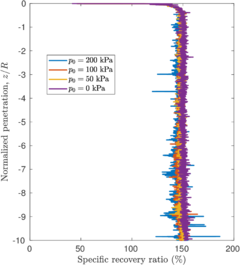
|
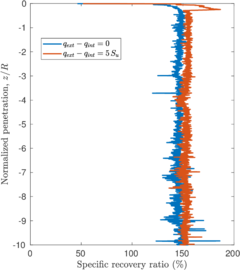
|
| (a) | (b) |
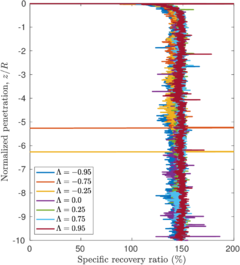
|
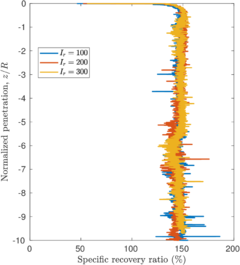
|
| (c) | (d) |
| Figure 75: Thick, round tipped sampler. Evolution of the specific recovery ratio in terms of the normalized penetration. Effect of the external load (), (a), difference between the external and internal load, (b), initial stress anisotropy, (c), and rigidity index, (d). The mean value of the specific recovery ratio during the steady state is detailed in Table 12. | |
| (kPa) | ||||
| 200 | 100 | 0 | 145.5 | |
| 100 | 100 | 0 | 147.5 | |
| 50 | 100 | 0 | 148.5 | |
| 0 | 100 | 0 | 150.71 | |
| 200 | 100 | - | 152.79 | |
| 200 | 100 | -0.95 | 140.46 | |
| 200 | 100 | -0.75 | 138.88 | |
| 200 | 100 | -0.25 | 141.84 | |
| 200 | 100 | 0.25 | 147.75 | |
| 200 | 100 | 0.75 | 147.92 | |
| 200 | 100 | 0.95 | 147.72 | |
| 200 | 200 | 0 | 145.09 | |
| 200 | 300 | 0 | 146.79 |
In the first part of the parametric analysis, the external loads, the initial stress anisotropy and the rigidity index are varied. In all the simulations the soil weight is neglected and the contact interface is assumed smooth; in the following sections the effect of these two factors is presented.
First, Figure 75(a) depicts the specific recovery ratio for several simulations assuming that the external and internal loads are equal and also that the initial total vertical and horizontal stresses are the same (); as such, these curves are labeled in terms the total initial mean stress (). In all the cases the specific recovery ratio is almost coincident. However, it is worth noting that although the failure mechanism is identical to that of the reference case, in the simulation with initial stress-free soil, the upper part of the domain is not in contact with the tube sampler.
Secondly, Figure 75(b) shows the same results with an external load equal to kPa and a lower inner one (). Then, curves are labeled in terms of the difference between the external and internal load (). Remarkable discrepancies appear at the first 0.5 normalized penetration; this behavior is due to the procedure to impose the initial stress: first the inner load is equal to 200 kPa and the soil is assumed to have an initial stress 200 kPa, and the inner external load is continuously decreased up to the desired value (150 kPa) during the penetration of the sampler. As the sampling process proceeds, sensibly larger specific recovery ratios are encountered when the inner load boundary condition is lower than the external one. Higher differences between the inner and outer applied load boundary conditions are not tested since the initial stress configuration may produce the same failure mechanism encountered in the base stability of a circular excavation [151].
To further investigate the effect of the in situ stresses on the sampling process, the in situ stress state parameter is used (as defined in [134] and [16]):
|
|
(7.7) |
The anisotropic in situ stress parameter, , ranges between -1 and 1. All the simulations have the same initial vertical stress (200 kPa), whereas the in situ radial and circumferential stresses are varied. Figure 75(c) shows the low influence of the initial anisotropy of the stresses on the specific recovery ratio. Table 12 reports the mean value of the specific recovery ratio in terms of the anisotropic in situ stress parameter: it can be seen that the recovery slightly increases with this parameter. Indeed, all the cases show the same failure mechanism.
In Figure 75(d), the rigidity index is varied between 100 (reference) to 300. The specific recovery ratio seems independent of this constitutive parameter.
The mean value of the specific recovery ratio during steady state for the cases analyzed herein are presented in Table 12.
The failure mechanism of all the simulations presented in this section is exactly the same than the one encountered in the reference case (see Section 7.3.1). As such, the deformation path is almost coincident. This is not the case of the stress state along the soil domain, where differences in the stresses and stress invariants are noticeable. For example, the maximum vertical stress (that appears just below the cutting shoe) is larger as the rigidity index increases and, additionally, the dimension of the bulb also increases.
7.3.3 Parametric analysis. Soil self weight.
| m | m | m | |
| (kN/m) | (kN/m) | (kN/m) | (kN/m) |
| 0 | 0 | 0 | 0 |
| 1.5 | 20 | 10 | 5 |
| 15 | 200 | 100 | 50 |
| 30 | 400 | 200 | 100 |
| 37.5 | 500 | 250 | 125 |
| 45 | 600 | 300 | 150 |
| 52.5 | 700 | 350 | 175 |
| 60 | 800 | 400 | 200 |
| 75 | 1000 | 500 | 250 |
| 150 | 2000 | 1000 | 500 |
| 375 | 5000 | 2500 | 1250 |
In this section, the previously parametric analysis is enhanced by considering the self-weight of the soil. Several soil densities are considered (see Table 13). Although the undrained shear strength is a consequence, among others, of the in situ effective pressure, its value is assumed constant along all the domain, kPa, in addition to the shear modulus, kPa. In this section, results are reported in terms of the product of the specific weight and the outer diameter, ; using centrifuge scaling laws [152,153], it can be shown that this product is unaffected by the scaling factor. Then, using this rational, the computational results may be interpreted in term of different combinations of outer diameter and soil unit weight. Table 13 reports the specific weight of the computed case ( m) and the corresponding specific weights for other tube diameters.
Figure 76 presents the evolution of the specific recovery ratio. This measure have a highly oscillatory nature, specially for the cases with larger specific weights; as such, three different approaches are employed to present the specific recovery ratio: the raw data, the smoothed data and by fitting a 10th order polynomial to the displacement of the inner free surface and then computing the specific recovery ratio by differentiating this polynomial. As depicted in the figure, specific weight (or density) may have a prominent role in the specific recovery ratio: for large values of the density (i.e., ), the specific recovery ratio monotonically decrease as penetration progresses.
Not all the simulations could be computed until a clear steady state since these simulations are prone to numerical breakdown due to convergence problems. Additionally, it should be noted that most of the employed values of are extremely large and, consequently, unrealistic (see Table 13).
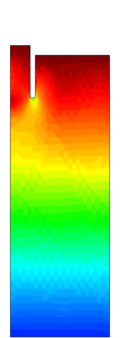
|

|

|
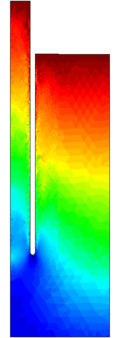
|
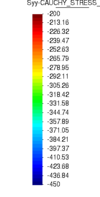
|
| (a) | (b) | (c) | (d) | (e) |
| Figure 78: Thick, round tipped sampler. Effect of the soil self-weight: . Vertical Cauchy stress (kPa) at several normalized penetrations. | ||||
To characterize the solution, Figure 77(top) presents the evolution of the Almansi vertical strain at several simulation times for . As it might be inferred from the specific recovery ratio, at the first stages of the simulation the vertical strain follows the same trend than the reference case: the soil that enters the tube suffer from very high extension strains, large vertical compression strains are observed just beneath the cutting shoe and strains are low in the rest of the soil mass. However, as penetration progresses, the soil mass that enters the tube suffer from lower extension strains (however, these strains are still high), the region of compression strains expands and cover a wider range below the tube and some extension vertical strains are observed in the vicinity of the outside shaft.
The distribution of plastic strains is also affected by the soil self-weight: in the first stages of the simulation the failure mechanism is very similar to the one observed in the reference case, with a very narrow localization zone that squeezes all the soil inside of the tube (Figure 77(bottom)). As penetration progresses it seems that the problem transitions to a different failure mechanism; the previous failure mode still exists but also some plastic strains also affect the outer part of the domain.
Finally, Figure 78 presents contours of the vertical Cauchy stress. Although the gradient of the vertical stress is extravagant for the dimensions of usual soil samplers, one thing is clear: at the same vertical distance from the cutting shoe, the vertical stress is higher in soil at the inner part of the tube than outside; this result contrast with the simulation of the weightless soil, where the vertical stress inside of the tube was lower than outside (see Figure 74). This is a consequence of the relative vertical displacement between the inner and outer free surface, that generates differences in the stress state if the densities different from zero are considered.
7.3.4 Parametric analysis. Contact roughness.
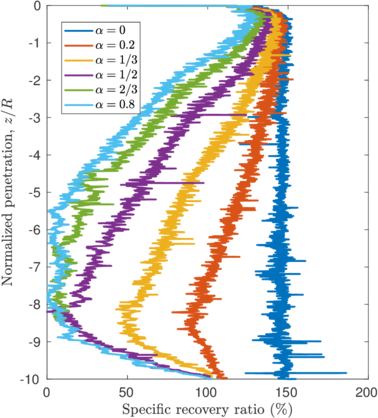
|
| Figure 79: Thick, round tipped sampler. Evolution of the specific recovery ratio in terms of the normalized penetration. Effect of the adhesion or roughness factor. |
In the last part of the parametric analysis of the thick, round-tipped soil sampler, the effect of the adhesion or roughness factor is assessed.
Figure 79 presents the curves of specific recovery ratio in terms of the normalized penetration for several values of the adhesion (ranging from to ). Contrary to the previous part of the parametric analysis, contact roughness plays a prominent role on the recovery and plugging on soil samplers and specific recovery ratios much lower than 100% are found. As penetration progresses, the recovery ratio continuously decrease. For the three roughest simulations, specific recovery ratios below 10 % are found; this indicates that a soil plug is formed. Finally, at penetrations larger than 8 radii, the specific recovery ratio increases in most simulations: this is a boundary effect since the failure mechanism is influenced by the bottom boundary of the domain, where null displacements are imposed.
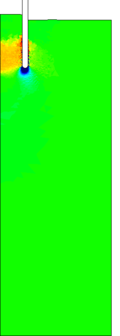
|
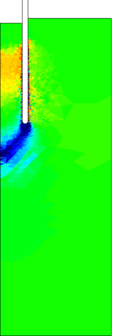
|
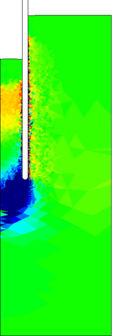
|
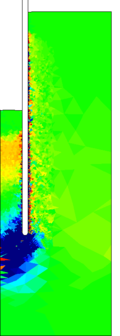
|
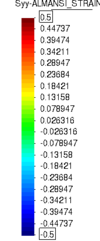
|
| (a) | (b) | (c) | (d) | (e) |
| Figure 80: Thick, round tipped sampler. Rough interface (). Vertical component of the Almansi strain tensor at several normalized penetrations. | ||||
To further investigate the effect of contact roughness in the deformation path of the sampling process, Figure 80 depicts the evolution of the vertical Almansi strain for the roughest case (). The first thing to notice is that the first stages of the penetration, the deformation path resembles that of the smooth case: strains are concentrated in the soil inside the sampler, with very high extension vertical strains, and very high compression vertical strains are found just below the tip of the tube (compare, for instance Figure 69(a) and 80(a)).
However, differences arise as the penetration of the tube progresses: differently from the smooth case, the vertical strain inside the tube is not constant. In the upper part, the sample presents very high extension strains, whereas the bottom part shows very high compression vertical strains. After a penetration of a steady state is reached since a plug is formed and soil no longer enters inside the sampler. As a consequence of that, it can be appreciated that the rest of the soil mass suffers noticeable vertical strains. Additionally, since the material is incompressible, a heave is formed in the outer part of the free surface.
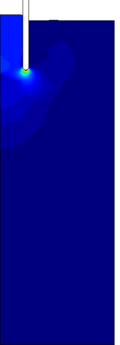
|

|

|
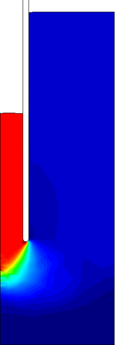
|
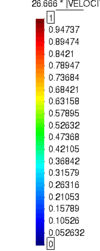
|
| (a) | (b) | (c) | (d) | (e) |
| Figure 81: Thick, round tipped sampler. Rough interface (). Magnitude of the normalized velocity. | ||||
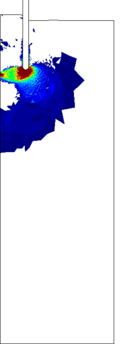
|
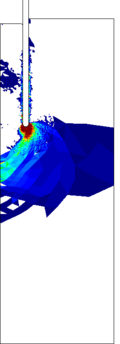
|
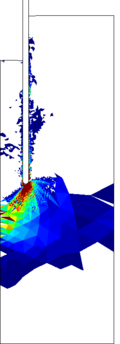
|
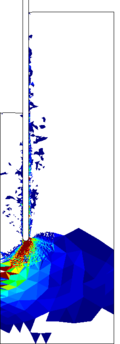
|
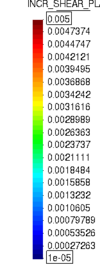
|
| (a) | (b) | (c) | (d) | (e) |
| Figure 82: Thick, round tipped sampler. Rough interface (). Incremental plastic shear strain. | ||||
To further describe the failure mechanism, Figures 82 and 81 present, respectively, the contour plots of the incremental plastic shear strain and the normalized velocity (the incremental displacement divided by the incremental time-step and the tube velocity). Two different mechanisms may be interpreted. At shallow depths (penetrations below ), the same mechanism than in the smooth case is observed: the material just below the tip of the sampler gets squeezed inside the tube; however, the firsts traces of the second mechanism are also observed. The second mechanism, that appears at large normalized penetration depths, is completely different: the soil in the plastic region suffers from vertical compression plastic strains and plastic strains are also present away from the tube. As it will be shown in Appendix D (Figure 169), this mechanism is identical to that of closed ended piles. Although, as in the smooth case, all the soil inside of the sample cease to deform and remains mostly in elastic regime, the direction of the velocity is different: in the smooth case, the soil inside the sampler moves upwards whereas in the rough case it moves downwards. Figure 81(d) also confirms the occurrence of a soil plug: the soil mass inside of the tube has the same velocity than the tube; though, they move in solidarity.
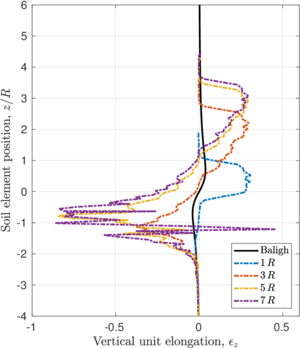
|
| Figure 83: Thick, round tipped sampler. Rough interface (). Centerline straining path. |
Finally, Figure 83 presents the centerline strain path for the roughest case (). At shallow penetrations (the curve at a penetration of ), the soil that enters the sampler suffers from high extension strains (with vertical elongations in the order of 25%); however, these strains are lower than in the smooth case (where the obtained vertical elongation is approximately 46% For penetrations in the order of , all the soil inside of the sampler suffers from vertical extension strains; however, the soil below of the cutting shoe position suffers from compression vertical strains. Once the plug is formed, the minimum vertical elongation of a soil element inside the tube is to -26%, that corresponds to the soil element located at . In this figure, it can also be noted that between the penetrations and , almost no soil enters the sampler. Additionally, some numerical noise appears in the centerline strain path, with some points with high extension strains in regions of vertical compression; this is a consequence of the discretization nearer the radial boundary, see Figure 80.
Again, the obtained centerline strain path is compared with that predicted by the Strain Path method [138]. The obtained numerical results do not show any similitude with those predicted by [138]: the shape of the curve and the magnitudes are completely different.
To conclude, Figure 84 fully characterize the stress state assuming a rough interface behavior () and a smooth one by presenting all the Cartesian components of the Cauchy stress tensor. As already commented, assuming a smooth interface behavior, a bulb of higher stresses is formed just beneath the cutting shoe of the sampler, stresses slightly increase around the outer shaft and small variations in the stresses appear in the soil that enters the tube. On the contrary, by assuming a rough interface, the bulb of high stresses is much larger and expands through the whole section of the tube; that is, by using a smooth interface the bulb is related to the thickness of the of the cutting shoe whereas in rough cases it is related to the diameter of the tube. The stress state in the vicinity of the outer shaft is similar in both cases, with the exception of tangential component , that is a consequence of the interface roughness factor, . Meanwhile, inside fo the tube, the soil suffers from high compression stresses, particularly in zones near the cutting shoe, by assuming a rough interface behavior.
Figure 85 presents the stress invariants of the Cauchy stress tensor; specifically, the total mean stress, (positive in compression), the second stress invariant, , and Lode's angle, . As already noted in the Cartesian components of the Cauchy stress tensor, assuming a smooth interface behavior, only high total pressures are found just beneath the cutting shoe, whereas the rest of the soil mass (including the soil inside of the tube) has a total pressure similar to the initial one (200 kPa); the soil inside of the tube suffers from high deviatoric stresses and is near to , although the soil remains mostly in elastic regime (see Figure 71). High deviatoric stresses are found in the vicinity of the cutting shoe, where the failure mechanism takes place.
The bulb of high total mean stresses is much higher employing a rough interface behavior () and expands through the whole diameter of the tube. Also, the region with high deviatoric stresses is much wider: adjacent to the inner and outer shaft and in a large region nearer the cutting shoe as a consequence of the failure mode (see Figure 82).
Figure 85 also compares the Lode's angle for two roughness factors: (smooth) and (rough). Although the spatial distribution of this stress invariant presents some spatial scatter, specially in regions nearer the right boundary, the Lode's angle presents a clear distribution in the active plastic region. In the smooth simulation, the Lode's angle is (triaxial extension) in the plastic zone whereas it is (triaxial compression) for the rough case.
Two of the principal stresses, and , are depicted in Figure 86. To better understand the significance of these plots, first, let us write the Tresca yield criterion in terms of the principal stresses:
|
|
(7.8) |
where are the principal Kirchoff stresses, , and the Jacobian is almost equal to the unity in quasi-incompressible situations, , such as this analysis. Then, the Kirchoff and Cauchy stresses almost coincide. Bear in mind that the computational soil mechanics sign convention (compression stresses are negative) is considered.
Consequently, the flow rule, Equation 3.18, may be stated as:
|
|
(7.9) |
where is the plastic rate of deformation tensor and is the plastic multiplier.
In other words, along the plastic region, the direction of corresponds to the direction of (incremental) plastic extension straining whereas the direction of corresponds to plastic compression straining (see Equation 7.9). Null, extensive or compressive plastic strains may develop along the direction of , depending on the value of the Lode's angle.
Then, the direction of the principal stresses depicted in Figure 86 can also be used to better understand the straining history, since plastic strains are much higher than the elastic ones. In the smooth case, the soil in plastic state is in triaxial extension state, (). Then, in the plastic region, the soil experience extension along the direction of , which, at a large extend, coincides with the vertical direction (Figure 86). In the other two directions, and -that coincide with the circumferential and vertical directions- the soil undergoes compression plastic straining.
In the rough case, the plastic region is characterized by a triaxial compression state (). Plastic compression strains appear in the direction of , whereas plastic extension straining takes place in the direction of the circumferential direction, that coincides with , and .
To fully characterize the strain path of the problem, Figure 87 presents the Cartesian components of the Almansi tensor. The previous description of the plastic straining is clearly seen in the simulation with a smooth interface behavior: inside of the tube the vertical Almansi strain is large and positive (extension), whereas the circumferential and radial are also large and negative (compression). The rough case is more difficult to interpret since the Cartesian coordinates do not coincide with the principal directions of plastic straining.
7.4 Thick, round tipped sampler with a piston
In all the previous analyses it has been assumed that the soil that lays in the inner free surface is free to move (upwards and downwards) and a load boundary condition has been placed in this part of the domain boundary. In this section, the geometry of the problem (Figure 68) is changed and a piston is placed on the inner free surface; this way, the upwards movement of the soil is restricted. This one-side displacement restriction is modeled by prescribing a contact plane that only acts on the inner free-surface. This plane is horizontal and its height is equal to the initial height of the inner free-surface. The contact constraints associated to this plane are the responsible of restricting the upward vertical displacement of the soil; however, in the event that a plug is formed, the soil of this part of the boundary of the domain may move downwards.
7.4.1 Smooth interface
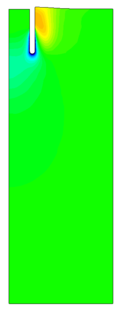
|
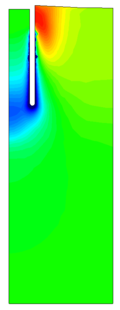
|
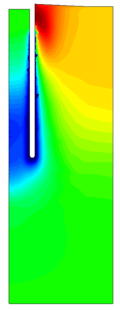
|
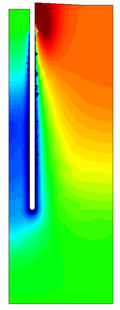
|
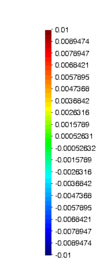
|
| (a) | (b) | (c) | (d) | (e) |
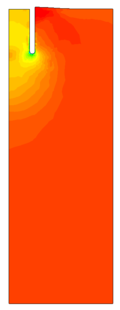
|
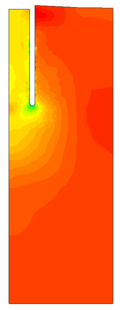
|
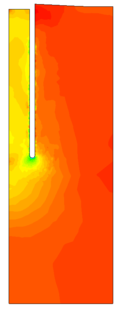
|
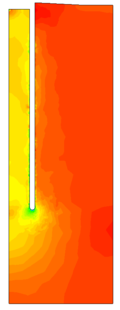
|
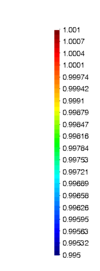
|
| (f) | (g) | (h) | (i) | (j) |
| Figure 88: Thick, round-tipped sampler with a piston. Smooth interface. Vertical displacement (m), on top, and Jacobian, bottom. | ||||
Figure 88 presents the evolution of the vertical displacement and the Jacobian, a measure of volume change, assuming a smooth interface at several steps of the simulation. As the tube penetrates, the soil in the inner part of the tube adjacent to the cutting shoe experience a downwards motion. Due to the quasi-incompressible response of the soil -the volumetric deformation is small, see Figure 88(bottom)-, in this region this vertical motion is compensated with radial displacements in the direction of the axis of symmetry. Results show that the soil mass adjacent to the outer shaft of the tube experience positive vertical displacements.
The former observations may also be also interpreted in Figure 89, that presents the normalized velocity (the incremental displacement divided by the incremental displacement of the tube) in the vicinity of the cutting-shoe.
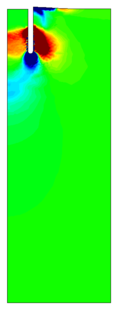
|
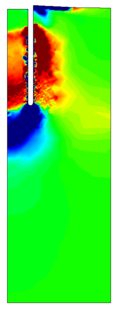
|
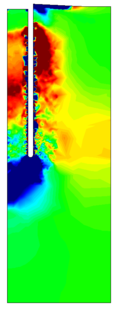
|
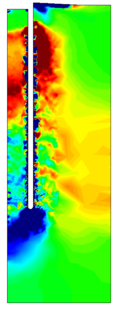
|
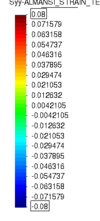
|
| (a) | (b) | (c) | (d) | (e) |
| Figure 90: Thick, round-tipped sampler with a piston. Smooth interface. Vertical Almansi strain. | ||||
Figure 90 presents the evolution of the vertical Almansi strain. In all the cases, a zone with high compression vertical strains appears below the sampler. During the first penetration radii, the soil that enters the sampler experience high vertical compression strains; these strains hardly vary as the tube continues penetrating. As penetration progresses, the soil that enters the tube has a practically zero vertical deformation. The obtained strains inside of the tube are quite homogeneous, except in the zone adjacent to the shaft. Since the material is quasi-incompressible and upwards vertical displacement is restricted in the inner boundary, the insertion of the sampler is compensated with extension vertical strains in zones adjacent to the outer shaft.
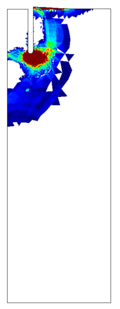
|
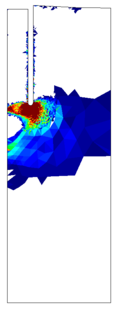
|
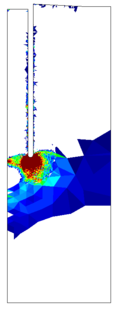
|
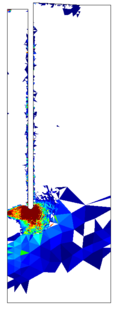
|
|
| (a) | (b) | (c) | (d) | (e) |
| Figure 91: Thick, round-tipped sampler with a piston. Smooth interface. Incremental plastic shear strain. | ||||
Figure 91 depicts the evolution of the incremental plastic shear strain. The soil located inside of the tube does not experience further plastic deformation. In the first steps of the problem (in penetrations below ), the active plastic region reaches the surface; as penetration progresses, a deep failure mechanism is formed.
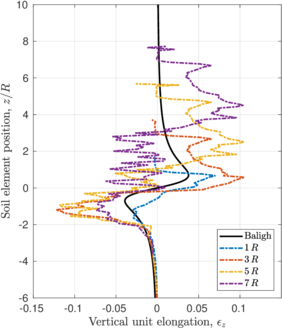
|
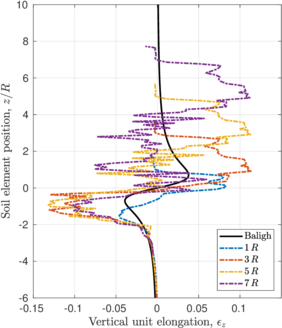
|
| (a) | (b) |
| Figure 92: Thick, round tipped sampler with a piston. Centerline straining path. Smooth interface, (a), and rough interface (), (b). | |
Figure 92(a) depicts the centerline strain path for the smooth case. For the first time in this chapter, the order of magnitude of the maximum and minimum vertical strains along the centerline is the same than that predicted by [138] (3.85% for the case ). However, the shape of these curves is quite different.
The first thing to notice is that some agreement between the computations and the solution proposed by [138] is found in soil elements located at 2 radii below the tip of the sampler (). From this depth onwards, the mismatch between the numerical and SPM solution is evident; it ought to be said that at this depth () soil elements experience plastic straining for the first time (see Figure 91).
At the centerline, plastic deformation only occur between (see Figure 91): first the soil suffers from high plastic vertical strains in compression and then from extension vertical strains. Once the soil enters the tube, it remains in elastic regime. This fact may also be interpreted in the centerline strain paths, shown at Figure 92(a): comparing the centerline strain paths computed after several penetration depths, once the soil element has entered the tube, the magnitude of the strain only varies due to elastic deformation (which is much more smaller than the plastic deformation).
For the first four penetration radii, the soil that enters the tube has experienced a net vertical extension strain. At larger penetrations, the soil that continues entering the tube suffers from a net vertical compression, that may estimated in the order of 2.5% (numerical results show some oscillations that are a consequence of remeshing). Irrespectively of the final net vertical strain, the soil experience high plastic strains (the maximum value of the compression vertical strain is 10%
The specific recovery ratio, presented in Figure 94(b) is always equal to 100%, with some small scale numerical oscillations.
7.4.2 Rough interface
The previous case has been reanalyzed by employing two different roughness factors ( and ). In general terms, the deformation path of the problem is quite similar to the reference case (smooth interface) for the amount of simulated penetration. For instance, the centerline strain path for the smooth and rough interface are quite similar (compare Figure 92). Outside the tube, some differences appear in the movement of the exterior free surface (see Figure 93).
Although the deformation path seems independent of the contact roughness, the stress fields are quite different. Figure 93 compares the vertical total stress for the three cases at a penetration equal to . Outside the tube, the high stresses are a little larger in the simulations in which the contact roughness factor is larger than zero. Inside of the tube the stress state is completely different: in the smooth computation, the stress state is almost constant along the sample and the vertical stress is larger than the initial one (200 kPa). In the rough simulations, the vertical stress is high in the vicinity of the cutting-shoe and constantly decreases as the shaft moves along.
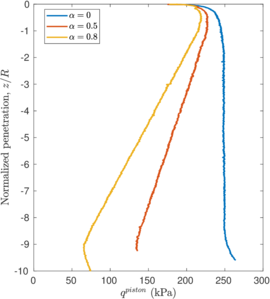
|
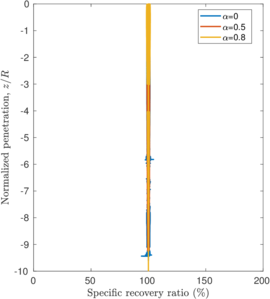
|
| (a) | (b) |
| Figure 94: Thick, round-tipped sampler with a piston. Stress acting in the piston, (a), and specific recovery ratio, (b), for three contact roughness factors. | |
The total vertical stress acting on the piston (that is, the force divided by the internal area) is depicted in Figure 94(a). For the smooth case, rapidly a steady state is achieved and this stress is in the order of 250 kPa; that is, 50 kPa larger than the initial stress. Meanwhile, for the rough cases, this stress continuously decreases. At penetrations larger than the piston stress increases due to the relatively small dimensions of the computational domain.
Figure 94(b) depicts the evolution of the specific recovery ratio in terms of the penetration. In the three cases the specific recovery ratio is equal to 100% during the whole simulation.
7.5 Thick sampler with a beveled cutting edge
Not only tube samplers whose tip is rounded have been considered in this work. In this section, the effect of the geometry of the sampler is assessed. In particular, a sampler with an outside cutting-edge angle of and null inside cutting-edge angle is analyzed. Due to numerical reasons, the two sharp edges of the tube are rounded; otherwise, when a node passes from the tip of the sampler to the shaft, the stress state varies abruptly, that may produce numerical breakdowns when an implicit time marching scheme is used. The precise shape of the cutting shoe of the sampler is shown in Figure 96(c).

|

|

|

|
|
| (a) | (b) | (c) | (d) | (e) |
| Figure 95: Thick sampler with a beveled cutting shoe. Smooth interface. Vertical Almansi strain. | ||||
Figure 95 presents the vertical component of the Almansi strain tensor assuming an smooth interface. As in the round tipped case, the vertical strain in the soil mass inside the tube is uniform and low vertical strains are found just beneath the cutting shoe. However, in this case, the vertical deformation of the soil inside of the sampler is lower and significant deformation occur in the outer part of the tube.
As observed by the Almansi strain (Figure 95) and, below, by the specific recovery ratio (Figure 98), the problem reaches a steady state at very shallow penetrations (at ). To illustrate the failure mechanism, Figure 96 presents the distribution of the incremental plastic shear strain and the normalized velocity after a penetration of . The first thing to notice is that the active plastic zone is located beneath the cutting shoe of the sampler and it extends up to the axis of symmetry of the problem; additionally, some plastic deformations also occur at one radii of distance below the cutting shoe. There exist two distinct localization planes that converge in the axis of symmetry; the lowest one begins at the corner defined by the cutting-shoe and the outer shaft of the sampler, whereas the other initiates at the lowest point of the tube. The velocity vectors show that part of the soil located beneath the cutting shoe of the sampler has a downwards component of the velocity and gets inside of the tube. Differently from the rounded tipped tube, the insertion of this sampler produce significant deformation to the soil mass outside of the tube, that gets pushed outwards to accommodate part of the volume of the rigid body.
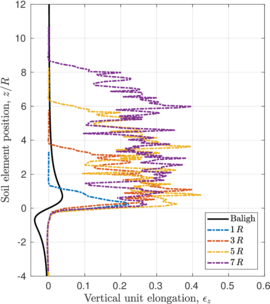
|
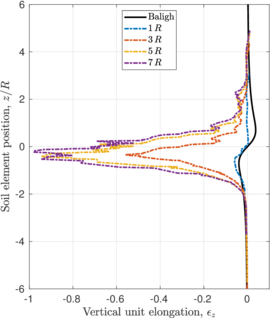
|
| (a) | (b) |
| Figure 97: Thick sampler with a beveled cutting shoe. Centerline straining path for a smooth interface, (a), and a rough interface (), (b). | |
Figure 97(a) presents the centerline strain path for this tube geometry using assuming a smooth interface behavior. Qualitatively, this strain path is almost coincident to that obtained for a round tipped shoe (Figure 73); however, in this case, the vertical strain inside the tube is constant and nearer 25%, whereas a value of 47% is obtained with a round-tipped cutting shoe. These centerline strain path present higher spatial variability than the previous ones and is a consequence of the numerical oscillations that present the Almansi strain tensor, Figure 95.
Finally, Figure 98 compares the specific recovery ratio in terms of penetration for an smooth interface for the round tipped sampler and the one with an outside cutting-edge angle of 20. It is evident from this figure that the shoe of the sampler plays a prominent role in the amount of material that enters the tube: using a rounded tip the specific recovery ratio is in the order of 146% whereas it reduces to 125% considering a beveled cutting shoe.
7.5.1 Effect of contact roughness
As noted in the analysis of round tipped samplers, the rigidity index, the difference between the internal and external boundary load and the initial stress have little influence on the deformation path of the problem and on the specific recovery ratio. As such, these factors are assumed unimportant for this cutting-shoe geometry and the effect of the contact roughness is directly assessed.
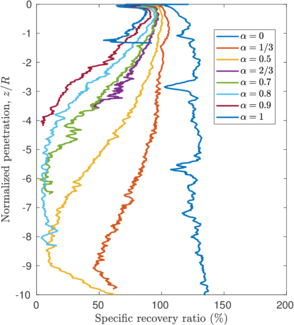
|
| Figure 99: Thick sampler with a beveled cutting shoe. Evolution of the specific recovery ratio in terms of the normalized penetration. Effect of the adhesion or roughness factor. |
Figure 99 presents the evolution of the specific recovery ratio in terms of the normalized penetration for different contact roughnesses. As in the analysis of the round tipped cutting shoe, the contact roughness plays a prominent role on the specific recovery ratio. Again, larger values of the contact adhesion produce lower recovery rates and, in the cases with higher roughnesses, a plug is formed. It is worth noting that for all the assessed contact roughnesses (), specific recovery ratios below 100% are obtained during the whole simulation.
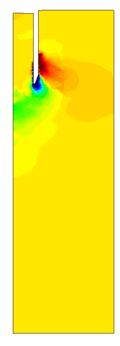
|
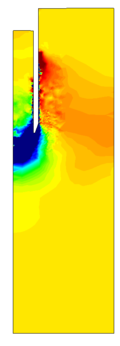
|
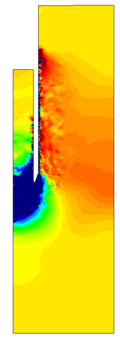
|
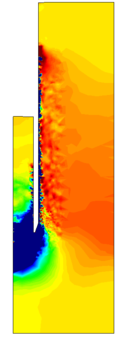
|
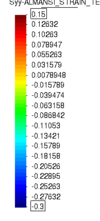
|
| (a) | (b) | (c) | (d) | (e) |
| Figure 100: Thick sampler with a beveled cutting shoe. Rough interface (). Vertical Almansi strain. | ||||
To further illustrate the solution, Figure 100 presents the contour plots of the vertical Almansi strain for a rough interface (). Very high compression strains appear just below the tube, whereas vertical extension strains are found in the vicinity of the outer shaft. The soil inside of the tube suffers vertical compression strains.
Once non-smooth interface behavior is considered, there exist two distinct failure mechanism: the first one, that prevails in the cases with low contact adhesions and appears when the specific recovery ratio in the order of 100% or higher (namely, in the numerical simulation with , between the penetration ), is almost coincident with that described for the smooth case (Figure 96). Meanwhile, the second mechanism appears in the cases where the specific recovery ratio is lower than 100% and is depicted in Figure 101: this mechanism is coincident with that obtained in the previous analysis of round tipped tubes with high contact roughnesses: the plastic zone expands far away from the sampler (at several radii in the horizontal from the tip of the sampler) and resembles that of closed-ended piles. The soil affected by this mechanism that enters inside of the tube suffers from high compression vertical strains. Irrespectively of the failure mechanism, the soil inside the tube remains in elastic regime during the tube insertion.
The centerline strain path for a rough case () is presented in Figure 97(b). During the first steps of the simulation (penetrations in the order of ), the previously mentioned failure mechanism is not yet formed and the insertion of the rigid body is compensated with plastic deformations that only affect the outer part of the soil mass; this is the reason beneath the limited deformations that exhibit the centerline strain profile after a penetration of . Afterwards, the failure mechanism tends to that of a closed ended pile and the plug is formed. At this stage, the soil in the vicinity of the cutting shoe suffers very high compression strains; the peak compression strain is 97%
7.6 Thin, round tipped sampler
In the previous, sections several analyses with different cutting-shoe forms and the existence of a piston in the interior of the tube have been presented; all these simulations considered the same ratio between the outer diameter and wall thickness, . As already commented, this ratio determines the deformation behavior of the problem and, thus, has a great importance on the quality of the retrieved sample [137,138,139].
In order to further the analysis, this section presents results of the simulation of a tube whose ratio between the outer diameter and the wall thickness is . It should be noted that the mesh size of this kind of analysis is determined by the thickness and geometry of the cutting-shoe; as such, increasing the ratio drastically increases the computational cost. To obtain an accurate solution, at least 30 nodes are required to discretize the round-tipped cutting shoe; consequently, the element size should be around the tip of the tube.
In this section, first, the reference case is presented, that is characterized with a and a smooth interface. Based on the results of the parametric analysis performed for the thick, round tipped sampler, Figures 75 and 79, only the effect of the interface contact roughness factor is assessed.
7.6.1 Reference case
The reference case of this section only differs from that utilized in Section 7.3.1 in the thickness of the tube wall; in this section the ratio between the outer diameter to the wall thickness is instead of . All the constitutive parameters and the initial stress state are the same.
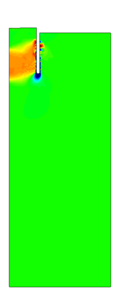
|
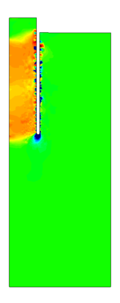
|
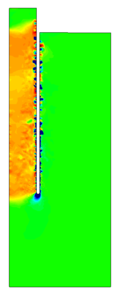
|
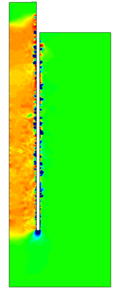
|
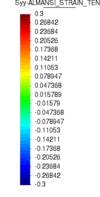
|
| (a) | (b) | (c) | (d) | (e) |
| Figure 102: , round tipped sampler. Reference case (smooth interface). Vertical component of the Almansi strain tensor at several normalized penetrations. | ||||
Figure 102 presents the vertical component of the Almansi strain tensor at several advances of the tube. As in the case very high compression vertical strains are found just below of the cutting shoe of the sampler and the soil that enters the sampler suffers from very high extension strains. Comparing this figure with the one for the case (Figure 69, with different minimum and maximum threshold value in the legend), it can be seen that the deformation contours are very similar, but with different magnitude of the strains.
Figure 103(a) presents the centerline strain path at several penetration depths. These straining histories are coincident with those encountered in the analysis of the case (presented in Figure 73). The main difference lays in the maximum and minimum value of the vertical strain: in the present case the vertical unit elongation inside of the tube is in the order of 18% whereas in the case with this strain measure is in the order of 48% Meanwhile, the maximum vertical compression strain is approximately 0.122% whereas for the thick case is 0.322%
Figure 104(a) compares the specific recovery ratio for smooth simulations using different . By considering a thiner tube the maximum extension strains decrease and also does the specific recovery ratio.
7.6.2 Parametric analysis. Contact roughness.
The same problem has been recomputed by using several roughness factors. As depicted in Figure 104(b), the specific recovery ratio monotonically decreases as penetration progresses. A steady state is not achieved due to the relatively small dimensions of the domain and the high computational cost of these analysis.
In this set of simulations, the same tendencies described in the cases of are observed: in the first steps of the simulation the same failure mechanism than in the smooth case is observed; as deformation progresses, it seems than the deformation path transitions to the second failure mode observed in the plugged cases of the thicker case.
7.7 Analysis of the peak strains at the centerline
This section summarizes the centerline vertical strains. In particular, Figure 105 presents the value of the maximum compression and extension vertical unit elongations during the tube sampling for most of the previously presented numerical simulations; the same data is also detailed in Table 14.
| Shape of the cutting-shoe | Contact roughness factor, | Peak extension strain (%) | Peak compression strain (%) | |
| 10 | Circular | 0 | 48 | 0.322 |
| 10 | Circular | 0.8 | 32 | 80 |
| 10 | Circular. Piston | 0 | 10 | 11 |
| 10 | Circular. Piston | 0.8 | 12 | 13 |
| 10 | Beveled | 0 | 34 | 0.42 |
| 10 | Beveled | 0.8 | 0.3 | 97 |
| 20 | Circular | 0 | 18 | 0.122 |
As already noted before, the peak maximum vertical strains along the centerline are completely different from those predicted by [138]. The maximum extension unit elongation for a round tipped, smooth interface is an order of magnitude larger than that predicted by the Strain Path method. Interestingly, the results on transparent soil using PIV presented by [149] for a without a pressure plane in the inner free surface show the same tendency with the results obtained here for a smooth interface for a round-tipped tube; additionally, all these results are in concordance with the simple model stated around Equation 7.5, that assumes that all the soil that is located below the tube gets squeezed inside. Meanwhile, the calculated peak compression strain is much more lower than the one predicted by [145]: it has been noted that this compression strain is achieved in elastic regime.
Considering a rough interface behavior instead of a smooth one, reduces the peak extension strain. However, after a plug is formed, the calculated maximum compression strain is very high, between 80% to 97% This very high compressions are located outside of the tube, but inside of the tube the maximum compressions are also high, between 25% to 63%
The shape of the cutting shoe also influences the obtained peak elongations: the peak compression strain gets reduced from 48% (round-tipped shoe, , smooth interface) to 34% (beveled cutting edge, , smooth interface), whereas the peak compression strain is similar. For a rough interface (), the peak compression is reduced: from 32% to 0.3%; it should be noted that this results may be due to a different initial embedment of the structure, that is initially wished-in-place at different depths in each set of simulations. In terms of the compression strains, no large discrepancies appear due to the form of the cutting shoe: in both cases a plug is formed and the vertical unit elongation is larger than 80%
The placement of a piston in the interior free surface plays a prominent role in the peak vertical strains. Then, the maximum in compression and extension are similar (in absolute value) and around 11% for , whereas the prediction of [138] is 3.85% Unfortunately, it is clear that the calculations with a rough interface have not yet achieved a stationary state (see Figure 94): it is believed that a plug may eventually be formed.
7.8 Analysis of the occurrence of a plug
In this section, the theory developed by [1] to predict the occurrence of a plug in open-ended piles is assessed against the obtained numerical results. To use this theory, the bearing capacity factor of a closed-ended pile is required. The details of the simulation of this problem and the main results are presented in Appendix D, where it is shown that the bearing capacity of a closed-ended pile may be estimated as for a smooth interface and increases with the contact roughness to ().
A by-product of the analysis performed herein, the bearing capacity factor of open-ended piles, is also presented in Appendix D.
7.8.1 Occurrence of a plug. [1].
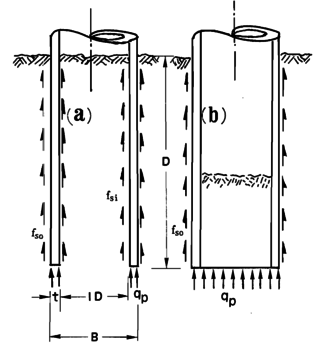 ] ]
|
| Figure 106: Sketch of the forces acting on open-ended piles under unplugged, (a), and plugged conditions , (b). [1] |
As already discussed in the introduction, Paikowsky and Whitman [1] developed a theory to predict the occurrence of a plug in open ended piles. In essence, the theory states that the pile becomes plugged when the inner-soil cylinder develops sufficient frictional resistance that prevents further soil to intrusion and the plugged pile assumes the penetration characteristics of a closed-ended pile. In other words, the unit end bearing capacity of the plugged pile, termed as in Figure 106(b), is similar to the end unit bearing capacity of a closed-ended pile.
For an open-ended pile, this unit end bearing capacity ( in Figure 106) is composed by the tip bearing capacity, the inner shaft frictional forces and the load boundary condition imposed at the inner free surface:
|
|
(7.10) |
where stands for the tip unit end bearing capacity, is the cross-sectional area of the pile tip, is the integral of the internal unit shaft friction, is the load boundary condition imposed at the inner free surface over the area and is the overall cross-sectional area.
The condition for the formation of a plug proposed by [1] (i.e. the plug of an open-ended pile is mobilized when the accumulated inside skin friction exceeds the ultimate static bearing capacity of the soil below the toe of the pile), leads to the definition of a bearing capacity factor, , as:
|
|
(7.11) |
where is the load boundary condition imposed in the outer free surface (Figure 68).
According to the theory developed by [1], should be equal to the bearing capacity factor of a closed-ended pile, , when a plug is formed.
When a piston is placed in the inner free surface instead of a load boundary condition, this bearing capacity factor should be redefined as:
|
|
(7.12) |
where is the vertical force exercised by the piston.
7.8.2 Assessment against the numerical results
Thick, round tipped samplers
The theory of [1] is first assessed against the numerical results of the simulations of thick, round tipped samplers. Figure 107 presents the main results of interest here: on the one hand, the specific recovery ratio and, on the other hand, the bearing capacity factor presented in Equation 7.11. As already mentioned before, the roughest simulation () has a practically null specific recovery ratio after a penetration of , indicating the formation of a plug. Meanwhile, for the plug is formed nearer a penetration of , whereas a plug may be formed around a penetration of for the case . Since the domain is not sufficiently large, after a penetration of the plug disappears due to a finite boundary effect.
The previously described penetrations at which the plug is formed for each simulation coincide with the depth where the bearing capacity factor described in Equation 7.11 is close to the bearing capacity of a closed-ended pile (as shown in Figure 168: for a smooth interface and for a rough interface ()). Specifically, it seems that the plug is formed once the bearing capacity reaches the value of a smooth closed ended pile and, afterwards, the capacity slightly increases.
Thick sampler with a beveled cutting edge
The same analysis is repeated in Figure 108 for the beveled cutting-shoe, that has an outer cutting-edge angle of 20. The closed-ended pile has not been recomputed with the cutting-edge angle of 20 and the reference closed-ended pile of the previous case is used since the mismatch of the geometry is not substantial. Also in this case, a good correspondence between the formation of a plug (very low specific recovery ratios) and a value of the bearing capacity factor defined in Equation 7.11 similar to that of a closed ended pile is obtained.
Thick, round tipped sampler with a piston on top
Figure 109(b) depicts the evolution of the bearing capacity factor in terms of the penetration for the cases in which a piston is placed on top of the internal free surface. The value of this factor is always lower than those of closed ended piles. For the smooth case a steady state is achieved after a penetration of . Meanwhile, for the rough cases, the bearing capacity factor continuously increases. It should be noted that the contribution to this factor due to the vertical stress exerted by the piston continuously decrease (see Figure 94); on the contrary, the contribution to due to the tangential contact forces increase because the area of the internal interface in contact with the soil continuously becomes larger.
Thin, round tipped sampler
Figure 110 presents the evolution of the bearing factor and the specific recovery ratio in terms of the penetration. Lower values of the bearing factor are obtained with respect to the thick case because: (i) the contribution of the tip resistance to this factor is lower due to a lower area and (ii) lower specific recovery ratios are achieved in the thinner case, thus, the area of the inner shaft does not increase at the same rate.
7.8.3 Relationship between the specific recovery ratio and the bearing capacity factor
In order to study the dependency of the bearing capacity factor and the specific recovery ratio, Figure 111 presents plots between them for the four different samplers that have been analyzed in the previous sections. To decrease the amount of noise related to the first steps of the simulation, where the failure mechanism is not yet formed, and due to the relatively small domain considered, only data from the central part of the simulation has been considered: that is, from the first penetration radium till a clear boundary effect is observed in the curves.
One thing is clear, by placing of a piston on the inner free surface, the recovery ratio is always 100% and independent of the bearing capacity factor (Figure 111(c)). However, as stated before, these simulations have not yet achieved a clear stationary state, results suggest that the bearing capacity factor could still increase and, in the rough cases, it is hypothesized that a plug may eventually form.
On the other three cases, where the vertical displacement of the inner free surface is not restricted, it is clear that both variables are linked: there exist a curve that goes from the values representing the smooth case (the lowest bearing capacity factor and the highest specific recovery ratio) to fully plug conditions (null recovery ratio and a bearing capacity factor similar to that of closed-ended piles). This unique curve is completely independent of the so-called contact adhesion or roughness factor, , but depends on the geometry of the cutting shoe (rounded or sharp), the ration between the diameter and the thickness of the wall, , and also may vary with the soil rigidity index (as it is shown in Appendix D, the bearing capacity factor for smooth tubes increases with the rigidity index but the specific recovery ratio is almost independent).
7.9 Concluding remarks
Tube sampling constitutes a core activity in site investigation; thus, the study of soil disturbance during sampling is of vital importance. Several methods have been proposed to study this problem, encompassing the Strain Path method [138,139] and even the Finite Element method [147,148].
This chapter has presented the numerical simulation of tube sampling using a total stress approach. The parametric analysis included several cutting-shoes geometries (round tipped sampler and beveled cutting-shoe geometries with an outside cutting angle of 20), ratios between the outer diameter to the wall thickness, constitutive parameters, external loads and interface roughnesses.
The numerical centerline strain paths have been compared with those predicted by the Strain Path method and the Shallow Strain Path method. Very limited agreement has been found between the numerical simulations and the theories proposed by [145,138,146]: not only the order of magnitude of the developed vertical strains are different, but also the shape of the curve is different.
The first part of the parametric analysis of a thick, round tipped sampler, where the effect of the rigidity index, the initial effective stress and the difference between the load applied in the internal and external free surface, reveled that all these factors have a very limited influence on the deformation path of the problem. Only the difference between the inner and outer load boundary condition has a noticeable effect on the specific recovery ratio. On the contrary, the variable that governs the strain and stress state of the problem is the contact roughness. When a rough interface in considered, the specific recovery ratio continuously decrease until it reaches a steady state around 0% (a plug is formed); the lower part of the soil sampler suffers from high compression strains, with unit vertical elongations in the order of -70%
Beveled cutting-shoes have also been considered: it has been observed that this geometry reduces the amount soil recovery: for the smooth case the specific recovery ratio drops from 146% (round tipped sampler) to 125% However, this kind of geometry also plugs when a rough interface is considered.
The placement of a piston in the interior free surface to restrict the soil upwards movement has been also studied. For this case the soil that enters the tube suffers from lower strains. The obtained deformation path seemed independent of the interface behavior; however, a stationary state has not been reached for the cases with a rough interface.
The thickness of the wall also plays a prominent role on the peak strains at the centerline and the specific recovery ratio; both measures decrease by considering a thinner wall.
Finally, the theory proposed by [1] to predict the occurrence of a plug inside of an open-ended pile has been assessed. This theory states that a soil plug is formed once the insertion of an open-ended structure assumes the penetration characteristics of a closed-ended pile. In other words, the plug is mobilized once the sum of the vertical forces acting to the tube tip, the internal friction forces and the force acting on the interior free-surface equals the force that will mobilize by a closed-ended pile.
Despite the quite simple rational of the theory, that is based on the equilibrium of forces along the vertical direction, the analysis of the numerical results have corroborated this theory: it has been shown that the plug is formed (specific recovery ratios below 10%) once the mobilized forces are equal to that of a smooth closed-ended pile. Indeed, the failure mechanism that prevails during the penetration of a plugged tube is coincident with that of a closed ended pile.
8 Coupled effective stress analysis of insertion problems in geotechnics
This chapter is devoted to the numerical analysis of insertion problems in fluid saturated porous media; in contrast to the previous chapters, herein, the coupled hydro-mechanical formulation is employed. The robustness and accuracy of the proposal is numerically demonstrated presenting results from two benchmark examples. The first one addresses the consolidation of a circular footing on a poroelastic soil. The second one is a parametric analysis of the cone penetration test (CPTu) in a material described by a hyperelastic-based Modified Cam Clay model, in which the influence of permeability and contact roughness on test results is assessed.
8.1 Consolidation beneath a circular footing
The first example of application involves the computation of the loading and subsequent consolidation of a linear elastic soil by an impermeable, rough, rigid circular footing. This problem has been previously used as benchmark [19], so it allows comparison with other numerical approaches.
This analysis is used to explore the influence of the temporal and spatial discretizations, stress the benefits of the stabilization procedure and study the performance of the mixed formulation. To concentrate on those aspects neither the contact nor the remeshing algorithms are used in the solution. Therefore, instead of simulating the footing as a rigid body indenting the soil, the footing is discretized as a deformable but very rigid body –with elastic modulus two orders of magnitude larger than that of the soil. Load is applied on top of the footing. Additionally, and due to the relatively small displacements involved, remeshing algorithms are disabled so that the solution is unaffected by mesh interpolation.
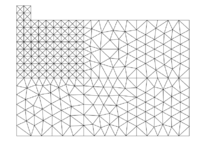
|
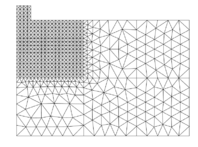
|
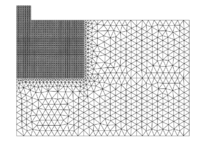
|
| (a) | (b) | (c) |
| Figure 112: Rigid circular footing. Finite element meshes: Mesh A (), (a), Mesh B (), (b), and Mesh C (), (c). | ||
The analysis is set up following [19]. The circular footing radius and height are equal to 0.5 m. The loading boundary condition is ramped from 0 to 150 kPa in one day; afterwards it is held constant to observe consolidation. The domain is 12 radii in width and 6 radii in height. The relevant material properties are Young Modulus, kPa, Poisson’s ratio, , and a permeability m/day. As in [19], we also specify unit weight kN/m and the coefficient of lateral earth pressure at rest , although these input values do not have any effect on the output of this quasi-static elastic problem. The initial condition for water pressure is hydrostatic; drainage is only allowed at the free upper boundary.
| Number of nodes | Number of elements | |
| Mesh A | 352 | 636 |
| Mesh B | 902 | 1712 |
| Mesh C | 3203 | 6236 |
The problem is discretized with three different meshes, progressively refined (Figure 112). In all of them the footing and the nearby zone have structured meshes. Element sizes at the footing are given by (Mesh A), (Mesh B) and (Mesh C). Therefore between 3 and 9 nodes are shared by the footing and the soil; the number of nodes and elements is reported in Table 15. In [19] an element size of is used but, since the elements are quadratic, the discretization level is similar to that of Mesh C. A constant time-step is used during the loading phase; during the consolidation phase the time increment is updated according to .
Figure 113(a) shows the evolution of vertical displacement at the centerline of the footing for the three meshes, computed using both the primal and mixed formulations. Figure 113(b) presents the pore pressure evolution at depths of one, two and three radii beneath the footing centerline. Both mesh coarsening and problem formulation have a small but perceptible influence on the results: a finer mesh results in slightly larger settlements and pore pressures.
Coarser meshes hence result in a modest stiffening of the model response; the same happens when the primal () formulation is used instead of the mixed one (). Figure 114 presents these effects at the end of the loading phase, showing a linear dependency with element size. The (small) difference between mixed and primal formulation may be explained as a result of volumetric locking, which would affect the primal formulation during undrained loading. Indeed, as shown in Figure 113, differences between primal and mixed formulation results are practically constant during the consolidation phase.
Figure 113(a) also includes the results reported by [19] for simulations of the same problem, using RITSS and EALE. At a comparable level of discretization (Mesh C), the GPFEM solution is practically coincident for the undrained phase, but a small difference appears during consolidation. Indeed, GPFEM shows a slightly stiffer response predicting a final settlement value of 0.168 m, about 96% of the value attained by [19].
This difference may be explained by the different variables used in the basic formulation. In GPFEM the elastic moduli relates Kirchhoff stress and Hencky (logarithmic) strain. In RITSS and EALE the modulus relates an objective rate of Cauchy stress and the rate of deformation tensor. Using identical values of elastic moduli in both formulations will not produce the same results, except at very small strains. In the problem analyzed Hencky strain levels attain peaks above 10% Interestingly, for uniform Hencky strains of that magnitude, a one-dimensional analysis indicates that the required modulus to obtain equivalence is 95% of the small strain value.
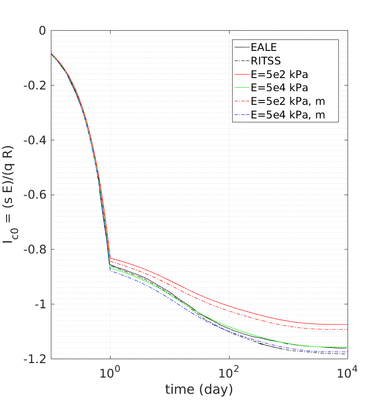
|
| Figure 115: Rigid circular footing. Normalized settlement evolution for high and low modulus values. |
The problem has been recomputed using a soil modulus increased 100 times to 50,000 kPa and modifying the permeability so as to maintain the same coefficient of consolidation. The increased stiffness results in strain levels well within the small strain range. To compare results with different stiffnesses, a normalized settlement is defined as:
|
|
(8.1) |
where is the footing settlement, stands for the Young's modulus, is the loading of the footing and is the footing radius. The normalized settlement evolution plot (Figure 115) shows that, when small strains are guaranteed, the GPFEM computation follows quite closely the reference solution. [154] present other comparisons between hypoelastic and hyperelastic formulations that further clarify this effect.
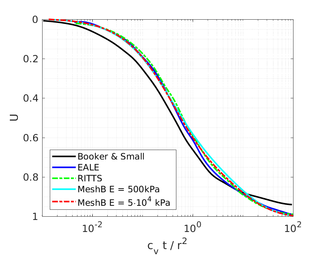
|
| Figure 116: Rigid circular footing. Normalized settlement underneath the footing during the consolidation phase. |
Booker and Small [155] published analytical solutions for the problem of consolidation beneath a smooth impermeable circular raft of finite stiffness. The normalized consolidation curve from that solution is compared with the numerical solutions in Figure 116. All numerical solutions plot very close to one another and the small differences with the analytical solution are likely due to the different mechanical interface condition (smooth contact vs perfect adherence). The use of stabilization in the mass conservation equation does not seem to produce any over-diffusive effect.
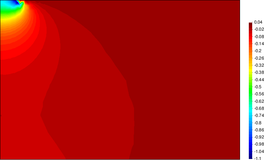
|
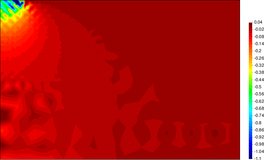
|
| (a) | (b) |
| Figure 118: Excess water pressure (kPa) at days using Mesh C. days. Stabilized solution, (a), and unstabilized solution, (b). | |
A separate parametric analysis was performed to examine the influence of the time step and the performance of the numerical stabilization procedure. The footing consolidation problem was thus recomputed using different time-steps, ranging from 1 day to 0.01 days. Figure 117 shows the influence of the time step size on the settlement at the end of the loading phase. For this particular mesh the stabilization term activation condition (see Equation 2.156) is fulfilled when the time step falls below 0.38 days. Once stabilization is active, the slight reduction in settlement that initially accompanies time step reduction is eliminated. However, the more visible benefits of stabilization appear examining the spatial oscillations of the water pressure solution, Figure 118, which disappear when the stabilization term is active. Although this kind of spatial oscillation may be relatively inconsequential here, that is not the case for more challenging simulations such as those considered next.
8.2 Cone penetration test: effects of permeability and interface friction
In this section, the proposed numerical technique is applied to an axisymmetric case: the Cone Penetration Test. A CPTu with standard dimensions (mm; apex angle ) is pushed into a Modified Cam Clay (MCC) soil. A parametric study is presented in which permeability and interface friction angles are varied to observe their effect on net cone resistance, sleeve friction and pore pressure generation at the three standardized measurement positions: position (at the midface of the cone), (at the apex between the cone and the shaft) and position (just above the friction sleeve, at 7.5 cone radii above the apex); the position of these measurement points is depicted in Figure 119(b).
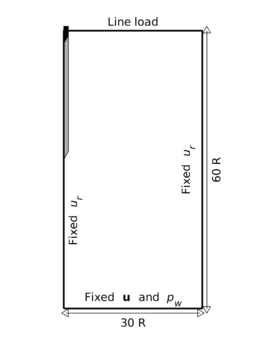
|
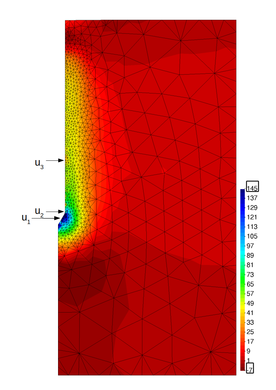
|
| (a) | (b) |
| Figure 119: CPTu penetration. Sketch of the geometrical and boundary conditions, (a), and mesh after 20 radii of penetration, (b). Contour plot of the excess water pressure (kPa). | |
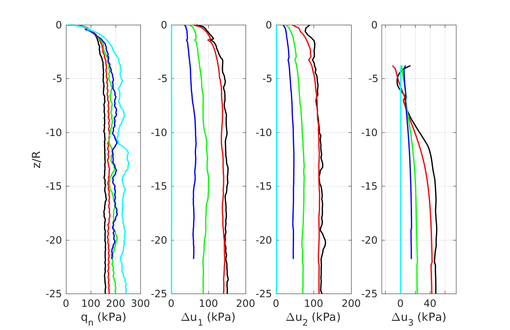
|

|
| (a) | (b) |
| Figure 120: CPTu penetration. Profiles of net cone resistance, , and excess water pressure at the three measurement positions vs normalized penetration depth. Smooth interface with . | |
Several researchers [156,157,158,123] have addressed this problem using the commercial code Abaqus, although [158] did not use MCC, but rather a Drucker-Prager model, in which sometimes a separate volumetric hardening cap was included. A frictionless contact has been generally favoured to avoid numerical breakdowns: only [156,157] report successful simulations with a frictional contact. However, they also reported numerical difficulties in that case which restricted their work to relatively small penetrations () and relatively low friction values ( ). Such friction values are well below those observed in steel-clay interface friction experiments, (for instance, [159], report within a range of 22 to 27).
Ceccato et al. [160,161] have used a code based on the material point method (MPM) to study this problem using MCC. The approach followed is powerful but computationally demanding: the code is three-dimensional and the problem is described within a fully dynamic setting, where both solid and fluid velocities () are used as primary variables to describe fluid-solid coupling. Both mass-scaling and local damping were introduced to speed-up and stabilize the semi-explicit time integration scheme.
The basic constitutive parameters used here are listed in Table 16, alongside those of previous work which is later used for comparison (unfortunately, parameters in [156] are not clearly reported). The selected values try to mimic the example reported by [123], although here the effect of the weight of the soil has been omitted and the initial effective stress and water pressure have been chosen to match those encountered in [123] at final penetration depth (Table 17).
A comprehensive review of the employed constitutive parameters is presented in Appendix B, where three different sets of similar constitutive parameters are used to simulate several elementary tests in order to characterize the material response and to assess the influence of these parameters on the overall behavior of the constitutive model. In particular, the influence of the parameters that control the elastic deviatoric behavior ( and ) is analyzed; additionally, it should be noted that also controls the amount of coupling between the elastic volumetric and deviatoric response. The influence of these three sets of constitutive parameters in the simulation of boundary value problems is described in Appendix E, that presents the simulation of the CPTu in practically drained and undrained conditions for these sets of parameters. Additionally, in the case of the undrained penetration, the subsequent dissipation phase is also reported.
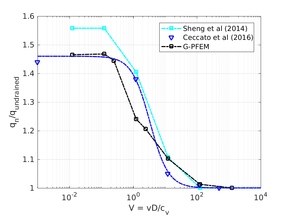
|
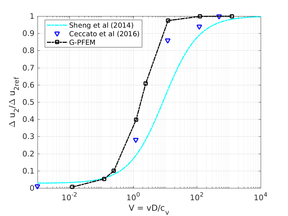
|
| (a) | (b) |
| Figure 122: CPTu penetration, smooth cone. Backbone curve for a frictionless CPTu in Modified Cam Clay soil: cone tip resistance, (a), and excess water pressure at the position, (b). | |
| Reference | OCR | |||||||||
| (kPa) | (kPa) | (m/s) | ||||||||
| This work | 2.0 | 0.05 | 0.3 | 1 | 70 | 1.2 | 23.5 | 400 | - | |
| Sheng et al. | 2.0 | 0.05 | 0.3 | 1 | 1.21 | - | - | 0.33 | ||
| Ceccato et al. | 1.41 | 0.04 | 0.2 | 0.92 | 1 | - | - | 0.25 | ||
| Reference | |||
| This work | 57.85 | 28.93 | 0.5 |
| [123] () | 57.85 | 28.93 | 0.5 |
| Ceccato et al. [160,161] | 50 | 34 | 0.68 |
The domain (Figure 119(a)) has 30 times the cone radius for width and 60 times for the depth. Computation starts with the cone pre-installed at a depth of 3 cone radii. This avoids the numerical problems that may arise at the first steps of the calculation, when only a node of the soil is in contact with the rigid structure. The cone is pushed at the standard velocity (20 mm/s). Drainage is only allowed through the bottom boundary of the soil domain. A constant vertical stress is applied at the top boundary. The radial displacements are fixed on the left and right boundaries whereas null displacement in all directions is precribed at the bottom of the domain.
The simulations used elements due to their good numerical performance for CPT simulation in undrained conditions (see Chapter 5). Good performance in this context means: smoother cone resistance curve, smaller oscillations in calculated water pressure at the measurement positions –, and - and oscillation-free stress states. Intense remeshing takes place during cone advance (Figure 119(b)); despite that the final mesh typically has around 1500 elements. This final number is around one order of magnitude smaller than the number of elements employed by Ceccato et al. [160,161] or Sheng et al. [123]. Note also that the elements are here linear triangles, instead of tetrahedra or 8-noded quadrilaterals.
8.2.1 Smooth interface
Figure 120 illustrates the effect of permeability on the basic cone measurements (net tip resistance, , and excess pore pressures at the three measurement positions). In all cases the soil-cone interface is perfectly smooth. It can be seen that for the highest permeability value employed ( m/s) no excess pore pressure is generated. On the other hand, the differences in excess pore pressure for the two cases with smallest permeability values ( m/s and m/s) are minimal, so undrained conditions may be assumed for the lowest permeability case.
| (m/s) | (kPa) | (kPa) | (kPa) | (kPa) | (kPa) | ||
| 0 | 155.9247 | 149.1725 | 116.8521 | 47.8765 | 0 | ||
| 0 | 157.9149 | 145.3006 | 116.7007 | 50.2512 | 0 | ||
| 0 | 171.913 | 139.035 | 113.8241 | 40.9969 | 0 | ||
| 0 | 188 | 91.9542 | 71.1219 | 21.9292 | 0 | ||
| 0 | 193.4498 | 62.1941 | 46.4524 | 14.5118 | 0 | ||
| 0 | 225.2794 | 14.7636 | 11.6343 | 5.1592 | 0 | ||
| 0 | 228.8778 | 7.7077 | 6.2003 | 2.9622 | 0 | ||
| 0 | 228.4996 | 0.82064 | 0.64933 | 0.30679 | 0 | ||
| 10 | 168.6917 | 147.332 | 113.8916 | 42.6165 | 10.0502 | ||
| 10 | 170.7917 | 147.6641 | 102.8217 | 44.4423 | 9.2191 | ||
| 10 | 198.016 | 139.1674 | 101.2809 | 38.8121 | 9.2646 | ||
| 10 | 228.9542 | 97.5366 | 65.5577 | 21.9336 | 7.4521 | ||
| 10 | 306.4265 | 7.9372 | 5.7246 | 2.9266 | 8.6699 | ||
| 10 | 311.473 | 0.77502 | 0.60076 | 0.33279 | 8.8945 | ||
| 20 | 178.4367 | 156.3127 | 111.0797 | 29.9754 | 19.8684 | ||
| 20 | 175.4394 | 150.6554 | 86.8759 | 42.9122 | 16.8615 | ||
| 20 | 206.5035 | 151.232 | 86.4064 | 32.8562 | 17.6686 | ||
| 20 | 257.1764 | 115.4293 | 65.527 | 21.3735 | 17.351 | ||
| 20 | 371.8288 | 7.8541 | 5.2757 | 3.6126 | 18.7267 | ||
| 20 | 381.3202 | 0.77079 | 0.56783 | 0.40083 | 17.2323 | ||
| 25 | 183.2952 | 164.3057 | 97.4744 | 24.6536 | 23.5184 | ||
| 25 | 179.5185 | 152.5107 | 88.0873 | 41.5211 | 20.9896 | ||
| 25 | 209.2947 | 154.2808 | 90.8293 | 34.1315 | 22.132 | ||
| 25 | 285.1025 | 115.1756 | 57.3074 | 19.052 | 20.6526 | ||
| 0 | 155.6966 | 143.756 | 119.2333 | 48.1898 | 0 | KC | |
| 0 | 156.2766 | 143.425 | 117.6437 | 48.9185 | 0 | KC | |
| 0 | 169.4471 | 138.6766 | 113.7669 | 39.7625 | 0 | KC | |
| 0 | 188.3175 | 67.2227 | 50.8361 | 15.4146 | 0 | KC | |
| 0 | 226.4429 | 17.4712 | 12.7023 | 5.2592 | 0 | KC | |
| 0 | 228.1561 | 10.1927 | 7.3989 | 3.37716 | 0 | KC | |
| 0 | 202.9519 | 187.117 | 159.6566 | 78.3909 | 0 | ||
| 10 | 217.5789 | 190.543 | 158.2499 | 74.4757 | 10.2402 | ||
| 20 | 230.8114 | 196.6498 | 145.136 | 50.7546 | 20.8606 | ||
| 25 | 234.6475 | 204.8765 | 145.2138 | 62.5176 | 24.2347 |
The profiles in Figure 120 have been filtered using a mobile average of window width ( for ). This smoothens numerical oscillations due to remeshing at the soil-cone interface. This filtering is very effective for the pore pressures -where the remeshing induced error is just due to a slightly variable sampling position in areas of high pressure gradients. It is somewhat less effective for the tip resistance in the stronger soils, as the remeshing induced error for that variable is mostly due to jumps in equilibrium conditions. In Table 18 the mean values at steady state (i.e. computed averaging between ) are reported. Excess pore pressure at the position lies between 75% and 80% of that measured at the position, in good agreement with typical observations in soft low OCR soils [162].
Undrained penetration requires less force than drained penetration. This is a well-known result that can be explored further examining, for drained and undrained conditions, total and effective stress profiles alongside the cone (Figure 121). Vertical equilibrium at the tip identifies the main cause of increased tip resistance: in drained conditions much larger tangential stress is mobilized at the tip interface (). On the other hand, total vertical stress in that zone appears not much affected by drainage. A more distant cause can be found in the effective stress levels below and around the cone tip (say for ). Pore pressure increases result in much smaller effective stress normal components for the undrained case; consequently mobilized strength and stiffness in that zone will be much reduced.
Following proposals by [163] it has become customary to assess the influence of permeability on cone penetration results using normalized plots. In Figure 122 two such plots are provided, comparing the outputs of the GPFEM simulations and equivalent results obtained with ALE [123] or MPM [160,161]. The horizontal axis for both plots is the normalized velocity, defined as
|
|
(8.2) |
where represents penetration velocity, cone diameter and is the in situ coefficient of consolidation. That in situ is used only for data normalization purposes; consolidation around the cone may be governed by different values [164] a discussion of which is outside the scope of this work. The vertical axis in Figure 122(a) () shows net cone tip resistance normalized by the value at the undrained limit, whereas in Figure 122(b) it shows the excess pore pressure at position , also normalized by the value at the undrained limit.
Overall, the results in Figure 122 show good agreement between the different numerical approaches. The normalized velocity transition range that appears (roughly from 0.03 to 100) fits well with that noted by [165] summarizing previous experimental and numerical research on soft contractive soils. Comparing with that work, it does also appear that the numerically obtained upper bound of the normalized net tip resistance ratio () is somewhat low (around 1.5 here instead of 2.5 on average for [165]). A large part of that discrepancy may be due to interface friction.
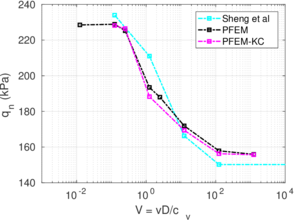
|
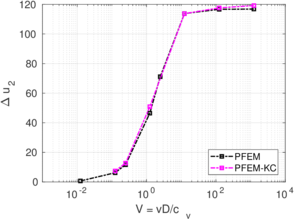
|
| (a) | (b) |
| Figure 123: Cone penetration, influence of the Kozeny-Carman model on net cone resistance, (a), and excess water pressure at the position, (b). Smooth interface. | |
8.2.2 Kozeny-Carman model
Not only constant permeabilities have been considered in this work; to enhance the analysis, some of the cases have been recomputed using the more sophisticated Kozeny-Carman law [65], presented in Equation 2.94. This model introduces a dependency on the permeability due to the variation of the void ratio.
The considered cases are those in partially drained conditions; in these cases volumetric strains are significant (in opposition to undrained conditions) and the value of the permeability plays a crucial role (in contrast to practically drained conditions).
Figure 123 presents the net cone resistance and excess water pressure at steady state using the Kozeny-Carman law; for comparison reasons, the results obtained with a constant permeability are also presented in addition to those from [123]. Results are depicted in terms of the normalized penetration velocity, Equation 8.2, for which the in situ coefficient of consolidation is used (i.e. using the initial value of the permeability).
The effect of a non-constant permeability is limited: the excess water pressure at the position slightly increases, particularly in the more drained simulation, whereas the net cone resistance slightly decreases in comparison with the constant permeability cases.
The stresses and strains developed in the soil mass are not heavily influenced by the constitutive model employed to describe the evolution of the permeability tensor.
8.2.3 Interface friction
The precedent CPTu analyses have been repeated using friction angles at the cone-soil interface, , of 10, 20 and 25 corresponding to interface friction ratios, , between 0 and 0.47. Also, if we consider that the soil friction angle, , is 25.4, the values explored correspond to interface efficiencies, , between 0 and 0.98.
Figure 124 shows the effect of this parameter for the main test results for the extreme conditions of permeability (corresponding to fully drained or undrained penetration). When cone penetration is undrained interface friction appears to have a relatively small effect on either tip resistance or pore pressure increase. When cone penetration is drained the tip resistance does increase quite significantly as friction increases.
The effect of interface friction on some aspects of the penetration mechanism is illustrated in Figure 125. One obvious difference is that friction results in significant settlement next to the cone at the upper surface. Also induced radial and vertical stress around the cone tip are significantly affected by interface friction: larger friction values increases the size of the stress bulb in front of the cone tip, which also exhibits a more vertical orientation.
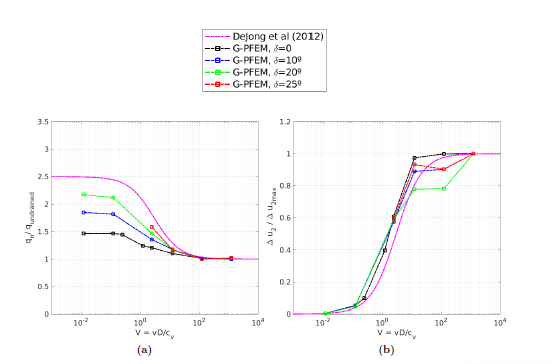
| |
| Figure 126: Effect of interface friction angle on the backbone curves for CPTu in Modified Cam Clay: cone tip resistance, (a), and excess pore pressure at the position, (b). | |
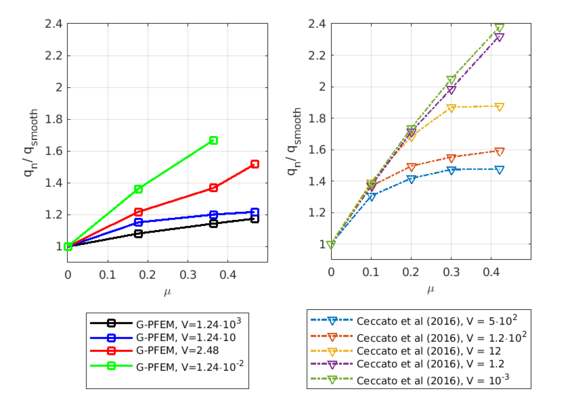
|
| Figure 127: Effect of interface friction on net tip resistance increase for different normalized velocities. |
A more systematic view is presented in Figure 126, showing the effect of interface friction on the relation between normalized test velocity and normalized test results. The average summary curves proposed by [165] are also included as reference. These curves may be expressed as:
|
|
(8.3) |
|
|
(8.4) |
where and are the values of the net cone resistance and excess water pressure at the position during undrained penetration whereas and are two parameters: the former stands for the normalized velocity corresponding to the penetration velocity at which one-half of excess pore pressure for undrained penetration is mobilized wheres the latter is the maximum rate of change of the curves in terms of the normalized velocity. Typical values of these parameters are , and [165].
Interface friction seems to have a moderate effect on pore pressure, (the somewhat erratic influence of friction at the undrained end is likely due to numerical noise). Again, the effect on normalized resistance increases as the penetration rate gets closer to drained conditions. For the upper values of interface friction the backbone curves become significantly steeper and get closer to the average reported by [165].
The effect of relative stiffness also plays a role here. [158] show that higher normalized elastic stiffness () results in an increased drained tip resistance and the backbone curve becomes steeper. The same happens when relative plastic stiffness () decreases [158,123]. In the GPFEM analyses presented here, the values of those parameters are kept constant at a relatively low level (; ). A more systematic analysis of this effect is beyond the scope of this work.
Similar effects have been reported by Ceccato et al. [160,161], although the pattern of net tip resistance increase with interface friction is somewhat different to that found here (Figure 127), with stronger effects of small friction for fast penetration. The differences in the contact algorithm employed may explain this discrepancy.
Finally, as shown in Figure 124(c), the mobilized stress at the friction sleeve, , increases linearly with interface friction, and has a value that is practically independent of drainage conditions. This result may be related to the repeated field observation of poor repeatability on CPTu friction sleeve readings [166]. Although other aspects of friction sleeve design may be involved, Lunne and Andersen [167] already pointed out at sleeve roughness as a possible contributing factor. The numerical results support that idea: poorly controlled sleeve roughness will result in significant variance on interface friction and, therefore, on .
8.2.4 Lateral earth pressure coefficient
Much has been said about the coefficient of lateral earth pressure, . Specifically in clays, this coefficient is generally believed to be a consequence of soil constitutive parameters and the stress history. Jáki [168] linked the coefficient of lateral earth pressure in normally consolidated conditions to the soil friction angle. Afterwards, several expressions for overconsolidated cases have been proposed based on laboratory data and in situ tests [169,170].
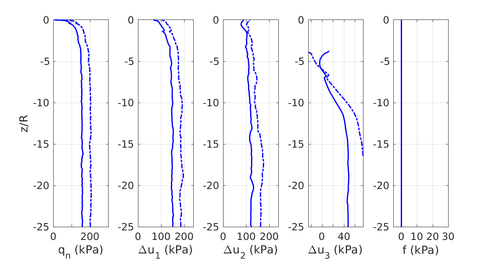
|
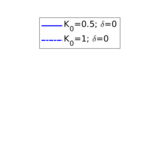
|
| (a) | (b) |
| Figure 128: Cone penetration test. Penetration curves. Influence of the coefficient of lateral earth pressure on practically undrained conditions. Smooth interface. | |
In order to assess the effect of the ratio between the horizontal and vertical stress, some of the cases have been recomputed with a coefficient of lateral earth pressure of in contrast to the one used in the previous analyses, . As such, these simulations differ from the previously presented ones only in the value of the initial horizontal stresses (radial and circumferential). As a consequence of this, the value of the initial effective pressure is also different and the initial value of the bulk and shear moduli are higher, as the initial coefficient of consolidation (for the same permeability).
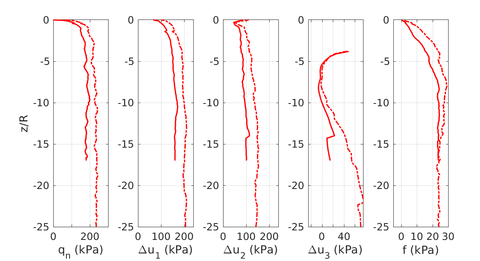
|
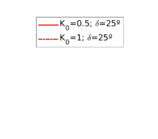
|
| (a) | (b) |
| Figure 129: Cone penetration test. Penetration curves. Influence of the coefficient of lateral earth pressure on practically undrained conditions. Rough interface (). | |
Figure 128 depicts the penetration curves for practically undrained conditions ( m/s) assuming a smooth interface for both values of the coefficient of lateral earth pressure. As this coefficient increases, the net cone resistance and the water pressure at the three measurement positions also increase.
The same results but assuming a completely rough interface are reported in Figure 129. As in the previous case, larger net cone resistance and excess water pressure are obtained by increasing the initial effective horizontal stresses. Surprisingly, in these two simulations the friction sleeve resistance seems to converge at the steady state. This result seems counterintuitive since the initial value of the horizontal stress is different on both cases and the radial stress is linked to the maximum contact tangential stress with a Coulomb friction model.
To further investigate this result, Figure 130 compares the effective and total stress state alongside the cone for two simulations with the same roughness and different initial horizontal stress. In the soil mass in the vicinity of the cone (say ) exactly the same effective stress profiles are found irrespectively the initial horizontal stress; including the tangential component , that is the one in equilibrium with the tangential contact stress along the shaft of the cone. Meanwhile, the water pressure follows the same trend in both simulations; however larger excess pore pressures are found in the case with higher . The profiles of total stress are a consequence of the former two observations: near the cone, larger total stresses are found as a consequence of the larger excess water pressure (Figure 130).
The influence of friction and the coefficient of lateral earth pressure in practically undrained conditions on the measured reactions of the CPTu is depicted in Figure 131. Larger net cone resistance and excess water pressure at the three measurements positions are encountered by using a larger ; in terms of the roughness, the cone resistance and water pressure at the position increase linearly with the interface friction ratio, , whereas the rest of water pressure measurements decrease linearly with the interface friction ratio. These four reactions follow the same trend irrespectively of the initial horizontal stress. On the contrary, the friction sleeve resistance is completely independent of the coefficient of lateral earth pressure and increases linearly with the interface friction ratio, .
This analysis reveals that, at least for the considered case, the effective stress profiles in the vicinity of the cone -using the same constitutive parameters- is independent of the value of the horizontal stress considered. On the other hand, the developed excess water pressure is influenced by the value of the coefficient of lateral earth pressure: using a larger , the value of the excess water pressure is larger.
It should be stressed that the simulations with only differ from those with in the value of the initial horizontal stress: the same values for the initial preconsolidation pressure, , or void ratio, , is considered in both sets of simulations. In the Cam Clay model, these variables are not truly independent.
8.2.5 Representation of the numerical results in interpretation charts
One of the major applications of CPT and CPTu is the determination of soil stratigraphy and the identification of soil type [122]. This is accomplished using charts that link cone parameters (net tip resistance, friction sleeve, water pressure,...) to soil behavior type.
Robertson [171] developed a soil behavior type method based on the following dimensionless metrics: the normalized cone tip resistance, the normalized water pressure and the normalized friction ratio:
|
|
(8.5) |
![CPTu interpretation charts developed by [171]. [172].](/wd/images/thumb/7/7d/Draft_Content_325409517-monograph-Robertson-1.png/420px-Draft_Content_325409517-monograph-Robertson-1.png)
|
| Figure 132: CPTu interpretation charts developed by [171]. [172]. |
The two soil behavior charts developed by [171] are presented in Figure 132. In the interpretation chart, clayey materials are believed to have a low normalized tip resistance and high normalized friction ratios whereas sand materials show the opposite behavior: high normalized tip resistances and low normalized friction ratios. As depicted in Figure 132(a), over-consolidated soils tends to have larger normalized tip resistance and sleeve friction ratio.
Meanwhile, in the , sand soils develop very limited water pressure whereas clayey materials are characterized by high normalized water pressures. This is because, at the standard penetration rate (0.02 m/s), most sands exhibit drained conditions whereas completely undrained conditions typically prevail in clayey materials. With respect to normally consolidated clays, Robertson [122] characterized over-consolidated clays with lower normalized water pressures and higher normalized tip resistances (Figure 132(b)).
Generally, the most popular chart used for onshore CPTu interpretation is the . Due to technological issues, it is believed that the pore pressure has a lack of repeatability due to a poor saturation or a loss of saturation of the filter in most onshore situations since the cone is often required to penetrate several meters through unsaturated soil before reaching saturated conditions [172]. A similar effect is found when the cone is pushed through saturated dense silty sand or stiff over-consolidated clay, where the measured water pressure can become negative due to the dilative nature of the soil, resulting in air bubbles coming out of solution [173]. Interestingly, it has also been claimed that the friction sleeve resistance measurements may also lack of repeatability [162,166,174,175,176]
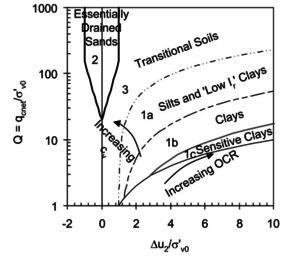
|
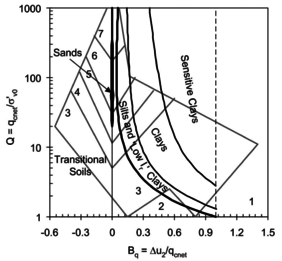
|
| (a) | (b) |
| Figure 133: CPTu interpretation chart developed by [177], (a), and comparison with [171], (b). [177]. | |
Schneider et al. [177] claimed that much interpretation charts are unable to separate the effect of partial consolidation from the yield stress ration. This is because both factors tend to increase the normalized cone tip resistance, , and decrease the normalized pore pressure, ; thus, showing the same tendency in the classical interpretation chart. To this end, the authors developed new and charts, that are presented in Figure 133. The figure also incorporates a comparison with the chart proposed by [171]. These new interpretation charts define a much limited number of soil behavior types.
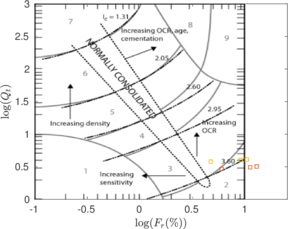
|
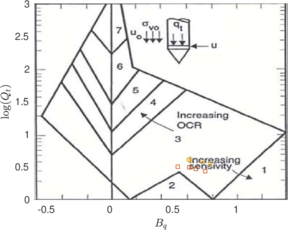
|
| (a) | (b) |
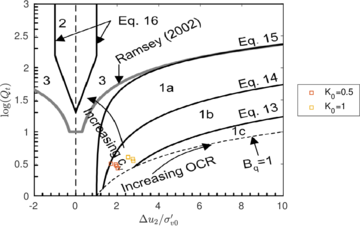
| |
| (c) | |
| Figure 134: Cone penetration test. Representation of the numerical results in the and interpretation charts of [171], (a) and (b), and the of [177], (c), for the set of simulations that explored the effect of and contact roughness in practically undrained conditions. | |
Assessment of the interpretation charts
Figure 134 depicts some of the numerical results in the previously introduced interpretation charts. In particular, the figure presents the set of data obtained in practically undrained conditions with two different coefficients of lateral earth pressure ( and ) for an identical material using different contact friction angles.
In the plot, results for the lowest interface friction () plot near the zone 3 (clays-clay to silty clay), particularly close to the region of low OCR and the region with low constrained modulus (see [122,178] and Equation 9.5). As friction increases, results tend to zone 2 (organic soils-peats), following an almost horizontal trend. Following [122], this horizontal trend in the chart corresponds to the same interpreted constrained modulus. As the input value of the interface friction increases, results tend to plot in regions that might be interpreted as higher OCR. With a higher value, points appear a little shifted vertically and to the left due to a higher cone resistance and almost identical friction sleeve resistance (see Figure 131).
Figure 134(b) depicts the results in the chart. All points lay in zone 3 (clays-clay to silty clay), nearer the region of sensitive clays. As contact roughness increase, it also does the normalized tip resistance whereas the normalized water pressure decreases; as such, points move apart from the region of sensitive clays and tend to move to the region of low OCR clays.
In the chart developed by [177], all the results plot in the zone of clays, particularly those with a low over-consolidation ratio (the input OCR is 1.2) with a low coefficient of consolidation (in fact, penetration take place in practically undrained conditions). An increase in the contact roughness is interpreted as a slight increase on the coefficient of consolidation whereas a larger appears as an increase of the OCR.
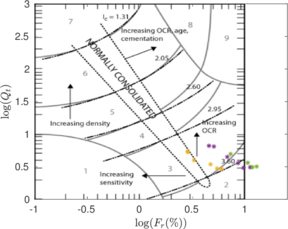
|
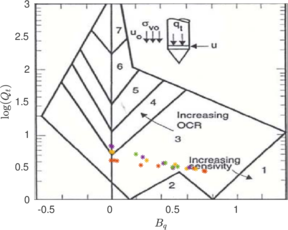
|
| (a) | (b) |
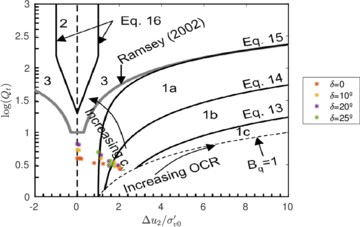
| |
| (c) | |
| Figure 135: Cone penetration test. Representation of the numerical results in the and interpretation charts of [171], (a) and (b), and the of [177], (c), for the set of simulations that explored the effect of soil permeability and contact roughness. | |
The results for different permeabilities (ranging from practically undrained conditions to drained conditions) and assuming different contact friction angles are depicted in Figure 135.
In the plot, as permeability increase results tend to regions of slightly lower OCR and higher interpreted constrained modulus; results with higher interface friction angle plot in regions with higher interpreted OCR. Meanwhile, in the the points have a trajectory that might be interpreted as an increase of the OCR; in practically drained conditions, the numerical simulations tend to zone 4 (silt mixtures clayey silt to silty clay); obviously, the numerical results obtained in practically drained conditions strictly plot in the line . It must be pointed out that these interpretation charts are proposed to interpret a common clay, that typically behaves in undrained conditions at the standard cone velocity (0.02 m/s).
The numerical results in partially drained conditions agree well with the chart developed by [177]: results follow the predicted trend of increasing coefficient of consolidation. As larger permeabilities are considered, numerical results move from clays, to slits and low rigidity index clays to transitional soils in practically drained conditions.
8.3 Concluding remarks
This chapter has illustrated the capabilities of the developed PFEM scheme to tackle large deformation problems often encountered in geotechnical problems that involve the partially drained insertion of rigid bodies into the soil.
The performance of the method has been examined by reference to two cases of application. The first involved the loading and consolidation of a poroelastic soil under a circular footing. The effect of mesh discretization and of the use of the stabilized formulation has been assessed. In addition, the results have shown a good correspondence with those obtained using alternative numerical formulations.
The second case addressed the more challenging case of the insertion of a cone simulating the conditions of a CPTu test. It has been shown that the proposed method is able to perform the numerical analysis efficiently even when significant contact friction angles were involved. Cone resistance, sleeve friction and pore pressures at three potential measurements points were obtained. The results spanned the full range -from drained to undrained conditions- and the effect of the contact friction has been explored throughout.
9 Permeability estimates from CPTu
This chapter discusses a series of simulations of the CPTu test installation and subsequent dissipation in soils represented by the Modified Cam Clay model. Simulation outputs obtained for different input constitutive parameters and permeabilities are examined to obtain direct estimates of permeability using different methods proposed in the literature; additionally, methods to estimate the hydraulic conductivity during the piezocone penetration are also used. These on-the-fly methods have a number of adjustment parameters, whose meaning is not well understood; to clarify its significance, these methods are linked to the backbone curve describing the variation of cone metrics in partially drained conditions by [165]. Finally, the permeability estimates are then compared with the known input permeability value to assess the reliability of the interpretation techniques.
9.1 Introduction
Traditionally, the evaluation of coefficients of consolidation of fine grained soils has been of much interest for geotechnical design. CPTu based methods for obtaining consolidation coefficients were researched intensively almost since the instrument became available [179,180,134]. The operational procedure requires a dissipation test: the cone is halted and the variation in time of water pressure is measured. The interpretation of dissipation tests frequently needs other constitutive parameters that also require approximation.
A coefficient of consolidation combines unit weight, permeability and soil stiffness. Because soil stiffness is dependent, amongst other variables, on stress level, strain level and loading path relating coefficients of consolidation obtained from CPTu dissipation curves with those controlling behavior in a given geotechnical problem is not always easy.
When, as it is increasingly frequent, numerical methods are used to study consolidation problems models typically require separate inputs for stiffness and permeability. Consolidation coefficients may be then bypassed and the designer will be more interested in permeability, a parameter that has also direct application in other geotechnical problems (dewatering, drainage design, hydraulic heave, etc...). It is therefore increasingly necessary to evaluate permeability from CPTu records.
In this chapter, the current available procedures to evaluate permeability form CPTu results are assessed using results from numerical simulations of piezocone penetration and dissipation. The chapter is organized as follows: after introducing some of the methods commonly used to interpret permeability from CPTu tests, the results of the numerical simulation are presented. After linking the on-the-fly interpretation technique to the backbone curve of [165], interpretation methods are assessed against the numerical simulations. Finally, some conclusions are drawn.
9.2 Estimating permeability with CPTu
9.2.1 Methods based on dissipation results
Several methods have been proposed to estimate permeability from piezocone records. Most of them require a dissipation test and relate the time to half dissipation, , to permeability, .
Parez and Fauriel [181] presented data supporting an empirical relation between these two parameters. The relation was presented in graphic form; [182] approximated it by:
|
|
(9.1) |
where is expressed in seconds and is a laboratory measured coefficient of horizontal permeability, expressed in cm/s. Robertson et al. [183] presented another graphical empirical relationship between the same variables, showing larger scatter.
Nevertheless, dissipation tests are most frequently interpreted by means of normalized dissipation curves proposed by Teh and Houlsby [134]. These curves link measured dissipation time to a consolidation coefficient, . For instance, for measurements taken at the cone shoulder, a frequently used formula is:
|
|
(9.2) |
where is the cone tip radius, is the water unit weight, is a rigidity index and is a constrained modulus. The rigidity index is defined as , the ratio between a shear modulus, , and an undrained shear strength, . Obtaining appropriate values for and is not always easy [184]. When a value of permeability, , is necessary, an estimate of constrained modulus, , is also required, which compounds the difficulties.
Robertson [178] presented a formula that, based on results by [134], summarized the relationship between coefficient of horizontal consolidation, , and as follows:
|
|
(9.3) |
where has units of minutes and of m/s. Horizontal permeability is then obtained as:
|
|
(9.4) |
Robertson [178] proposed to estimate from CPT results:
|
|
(9.5) |
where is the normalized net tip resistance, that, for fine grained soils, is given by:
|
|
(9.6) |
9.2.2 On-the-fly methods
Several interpretation techniques have been proposed to interpret the soil permeability based on CPTu metrics during penetration [185,186,187,188]. These methods do not require a dissipation phase, as permeability is estimated directly from the product ; that is, the normalized tip resistance, , and normalized excess pore pressure, , defined as:
|
|
(9.7) |
It should be noted that although the product of metrics encompasses information of the excess water pressure at the position, the net cone resistance and the interpreted in situ vertical effective stress, this product simplifies to the excess water pressure at the position divided by the in situ vertical effective stress:
|
|
(9.8) |
Elsworth and Lee [185] method
Elsworth and Lee [185], generalizing a previous work by Elsworth [189], analyzed the flow induced by a finite size penetrometer as a moving steady state flow problem. Combining dislocation and cavity expansion analysis and assuming negligible local storage they used continuity and Darcy's law to obtain the following relation:
|
|
(9.9) |
The symbol represents a dimensionless ratio. Elsworth and Lee [185] noted that the relation obtained could be expressed using only conventional normalized CPTu metrics as:
|
|
(9.10) |
The formulation allows on-the-fly estimation of permeability from the CPTu record, without any stoppage. The analysis leading to Equation 9.9 could not distinguish between different pore pressure measurement positions at the cone tip. For practical reasons, later development of the method has always been based on measurements just above the shoulder, at the so-called position.
Subsequent works
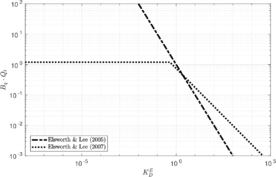
|
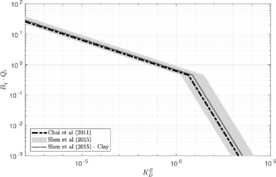
|
| (a) | (b) |
| Figure 136: Permeability estimation on the fly. Interpretation charts proposed by [185,186], (a), and [187,188], (b). | |
Elsworth and Lee [185] method assumed no storage of water around the penetrating cone. This implies that the method is not applicable in highly dilatant materials. Experimental work by [190] with overconsolidated clay has confirmed this limitation.
There is less consensus about the requirement of partial drainage. According to [186], the method should not be applied below a certain undrained limit. Using classical results from spherical cavity expansion analysis and setting Skempton pore pressure coefficient they arrived at the following expression for the undrained limit:
|
|
(9.11) |
where corresponds to the pore pressure developed under fully undrained conditions. For typical values of the rigidity index, , and the undrained strength ratio, , they argued that the limit value would vary between 1.2 and 5.6.
Elsworth and Lee [186] went on to analyze the performance of the method, comparing CPTu results with values derived from laboratory measurements. From this comparison a generalized form of the original proposal followed, which can be expressed as:
|
|
(9.12) |
where and are empirical coefficients introduced to obtain a good fit with the supporting database. The values proposed (see Table 19) were and .
| Reference | Range of applicaton | ||
| [185] | - | 1 | 1 |
| [186] | 0.62 | 1.6 | |
| 0 | |||
| [187] | 2 | 1 | |
| 0.088 | 4.91 | ||
| [188] | 0.8 - 3.74 | 1 | |
| (Clay) | 0.035 - 0.16 | 4.91 |
Chai et al. [187] revisited the method, introduced some modifications in the geometrical assumptions used to derive the basic formula, and examined its performance extending the original dataset. They rejected the idea of an undrained limit, arguing that even for highly impermeable materials some flow does take place. Although they used slightly different definitions, their proposal can be rearranged in the form of Equation 9.12, using a piece-wise formulation with two different expressions having non-overlapping ranges of application (see Table 19).
Shen et al. [188] maintained the full range of application proposed by [187]. They reexamined again the geometrical assumptions of the derivation, to introduce a more realistic representation of the cone tip. They also introduced some soil-type influence on the assumed excess pore pressure moving steady-state distribution around the tip. All this resulted in a slightly modified formulation that, for the case of the standard cone tip angle () may be again recast in the form of a piece-wise Equation 9.12 with parameters that now depend somewhat on soil type (Table 19).
These interpretation charts are presented in Figure 136; Table 19 reports the fitting parameters of Equation 9.12.
9.3 Numerical results
This section is devoted to present the numerical results of the dissipation phase, in particular the dissipation curves. Two different sets of numerical simulations of penetration and dissipation analysis of the CPTu are used; both sets are obtained through PFEM. The first set of results correspond to the dissipation phase of the analyses presented in the previous chapter: as such, these simulations cover the effect of partially drained penetration and contact roughness (Series B). On the other hand, the second set of data was obtained by [191], that conducted a parametric analysis using PFEM of most of the Modified Cam Clay parameters on the dissipation of the CPTu; due to the low permeabilities employed, all the penetrations took place in practically undrained conditions (Series A).
9.3.1 Dissipation curves. Effect of partially drained conditions and contact roughness
This section is devoted to present the dissipation curves of the set of simulations presented in the previous chapter (Series B).
Figure 137 depicts the dissipation curves at the and position for the simulation in which penetration occurs at practically undrained conditions ( m/s) using a smooth interface. The only difference between both curves is the amount of penetration before the dissipation test: in one of them the penetration is whereas in the other is ; in both cases the cone has reached a steady state (see Figure 120). The first thing to notice is that the initial value of the water pressure is different in each curve; for instance, the initial excess water pressure at the position is 123 kPa in one curve and 137 kPa in the other, whereas the steady state value during penetration is 117 kPa. The reason beneath this variation is numerical: pore pressure is only available at nodes, continuous remeshing results in slight variations in the relative node position with respect to the cone shoulder. This means that the record of dissipation, always interpolated from the nodes closest to the position, corresponds to slightly different positions in different meshes. In the position the variation is less pronounced: the water pressure profile is much more continuous in the mid-face of the cone. Importantly, all the curves converge to the same one after a normalized dissipation of less than 5 % To overcome this problem, the reference value for dissipation curves is taken as the steady-state value for the penetration phase, . Then, the time to half dissipation, , corresponds to the time in which the dissipation curve reaches half .
Figures 138(a) and (b) present the dissipation curves at the and position for some of the smooth cases with a . As already seen in the previous chapter, the case m/s corresponds to practically undrained conditions; for a permeability of m/s the developed water pressure at the position is approximately 95% of that obtained in undrained conditions; finally, for the case m/s, the excess water pressure is 40% that corresponding to practically undrained conditions. All the curves show a monotonic decrease at both observation positions, and . Of course, for a permeability of m/s partially drained conditions prevail during the penetration phase, the initial water pressure is much lower and dissipation takes place at a much faster rate.
Figures 138(c) and (d) depict the normalized dissipation curves where the excess water pressure has been normalized by the mean value during steady state penetration, ; additionally, for comparison purposes the curve proposed by [134] is also shown and time has been normalized according to the formula proposed by [134]:
|
|
(9.13) |
It should be noted that this interpretation technique was proposed to interpret the consolidation after a penetration in practically undrained conditions [134]. As such, it seems strange to introduce the rigidity index to analyze results in the partially-drained range. Again, the initial constitutive parameters are used; these parameters are approximated as follows: the undrained shear strength, , using the formula proposed by [192] for -consolidated undrained triaxial (as shown in Appendix B due to the hyperelastic model this formula does not hold but it has been demonstrated that it is approximate enough), , see Equation 3.74, whereas the constrained modulus is .
For these three simulations, all the constitutive parameters that are used to normalize the time are the equal, with the exception of the coefficient of consolidation, that is proportional to the permeability.
Results of the two most undrained cases are almost indistinguishable once time and water pressure are normalized (Figure 138(c) and (d)). The water pressure at the position is the water pressure measurement point most susceptible to numerical related oscillations since it lays in a region with high water pressure gradients; however, results suggest that the overall dissipation process is not affected by these oscillations: both curves converge after the normalized excess pore pressure passes below 0.95. The two most undrained cases show dissipation curves that resemble that predicted by [134]: specifically the same shape is observed in the position whereas these curves are almost indistinguishable from that of [134] for normalized water pressures of . The shape of the dissipation curve for the most drained case ( m/s) is different: in the position a slower rate of dissipation is found for normalized water pressures ; in the position the slope of the curve is less pronounced.
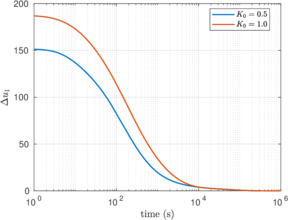
|
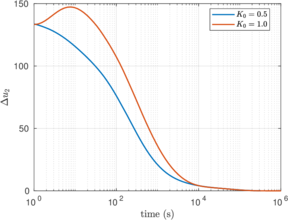
|
| (a) | (b) |
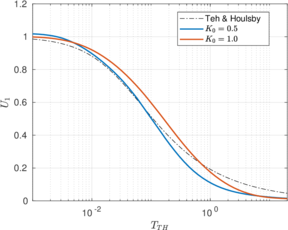
|
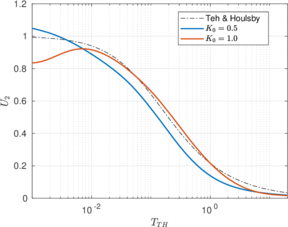
|
| (c) | (d) |
| Figure 139: CPTu dissipation. Effect of the coefficient of at rest of lateral earth pressure. Dissipation curves at the position, (a), and position, (b), assuming a smooth interface. | |
To further the analysis, Figure 139 compares the dissipation curve for both practically undrained penetrations ( m/s) using a smooth interface for two different values the initial horizontal in situ effective stress. With a higher in situ effective stress, dissipation takes place in a slower rate; for instance, the is almost doubled (see Table 20). Additionally, in the normalized plot, Figures 139(c) and (d), it seems that the case with dissipates at a higher rate since the oedeometric modulus used to normalize the results is higher. In the position, it seems that the dissipation curve shows the so-called dilatation type; however, this effect is because at the beginning of the dissipation the water pressure is slightly below the mean value during penetration.
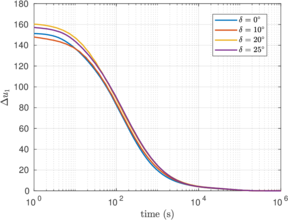
|
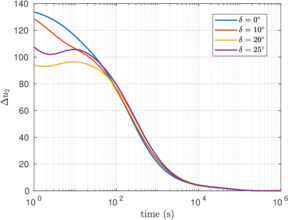
|
| (a) | (b) |
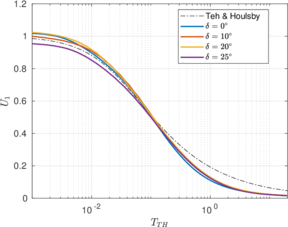
|
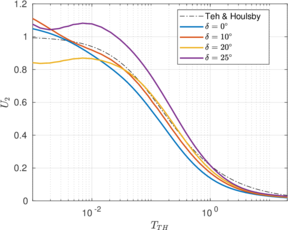
|
| (c) | (d) |
| Figure 140: CPTu dissipation. Effect of interface friction angle. and (m/s). Dissipation curves at the position, (a), and position, (b). | |
The effect of contact roughness on the dissipation curves is shown in Figure 140: particularly in the position, the raw results seems to converge after the first stages of dissipation (approximately 5 seconds). However, this is an effect of the scale of the figure; consistently, the dissipation rate is slower as the contact friction angle increases. Once the normalization procedure detailed above is applied, it is more obvious that the dissipation rate decreases as the contact friction angle increases. This result is also a consequence of the employed normalization method: on the one hand, time is normalized according to the normalized time proposed by [134] and the same parameters are used for the four simulations, on the other hand water pressure is normalized with the steady state value during penetration, that, in the position, slightly decreases with the contact friction angle.
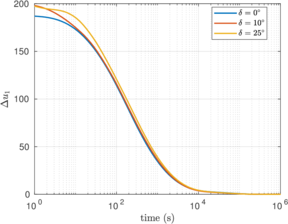
|
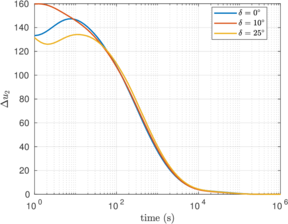
|
| (a) | (b) |
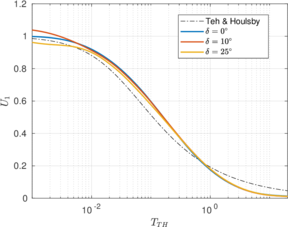
|
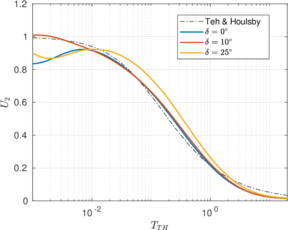
|
| (c) | (d) |
| Figure 141: CPTu dissipation. Effect of interface friction angle. and (m/s). Dissipation curves at the position, (a), and position, (b). | |
Finally, Figure 141 presents the dissipation curves, for different friction angles, with , showing the same behavior than the previous case: as higher contact friction angles are used, dissipation takes place in a significant slower rate. Once results are presented in a normalized fashion, the disparity between the curves increase.
Table 20 presents all the normalized half time of dissipations, , corresponding to the cases analyzed in this section.
| (m/s) | () | (s) | |
| 0 | 0.5 | 165.2878 | |
| 0 | 0.5 | 1.5309 | |
| 0 | 0.5 | 0.16575 | |
| 10 | 0.5 | 216.7262 | |
| 20 | 0.5 | 263.7334 | |
| 25 | 0.5 | 354.36 | |
| 0 | 1 | 247.6717 | |
| 10 | 1 | 261.9875 | |
| 25 | 1 | 362.6001 |
9.3.2 Dissipation curves. Penetration in practically undrained conditions
| OCR | ||||||||
| (kPa) | (kPa) | (m/s) | ||||||
| 1.94 | 0.02 | 0.2 | 1.07 | 110 | 1.1 | 0 | 10000 |
The results presented in this section correspond to a set of simulations in which the permeability is varied five orders of magnitude (from m/s to m/s) (that is, Series A). For that range of permeability the penetration phase takes place in practically undrained conditions. The normalized cone velocity [193] for the simulation with the highest permeability is . Permeability is assumed isotropic.
The material properties are depicted in Table 21. A similar geometry than the previous chapter has been used, however, in this case the self-weight has been considered and at the top of the boundary a load of 100 kPa is imposed. Penetration at the standard rate is simulated to a depth of . After stopping penetration a dissipation test is simulated.
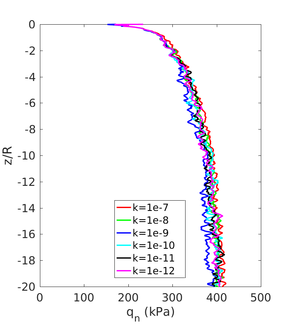
|
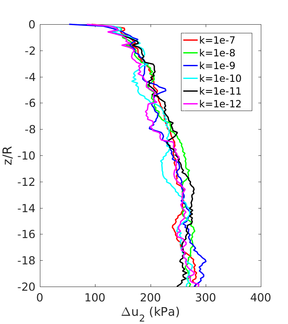
|
| (a) | (b) |
| Figure 142: Penetration curves in almost undrained conditions. Net cone resistance, (a), and excess water pressure at the position, (b). | |
Figure 142 presents the penetration curves. Because of the continuous remeshing that is characteristic of the PFEM approach numerically induced oscillations appear on the penetration curves. These have been smoothed in the penetration curves using a moving average over a distance of .
The results show that, within this undrained range, tip resistance and pore pressure show little sensitivity to permeability. Indeed differences in net cone resistance at steady state between simulations are within a range of 6% For all cases volumetric deformation was minimal, thus confirming the expected undrained behaviour.
| k | |||
| (m/s) | (s) | ||
| 3.86 | 0.64 | ||
| 3.79 | 0.65 | ||
| 3.61 | 0.61 | ||
| 3.77 | 0.58 | ||
| 3.75 | 0.63 | ||
| 3.77 | 0.63 |
Table 22 presents the main results of the tests for the 6 different simulations. In particular, the table shows the normalized tip resistance and pore water pressure ratio, and respectively. To filter out remeshing induced noise the steady state values for each test are obtained as the average value for depths between 10 and 20 penetration radius.
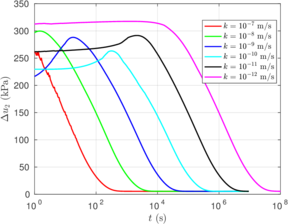
|
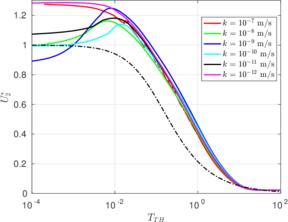
|
| (a) | (b) |
| Figure 143: Dissipation curves, for various values of permeability, after a practically undrained penetration. Results in (b) are normalized. | |
Figure 143(a) depicts the dissipation curves at the position for all the simulated cases. As expected the curves shift to higher times as permeability decreases. The value of the initial excess pore pressure varies significantly (between 220 and 310 kPa). As shown previously, the cause beneath this variation is numerical.
Figure 143(b) shows the dissipation curves where the excess water pressure has been normalized with the steady state value during penetration; additionally, time has been normalized according to the formula proposed by [134], Equation 9.13. It appears that the normalization works well in that all the curves converge after the normalized excess pore pressure passes below 0.95.
9.4 Estimation of permeability during dissipation
9.4.1 Parez and Fauriel method [181]
![Comparison of numerical results with [181] correlation.](/wd/images/thumb/9/9f/Draft_Content_325409517-monograph-Parez.png/534px-Draft_Content_325409517-monograph-Parez.png)
|
| Figure 144: Comparison of numerical results with [181] correlation. |
In Figure 144 the values of are plotted against the input permeability. The figure also includes the correlation proposed by [181] as formulated by [182]. The estimated value of permeability is always within the same factor from the input value. The correlation underestimates somewhat the larger values of permeability and does the opposite for the smaller values. Most permeability values in the database supporting the original correlation were close to cm/s and this is also where the fit with the numerical results appear better.
Two different sets of simulations assess the effect of permeability on the dissipation phase: in one of them penetration is simulated in practically undrained conditions whereas the other explore the effect of partially drained penetration. Specifically, in the former case, numerical results show that the dissipation half time is inversely proportional to the permeability (i.e. the slope of the interpretation curve in Figure 144 should be equal to ); however, the interpretation curve developed by [181] does not show this tendency.
9.4.2 Robertson method [178]
Figure 145 and 146 plots the numerical results in the interpretation chart proposed by [178]. In the two sets where the effect of permeability has been assessed, subfigures (a) and (b), the permeability vs half dissipation plots appear well aligned with the predicted trend, but offset from the theoretical that would be assigned according to their compressibility.
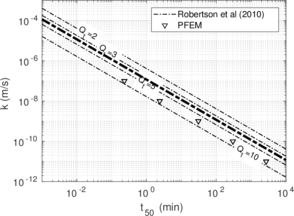
|
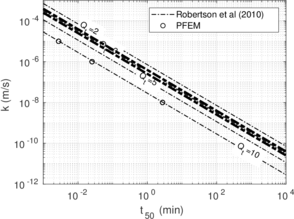
|
| (a) | (b) |
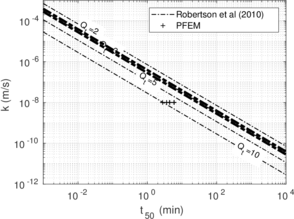
|
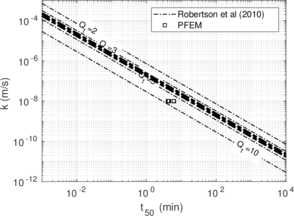
|
| (c) | (d) |
| Figure 145: Numerical results in the interpretation chart proposed by [178]. The constrained modulus is approximated by the CPTu log. The thick line represents the mean normalized tip resistance, (a), and the minimum and maximum value of the normalized tip resistance, (b), (c) and (d). | |
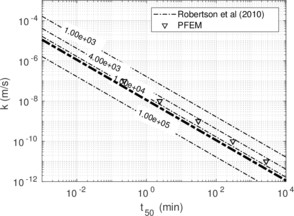
|
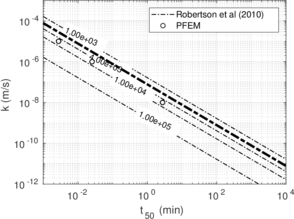
|
| (a) | (b) |
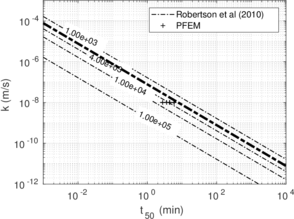
|
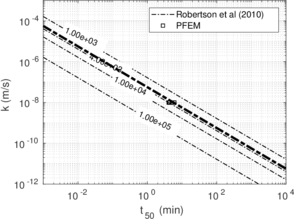
|
| (c) | (d) |
| Figure 146: Numerical results in the interpretation chart proposed by [178]. The constrained modulus is directly an input parameter. The thick line stands for the input parameter of the numerical simulations. | |
In Figure 145, following the suggestion of [178], the constrained modulus is estimated based on CPT penetration steady state values, that is, using Equation 9.5. Meanwhile, in Figure 146, the constrained is directly an input parameter and those corresponding to the Modified Cam Clay input parameters are plotted with a thicker line; again, the modulus at the initial state is used.
In the set of simulations in which the penetration occurred in practically undrained conditions, the average value of for these simulations is 3.8, and thus, according to Equation 9.5, the constrained modulus may be estimated as kPa. It appears that, by using this value, would estimate a permeability value about 4 times larger than the input value (Figure 145(a)). On the contrary, using the soil input value of the constrained modulus, kPa, the correlation would underestimate the input permeability approximately by a factor of 3.
For the set of simulations in which penetration took place in partially drained conditions, Figure 145(b) presents the interpretation line in terms of the minimum and maximum value of the normalized tip resistance (the first one corresponding to practically undrained conditions whereas the other encountered in the most drained case). Although the interpretation technique follows the same trend, permeability is overestimated more than one order of magnitude. Somehow, by using the initial value of the constrained modulus (that is, the numerical model input parameter), the mismatch reduces and the estimate of the method over-estimates the permeability approximately by a factor of 2 (Figure 146(b)).
In order to assess the effect of the interface friction angle, the third set of numerical results encompass the most undrained case of the previous series along with simulations with the same constitutive parameters that only differ on the contact roughness. As already commented, as the interface friction angle increases, it also does the dissipation half-time, , and the normalized cone resistance, . The amount of mismatch decreases as the friction angle increases if the constrained modulus is approximated by the CPTu metrics (Figure 145(c)). For the completely rough case, the estimate of the permeability is 8 times larger than the input value. Meanwhile, the discrepancy is further reduced if the initial value of the constrained modulus obtained from the numerical model input parameters is used: for the most rough case, permeability is only overestimated by a factor of 1.05 (Figure 146).
The fourth set of simulations correspond to those in practically undrained conditions with a in which the effect of the interface friction angle has been assessed. Surprisingly, a perfect match between the numerical results and the technique proposed by [178] is found if the initial compressibility modulus is used (Figure 145(b)). By estimating this modulus by the CPTu records, permeability is overestimated by a factor of 4.
9.5 Estimation of permeability during penetration
In this section, the previously introduced techniques to estimate permeability during cone penetration are assessed against a set of numerical data; to enhance the analysis, other results obtained through numerical simulation available in the literature are also used.
First, these interpretation techniques are linked to the backbone curve describing the change in CPTu induced excess pore pressure in terms of the cone normalized penetration velocity proposed by [165]. This analysis clarifies the meaning of the adjustment parameters of the on-the-fly methods that appear in Equation 9.12, see Table 19.
9.5.1 Relation with the backbone curve of DeJong and Randolph [165]
A more versatile generalization of the original [185] equation, Equation 9.12, may be obtained using a different angle. Partly drained CPTu penetration has received much attention because it may introduce substantial error in conventional CPTu interpretation methods [165]. For given soil parameters and initial state, partly drained penetration results in increased tip resistance and decreased excess pore pressure [163].
The backbone curve model proposed by [165,194] to express the change in the CPTu induced excess pore pressure, , as a function of the normalized penetration velocity, , has been introduced in the previous chapter (Equation 8.4).
This equation may be manipulated to obtain a new expression relating the product of cone metrics, , to the normalized index, , defined in Equation 9.9:
|
|
(9.14) |
or directly to the soil permeability:
|
|
(9.15) |
where is the excess water pressure at the position in undrained conditions, is the CPTu diameter, is the slope of the virgin consolidation line and is the initial void ratio; as in the previous chapter, the initial value of is used. and are two parameters describing the behavior in partially drained conditions. In the development of these two expressions, it has been assumed that the initial value of is representative.
Equation 9.14 can be further elaborated to:
|
|
(9.16) |
where the two dimensionless groupings denoted as and are defined as:
|
|
(9.17) |
|
|
(9.18) |
It is clear that Equation 9.16 is quite similar to Equation 9.12 and may be seen as a continuous generalization of the [186] original expression. This continuous generalization clearly incorporates the undrained limit as an asymptote (as then ).
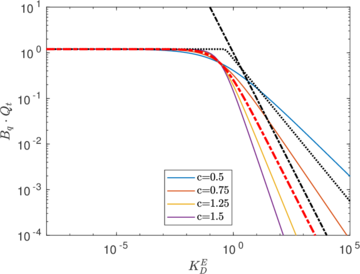
| |
| (a) | |
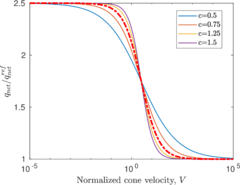
|
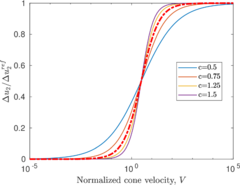
|
| (b) | (c) |
| Figure 147: Comparison of the chart by [185,186] with the backbone curve of [165]. On top, the chart (discontinuous black lines) in addition to Equation 9.16. On the bottom, net cone resistance and excess water pressure in terms of the cone normalized velocity. Curves corresponding to are shown with a red, thick, discontinuous line. | |
The number of adjustment parameters involved in this continuous generalization is five (, , or , , ), a number identical to those in the piecewise generalizations. Two parameters (, ) may be independently measured. The undrained limit a may be approximated with expressions such as Equation 9.11.
Next, a parametric analysis of Equation 9.16 is presented. In particular, the effect of the five adjustment parameters of the continuous generalization is assessed and compared to the proposals of [185,186]. As a reference case, , whereas and ; these last two values correspond to those suggested by [165].
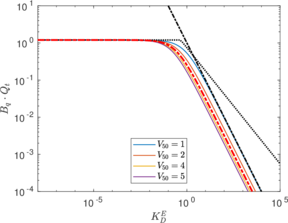
|
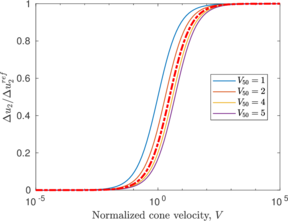
|
| (a) | (b) |
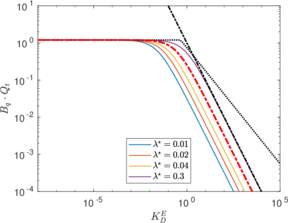
|
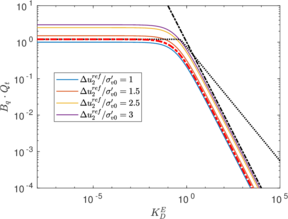
|
| (c) | (d) |
| Figure 148: Comparison of the chart by [185,186] with the backbone curve of [165]. Effect of , (a), , (c) and , (d). Effect of on the back-bone curve , (b). Curves corresponding to the reference case are shown with a red, thick, discontinuous line. | |
As a first step, Figure 147 assesses the effect of , a parameter that controls the rate of change of the net cone resistance and measured water pressure at position in terms of the normalized cone velocity and also the extension of normalized cone velocities in which partially drained conditions prevail (see Figure 147(b) and (c)). In the space, the parameter does not have any effect in practically undrained conditions: both models predict that the product of cone metrics is constant for low values of permeabilities. In partially drained conditions, lower values of the parameter results in a lower slope in the line representing partial consolidation. Interestingly, the modification of the interpretation chart of [186] based on experimental data may be interpreted as a low value of .
The effect of the other parameter introduced by [165], , is depicted in Figure 148. This parameter corresponds to the normalized velocity at which one-half of the excess pore pressure under undrained penetration is mobilized (see Figure 148(b)). In the interpretation chart, the transition point from undrained to partially drained conditions moves to higher as decrease.
The other two parameters, , do not have any effect in the backbone curves but they do have an effect in the interpretation chart. Larger values of have the opposite behavior of decreasing , see Equation 148 and Figure 148(c). By considering larger values of , the constant straight line describing undrained conditions appears in higher ; the transition point between partially drained and undrained conditions remain at the same value of .
To conclude the comparison between both models, it can be stated that the model proposed by [165] may be rewritten in a similar form than the model of [186]; that is, a relation between . The expression proposed by [165] has five parameters that need to be estimated: two constitutive parameters ( and ) and three describing the CPTu behavior during penetration (two of them describing the behavior in partially drained conditions - and - and one in undrained conditions -). By using some combinations of these parameters, the two different models proposed by [185,186] (the one based on analytical methods and the modified one that describes better the database of field and laboratory tests) may be obtained.
9.5.2 Assessment against numerical results
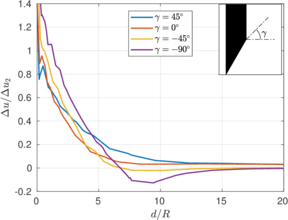
|
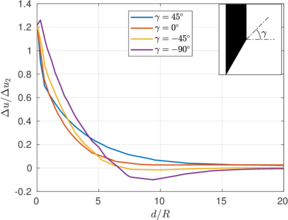
|
| (a) m/s | (b) m/s |
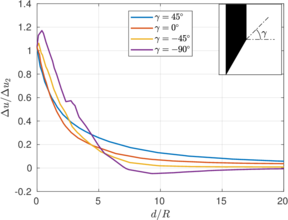
|
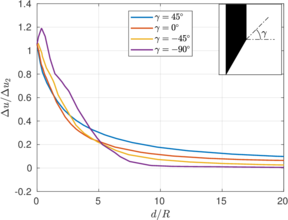
|
| (c) m/s | (d) m/s |
| Figure 150: Effect of permeability on normalized pore pressure variations with normalized distance to the position along different directions. | |
Figure 149 presents the pore pressure field at for different permeabilities. As expected [134], the highest pore pressure is observed just ahead of the cone shoulder reaching approximately 1.5 times the . An assumption of spherical symmetry for the pore pressure steady state disturbance is present in the derivations of Equation 9.12. The numerical results show that the shape of the moving disturbance becomes somewhat more elongated as the permeability decreases (Figure 149). A similar effect was noted by [158] when varying penetration rate and keeping permeability constant. Examining in more detail that shape (Figure 150) it appears that the spherical symmetry assumption is more questionable when looking closer to the cone tip (direction given by in Figure 150) and that the asymmetry is more marked as permeability decreases.
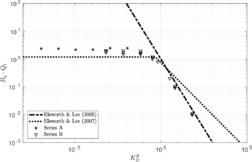
|
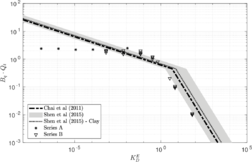
|
| (a) | (b) |
| Figure 151: Permeability estimation on the fly. Numerical results in the interpretation charts proposed by [185,186], (a), and [187] and [188], (b). | |
![Permeability estimation on the fly. Numerical results in the KD- Bq\, Qₜ plane with the reformulation of [165].](/wd/images/thumb/f/f3/Draft_Content_325409517-monograph-NewFigure-C1.png/252px-Draft_Content_325409517-monograph-NewFigure-C1.png)
|
| Figure 152: Permeability estimation on the fly. Numerical results in the plane with the reformulation of [165]. |
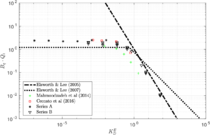
|
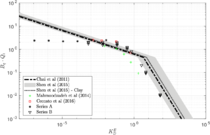
|
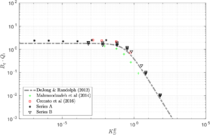
|
| (a) | (b) | (c) |
| Figure 153: Permeability estimation on the fly. Numerical results in the interpretation charts proposed by [185,186], (a), and [187] and [188], (b), and the reformulation of [165], (c). | ||
Figure 151 shows the numerical results plotted in the interpretation charts proposed by [185,186,187,188]. As predicted by [186], numerical results corresponding to practically undrained conditions plot in a straight line (Figure 151), that depends on several constitutive parameters and the initial stress state. For instance, for Series A this line is approximately given by whereas for Series B this limit line is . By using Equation 9.11, this straight line should be and respectively, which is in good agreement with the numerical results.
Results in partially drained conditions show a good agreement with the proposed analytical solution, Equation 9.10, whereas a poorer correlation is achieved with the modified expression [186], although the authors achieved a better correlation with the utilized database of field and laboratory tests [186]. Therefore, the numerical results do not support the need for introducing a value of in Equation 9.12 in partially drained conditions.
Figure 151(b) presents the same analysis but with the modifications proposed by [187] and [188]. Again, the set of data corresponding to a penetration in practically undrained conditions plots in an almost straight line: for Series A, the mean value of the product is 2.34 and the standard deviation is 0.12; this product does not show any trend with permeability. By using the method proposed by [187], a permeability equal to m/s is estimated for the mean value of the product . This value is in the range of permeability values that separate undrained conditions from partially-drained conditions. In partially drained conditions, the interpretation technique of [187] behaves worst than the original one proposed by [185]: [187] over-estimates the permeability by a factor of 4 whereas the original proposal, [185], over-estimates the permeability by a factor of 2.
The developed trend line based on the work of [165], Equation 9.16, is depicted in Figure 152. This curve depends on -which is estimated from the numerical simulations for Series B-, soil input constitutive parameters ( and ), and the two parameters of the backbone curve. For these last two coefficients the representative values proposed by [165] are used ( and ). A good fit appears, in line with that obtained for the backbone expression in the previous chapter, Figure 126.
| Reference | OCR | ||||||
| Mahmoodzadeh et al. [164] | 0.0404 | 0.205 | 1.38 | 1 | 0.803 | 0.086 | 1.39 |
| Ceccato et al. [160,161] | 0.04 | 0.205 | 1.41 | 1 | 0.805 | 0.085 | 1.63 |
| Series A | 0.02 | 0.2 | 1.94 | 1.1 | 0.9 | 0.068 | 2.31 |
| Series B | 0.05 | 0.3 | 2 | 1.21 | 0.83 | 0.1 | 1.93 |
This analysis is enriched by considering other numerical results of the simulation of the CPTu in clayey materials. In particular, Figure 153 incorporates the results of [164] and Ceccato et al. [160,161]. In all these works, the soil is discretized by the Modified Cam Clay and isotropic permeability tensors are considered. Some of the modified Cam Clay constitutive parameters of these analyses are reported in Table 23, that, for comparison purposes, also includes those of Series A and B.
It should be noted that [164] simulated a centrifuge specimen, analyzed the effect of the velocity of penetration rather than the permeability of the soil and the work focused on dissipation based methods (as such, the water pressure at 1 second after the end of penetration is used in the present work as a representative value at the position during penetration). The most drained simulation of Ceccato et al. [160,161] has an almost zero water pressure and it is not presented in this figure; all this data has been digitalized from the graphs of the publications and a small error on the estimation of this almost zero water pressure would result in a large scatter in the interpretation chart.
Introducing other numerical results reported in the literature into the analysis does not vary the already stated observations (see Figure 153). Interestingly, the constitutive parameters employed by [164] have a lower and, using Equation 9.11, lower is predicted than those of Series A and B (see Table 23). As noted in Figures 148 (a) and (b), the curve describing partially drained conditions shifts to the left of the graph as is reduced and the same effect is produced when decreases. Consequently, the numerical results of [164] plot slightly to the left of Series B.
9.6 Concluding remarks
In this chapter, several techniques to interpret the permeability for clayey materials have been assessed against a set of data obtained from numerical analysis. Several sets of numerical data have been used and presented: in two of them the effect of permeability in the dissipation phase has been assessed; in one of them, the penetration took place in practically undrained conditions whereas in the other partially drained conditions were encountered. In the other two cases, penetration took place in practically undrained conditions and attention was paid at the effect of the interface friction angle.
For partially drained CPTu penetration, the on-the-fly method appears to offer a good approximation to the evaluation of permeability in compressible soils. The continuous generalization proposed here offers a clear connection with studies on partially drained penetration and clarifies the meaning of the adjustment parameters. The method does not seem appropriate for the more undrained materials, where dissipation is more onerous.
On the other hand, dissipation-based methods appear far more sensitive to permeability. The simple correlation of [181] produces results that are in the correct order of magnitude. The more elaborated technique developed by [178] improves slightly on those results, its limits essentially given by the difficulty in estimating the precise value of operative stiffness during consolidation.
10 Conclusions and future work
10.1 Summary and conclusions
The objective of this thesis was to develop a numerical framework, based on the Particle Finite Element method, capable of simulating insertion problems found in Geotechnical Engineering.
The main contributions and conclusions of this work are summarized below:
Constitutive models at large strain: novel explicit algorithm. The theory of hyperelastic-based plastic constitutive models based on the multiplicative decomposition of the deformation gradient has been described in detail. Afterwards, a novel explicit integration scheme has been presented. After describing the equations to perform a single elastic or elasto-plastic update, the integration point algorithm has been presented in detail. This algorithm, based on the work of [76], encompasses adaptive substepping and a yield violation drift correction technique (based on [90]).
The overall algorithm has been assessed in several strain-driven problems. It is found that the obtained results are accurate. Indeed, using an adaptive substepping scheme very similar results are obtained irrespectively of the number of incremental steps; the yield drift violation is small and less than three iterations are required to perform the correction.
Imposition of contact constraints.
Two different algorithms have been presented to integrate the tangential contact stress along the interface. First, a completely implicit scheme is presented. Noting that the former scheme has the same formal structure of the one-dimensional return mapping, an alternative scheme using the Implex algorithm [99] is developed. These two algorithms are assessed in a number of simulations; the effect of the time-step, mesh-size and penalty parameters on the solution is fully characterized.
Mixed stabilized formulations in Soil Mechanics. The quasi-incompressible material response often found in geomaterials may produce severe volumetric locking in the obtained solution if not addressed appropriately in the formulation of the problem. In this work, three different mixed formulations for the one-phase mechanical problem have been assessed. In order to employ equal order interpolants in displacements and scalar fields, stabilization techniques are used in the scalar balance equations.
It has been noted that, in the coupled hydro-mechanical problem, an incompressible material behavior may stem either from undrained conditions or as a consequence of the material behavior. As such, two three-field mixed formulations have been presented, in which either the effective pressure or the Jacobian are considered as nodal variables, in addition to the solid skeleton displacement and water pressure. Stabilization techniques are used in the mass conservation equation of the biphasic medium and in the rest of scalar equations.
The good performance of these mixed formulations have been shown in a number of representative numerical simulations. In particular, the newly developed stabilized mixed formulations for the hydro-mechanical problem resulted in a significantly improved response: in the challenging simulation of Cone Penetration test, the calculated stress fields show a much smoother response and the computed cone resistances show less oscillations in the penetration curves. The main downside of mixed formulations is that the number of degrees of freedom increase with respect to the irreducible formulation; however, the benefits of doing so are obvious.
The application of the numerical framework brought new insights in several penetration problems frequently encountered in Geotechnical Engineering:
Simulation of soil sampling. The proposed numerical methodology has been applied to the simulation of soil sampling in clayey soils employing a total stress approach. Despite its importance, this problem has attracted very limited attention in terms of numerical analysis.
This work reported a parametric analysis in which the effect of several constitutive parameters, the geometry of the cutting shoe, the thickness of the wall and the behavior of the soil-steel interface has been assessed. In all these simulations complete details of the failure mechanism have been reported; additionally, attention has been paid at classical parameters used to infer sampling disturbance: the axial strains along the centerline of the tube and the specific recovery ratio.
The numerical centerline strain paths have been compared with those predicted by the Strain Path method. Very limited agreement has been found between the numerical simulations and the Strain Path method results of [138].
The theory developed by [1] to predict the occurrence of a plug inside of an open-ended pile has been assessed against the numerical series that explored the effect of a non-smooth interface behavior. Numerical results confirm that a plug is formed once the unit end bearing capacity of the tube is similar to the end unit bearing capacity of a closed-ended pile.
Coupled hydro-mechanical simulation of the Cone Penetration test. The performance of the developed hydro-mechanical formulation has been examined by simulating a challenging problem: the Cone Penetration test. A parametric analysis has been reported in which the effect of the interface friction angle and the permeability of the soil -ranging from drained to undrained conditions- have been explored.
The influence of permeability on cone resistance, sleeve friction and pore pressures at three potential measurements points was characterized. The net cone resistance and mesured excess water pressure were analyzed in terms of the normalized cone velocity and a good fit with the model proposed by [165] was found; it has been shown that the ratio of the net cone resistance of drained over undrained conditions increases as the interface friction increases. For the analyzed case, the friction sleeve resistance seemed independent of the hydraulic conditions.
Permeability estimates from Cone Penetration test. The evaluation of the coefficient of consolidation of fine grained soils has been of much interest for geotechnical design. CPTu based methods for estimating the consolidation coefficient have been researched intensively almost since the instrument became available. However, most of the interpretation techniques are still based on empiricism or the solution of simplified models. In this work, results of several simulations of the CPTu test installation and subsequent dissipation in soils have been used to assess the reliability of several methods to estimate the permeability, including on-the-fly methods, in which permeability might be directly estimated from the CPTu data stream without the need for any stoppage.
These on-the-fly techniques have a number of fitting parameters, whose significance is not well understood. To clarify the meaning of these parameters, the on-the-fly techniques have been linked to the expression proposed by [165] that describes the variation of cone metrics in terms of the normalized cone velocity, giving a new meaning to the adjustments parameters.
For partially drained penetration CPTu, on-the-fly method appears to offer a good approximation to the evaluation of permeability in compressible soils. These method do not seem appropriate for the more undrained materials, where dissipation is more onerous. In these cases, dissipation-based methods appear far more sensitive to permeability; even simple correlations produce results that are in the correct order of magnitude.
In conclusion, the main numerical contributions of this dissertation may be summarized as:
- A novel explicit stress integration for large-strain elasto-plastic models has been developed.
- Two stabilized-mixed formulations for the hydro-mechanical problem have been proposed. These formulations, developed for linear elements, are able to alleviate volumetric locking.
The main contributions to geotechnical knowledge are:
- An extensive parametric analysis of tube sampling using a total stress approach has been presented. The obtained strain paths along the centerline show very limited agreement with those obtained by the Strain Path method developed by [138].
- The theory developed by [1] to predict plugs has been validated using a set of numerical results.
- The meaning of the fitting parameters that appear on the on-the-fly permeability estimation methods based on [185,186] has been clarified.
- The continuous generalization of on-the-fly permeability techniques proposed here and numerical results support the theoretical limits of the theory developed by [186]: these techniques are only suitable for materials in which the CPTu sounding takes place in partially drained conditions.
10.2 Future work
The robustness, accuracy and versatility of method has been demonstrated extensively. Therefore, while keeping the fundamentals, further investigation in the following topics is suggested:
Nodally-integrated elements. Several nodally-integrated Finite Elements and mesh-free methods based on Galerkin integration have been developed [195,196,197,198]; by employing this approach stress and all material history variables are located exclusively at nodes. Consequently, the number of integration points may decrease with respect to other approaches and, in remeshing-based methods -such as PFEM-, the numerical noise associated to remeshing steps may decrease. However, nodal integration suffers from spurious singular modes; this spatial instability results from under-integration of the weak from and is typically alleviated by the use of stabilization methods [195,197]. Recently, a nodally integrated Finite Element method has been used in conjunction with PFEM, leading to the Smoothed Particle Finite Element method (SPFEM) [199]. The study of these nodally-integrated formulations may decrease the numerical noise associated to the remeshing steps of method and increase the particulate nature of PFEM.
Include dynamic effects on the overall formulation. In this work, only quasi-static cases are considered. However, there is a broad range of penetration problems that require a dynamic setting. Examples of dynamic penetration problems are displacement piles, that are driven into the soil by striking them with a hammer, or some site investigation techniques, such as Free Fall penetrometers, which measure the acceleration of the object and, additionally, the tip stress, sleeve friction and pore pressure might be also measured [200]. A full Biot formulation, that has as nodal variables the solid skeleton displacement, the (Darcy's) fluid displacement and water pressure ( element), has already been implemented; additionally, contact constraints have been enhanced to introduce the restrictions on the fluid velocity along the contacting interface. To fulfill this objective, at least two main tasks are required. Further work is required in order to introduce the displacement and rotation degrees of freedom. Additionally, artificial boundary conditions, also referred to as absorbing or radiation conditions, are required to simulate the wave propagation towards infinity without reflecting back [201].
Contact between deformable bodies. In all the simulations of penetration problems presented in this work it has been assumed that one of the contacting bodies -the structure- is completely rigid. This hypothesis might be appropriate in the analyzes reported here; however, to consider the deformation of the structure might be necessary to study other penetration problems. It might be convenient for the analysis of dynamic penetration problems; also, in soil sampling with very thin tubes, the deformation of the structure might be relevant. Procedures to impose the contact constraints between deformable bodies have already been implemented in the computational code used in this work [33,30]; these algorithms might require some adaptation for the hydro-mechanical problem.
Enhance the analysis of CPTu. The interpretation of CPTu results still relies on empiricism or the solution of simplified problems. Numerical analysis may be used to enhance the current practice techniques. In this work, the effect of a limited number of parameters governing the problem have been studied. Enhancing the parametric analysis may surely give new insights on the problem.
In all the simulations, the permeability tensor has been assumed isotropic. For most natural soft marine clays, the horizontal permeability is only 10% or 20% higher than the vertical value [182]; experimental evidences suggest that this ratio increases as the soil is loaded in oedometric conditions [202]. On the other hand, dissipation-based techniques are believed to estimate the horizontal component of the permeability tensor [180,178]. The effect of anisotropic permeability tensors is unknown on the developed excess water pressure during CPTu penetration and the dissipation test. This proposed analysis may enhance the knowledge of current CPTu permeability estimation techniques, both on-the-fly and dissipation-based.
The measurements during CPTu penetration are strongly influenced by the properties of soils in a region up to 30 cone diameters from the cone tip [203]. When soils are formed by layers of different stiffnesses and strengths, for instance, alternation of sands and clays, a straight interpretation of the CPTu metrics would result in an overestimation of the resistance in weak layers and the opposite effect in stiffer layers [204]. Numerical simulation may enhance the knowledge of the effect of inter-layered soil profiles in the measured CPTu test data.
Enhance the analysis of soil sampling. The simulation of the insertion of a tube brought valuable results. However, this analysis may be extended in several ways. For instance, future work should cover more cutting shoes geometries: (i) the employed wall thickness may be regarded as to thick in current geotechnical practice (that has been justified from a computational cost of view), (ii) the analysis did not cover the inside cutting edge angle, which is believed to have a large impact on the frictional forces that develop in the internal shaft, and (iii) lower outside cutting edge angles should be considered.
Although the employed total stress approach is completely justified, the simulation of this problem using a coupled hydro-mechanical formulation may enhance the knowledge of this problem. By doing so, an effective stress Mohr-type model might be used to describe the soil-steel interface behavior, rather than the employed one, in which the maximum allowable contact tangential stress is a fraction of the undrained shear strength of the soil. As such, the interface behavior would be described with a more reliable law.
In all the simulations, very large shearing strains have been obtained. These large strains may produce a change in structure of the soil and, consequently, affect the undrained shear strength. The change of structure may be described in several ways: either by considering a strain-softening Tresca model in a total stress approach [108] or using a coupled formulation in conjunction with a constitutive model that explicitly accounts for structure and damage to the structure [205,206].
Appendix A. Estimation of the stabilization factor for the one-dimensional u-pw element
In this appendix, the Matlab file mentioned in Section 2.4.8 to estimate the stabilization factor for one-dimensional linear elements with displacement and water pressure degrees of freedom is presented. The effect of the stabilization factor on the solution of the oedometer problem is studied. As such, the system of equations is solved symbolically and the solution at the node with the impermeable boundary condition and its neighbor is studied (see Matlab code A.1).
As already stated in Section 2.4.8, the stabilization factor may be estimated as:
|
|
(A.1) |
To validate this estimate, Figure 154 presents the displacement and water pressure field using a 15 node mesh using, as a stabilization factor, the obtained estimate multiplied by a factor ; that is, the expression that is used for the stabilization factor is:
|
|
(A.2) |
As shown in Figure 154, using values of lower than 1 the displacement and water pressure field exhibit sharp unphysical oscillations whereas values larger than the unity produce an over-diffusive solution. Remarkably, using the obtained water pressure profile shows an excellent agreement with analytical solution of Terzaghi.
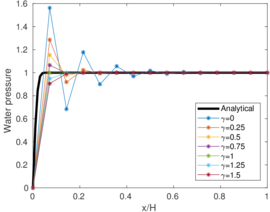
|
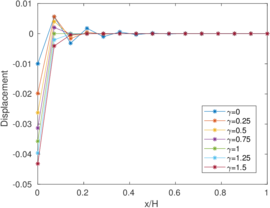
|
| (a) | (b) |
| Figure 154: Simulation of the oedometer test. Influence of the stabilization factor on the solution. Solution for 14 linear elements at . Water pressure field, (a), and displacements, (b). | |
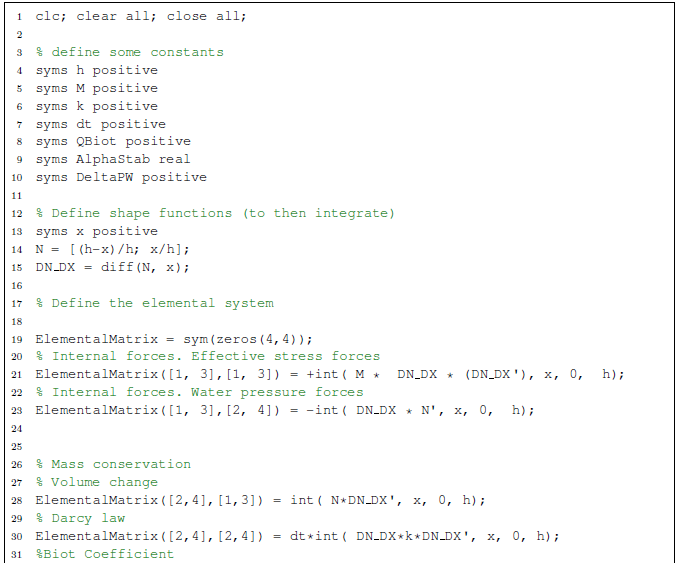
|
| Matlab code A.1: Matlab file to estimate the stabilization factor for the one-dimensional element. |
B Assessment of Houlsby (1985) hyperelastic model
B.1 Introduction
Despite the benefits of the use of hyperelastic based models, up to date the majority of numerical analysis of geomaterials still relies on hypoelastic models. The use of hyperelastic models may be interpreted as a restriction; however, the use of hyperelastic constitutive equations ensures that the model does not generate or dissipate energy over a closed stress or strain path: that is, the model is correctly formulated in a thermodynamic sense [97]. To deal with clays, the most popular hyperelastic law is that proposed by [42] and later modified by [43]. This law is able to capture the pressure-dependent nature of the bulk and shear modulus by defining them as a function of the first and second invariants of the deformation measure; typically, the infinitesimal strain tensor in small deformation problems and the spatial Hencky strain in large deformation formulations. However, in the literature several shortcomings of the model have been identified [42,43,97].
The model has four independent parameters: , , and . is the constant part of the shear modulus whereas controls the shear modulus and the amount of coupling between the volumetric and deviatoric response. To the best of the author's knowledge, in the literature one or the other of the two constitutive parameters are assumed equal to zero. It is therefore unknown the effect of having both constitutive parameters different from zero on the performance of the model where several shortcomings have already been noted.
This Appendix describes the main problems related to the use of this law and possible solutions. The Appendix is organized as follows: first, the hyperelastic model is described; then, some of the drawbacks of the model are presented through the use of algebraic manipulation and, in addition, closed form solution to evaluate important geotechnical properties, such as the undrained shear strength, , are derived; the third part presents some numerical results. Finally, some conclusions are drawn.
B.2 Houlsy hyperelastic model
The free energy of the model is given by [42,43]:
|
|
(B.1) |
where is a reference pressure, , is the slope of the swelling line, is the initial void ratio, is the constant part of the shear modulus and is a parameter.
As a consequence, the volumetric and deviatoric part of the effective Kirchhoff stress, , are computed according to:
|
|
(B.2) |
where is the Kirchhoff effective mean stress and is the deviatoric part of the Kirchoff stress tensor and:
|
|
(B.3) |
In Equation B.2 it can be clearly seen that the volumetric and deviatoric response is coupled in elasticity by the constitutive parameter . The response is only uncoupled in the case that since .
The following tangent matrix may be obtained:
|
|
(B.4) |
where:
|
|
(B.5) |
|
|
(B.6) |
|
|
(B.7) |
In these latter expressions it can also be noted that volumetric-deviatoric and deviatoric-volumetric coupling terms appear in the stiffness matrix. Again, these terms vanish only if is considered equal to zero. Additionally, in the case that and along the -axis, the shear modulus is proportional to the effective pressure; but, in the rest of the stress space it depends on the norm of the elastic deviatoric strains.
B.2.1 Existence of a maximum attainable stress ratio
It has been reported that, due to the hyperelastic law formulation, the model has a maximum attainable stress ratio [42]. If and , the Hessian matrix of the stored energy function becomes singular when . As a consequence, the maximum attainable stress ratio is:
|
|
(B.8) |
The maximum attainable stress ratio is, in most cases, similar (or lower) to the Critical State Line, , since, as it will be shown below, the value of is related to the Poisson's ratio.
For the case that both constitutive parameters are different from zero, let us express the elastic stiffness matrix as:
|
|
(B.9) |
where and .
In the case that both constitutive parameters are different from zero, the tangent elastic matrix becomes singular when the following expression is met,
|
|
(B.10) |
The form of this limiting deviatoric strain in the stress space will be shown below, in the numerical assessment section.
Of course, if , then the coupling term vanishes whereas the shear modulus is constant and positive . Also, the bulk modulus is positive. As a consequence, for this special case, the determinant of the stiffness matrix is always positive and all the stress ratios may be obtained.
B.2.2 Poisson's ratio
![Poisson's ratio along the p-axis and maximum attainable stress ratio in terms of α\, κ* (two constitutive parameters), predicted by [42] hyperelastic model for α> 0 and G₀= 0.](/wd/images/thumb/9/9f/Draft_Content_325409517-monograph-FigureMaxStress.png/360px-Draft_Content_325409517-monograph-FigureMaxStress.png)
|
| Figure 155: Poisson's ratio along the -axis and maximum attainable stress ratio in terms of (two constitutive parameters), predicted by [42] hyperelastic model for and . |
The Poisson's ratio, assuming that and , may be expressed by
|
|
(B.11) |
which clearly implies that the Poisson's ratio tends to when the effective pressure tends to zero whereas in tends to for large values (in absolute value) of the effective pressure. On the other hand, if and , the Poisson's ratio is only constant along the -axis and its value is given by [43]:
|
|
(B.12) |
As stated before, the maximum attainable stress ratio and the Poisson's ratio are linked. To show this, Figure 155 depicts both in terms of the value of the product , see Equations B.8 and B.12. It can be seen that for positive values of the Poisson's ratio, the maximum attainable stress ratio is very low: in fact the maximum attainable stress ratio for a Poisson's ratio larger than zero is 1.5.
It must be also pointed out that, for the rest of conditions, the model predicts six different Poisson's ratios, that reduce to three under triaxial conditions (with ; and in compression triaxial, being the axial direction). This fact is a consequence of the last term of the stiffness matrix, Equation B.4.
When any combination of and are considered, the Poisson's ratio tends to for zero effective pressure whereas its value tends to the one predicted by Equation B.12 for large values (in absolute value) of the effective pressure along the -axis, since the Poisson ratio may be computed as:
|
|
(B.13) |
Further results of the Poisson's ratio will be shown latter in the numerical analysis, since the value of the Poisson's ratios (for all strain states) are obtained here by inverting the stiffness matrix and identifying terms in the compliance matrix.
B.2.3 Constant volume stress path
Due to the coupling between the volumetric and deviatoric elastic behaviour, constant volume stress paths produce variations on the effective stress pressure. The value of the slope is given by:
|
|
(B.14) |
As already indicated by [43], if and , this slope only varies with the stress ratio () according to this implicit expression:
|
|
(B.15) |
However, in the general case, the slope varies with both stress invariants and not with the ratio.
B.2.4 Undrained shear strength
In order to show the effect of the hyperelastic model and, in particular, the coupling between the volumetric and deviatoric elastic response on the elasto-plastic behaviour, let us obtain the undrained shear strength for undrained compression on isotropically consolidated cases.
The effective pressure and preconsolidation pressure are given by:
|
|
(B.16) |
where and is the isotropic overconsolidation ratio.
During the undrained loading no volumetric deformation exists. Additionally, at Critical State (CS), the effective pressure is the double of the preconsolidation pressure:
|
|
(B.17) |
Introducing these conditions to the problem statement, Equation B.16, the following relations are found:
|
|
(B.18) |
where is the plastic volumetric strain ratio.
As such, the Undrained shear strength reads:
|
|
(B.19) |
Of course, in the case that is considered null, the elastic volumetric and deviatoric behaviour decouples and the undrained shear strength reads:
|
|
(B.20) |
which is exactly the same expression found in other works, for instance [192].
In order to see the effect of , let us rewrite the Undrained shear strength, Equation B.19, as:
|
|
(B.21) |
which has the same structure of the one encountered in the uncoupled case multiplied by a correction factor. Since is always larger than one by its definition and the exponent, , is positive, the term is always larger than one.
Then, it has been demonstrated that the predicted undrained shear strength for isotropically consolidated materials is larger in the case that compared to the uncoupled case. The magnitude of this difference will be investigated in the next section.
B.2.5 Critical state line in the ϵv- π\prime space
In this subsection, an expression for the Critical State Line in the volumetric strain – effective pressure space is derived. The following equations define the problem:
|
|
(B.22) |
where it has been assumed that the initial state is isotropic.
After some manipulation, the following expression may be obtained:
|
|
(B.23) |
so that:
|
|
(B.24) |
The coupling of volumetric and deviatoric elastic model implies that the Critical State Line is not defined by a straight line in the – space in the case that . However, as will be shown in the numerical assessment section, the last term of Equation B.24 is almost negligible.
B.3 Numerical assessment
In this section, the main features and limitations of the hyperelastic model are described through numerical analysis. First, one of the examples reported by [43] is reanalyzed; in particular, in this example the effect of having both and different from zero is examined. The second numerical assessment aims to provide the characterization of the constitutive parameters that are used in the simulation of the Cone Penetration test in Chapter 8 and Appendix E.
B.3.1 Borja et al undrained triaxial
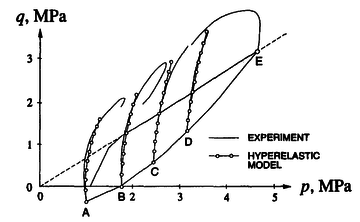 ] ]
|
| Figure 156: Effective stress paths of undrained triaxials on Vallericca clay [43] |
|
|
MCC1 | MCC2 | MCC3 |
|
|
0.013 | 0.013 | 0.013 |
| 103 | 103 | 0 | |
| (MPa) | 0 | 25 | 510 |
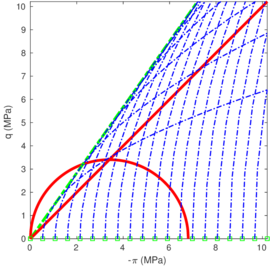
|
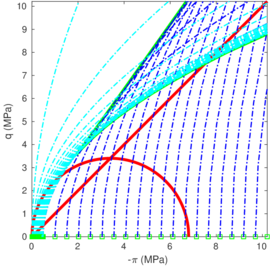
|
| (a) | (b) |
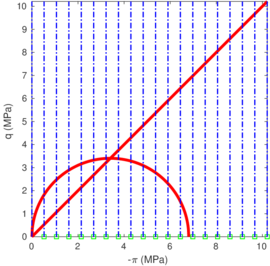
| |
| (c) | |
| Figure 157: Contours of the Constant Elastic Volumetric strains for the hyperelastic model for Material MCC1, (a), MCC2, (b), and MCC3, (c). | |
To exemplify and assess the effect that both constitutive parameters are different from zero, one of the examples of [43] is reanalyzed. In the referred work, the hyperelastic model is used to simulate the response observed in the triaxial response of Vallericca clay after it has been anisotropically consolidated and then unloaded to produce several samples with different overconsolidation ratios.
Figure 156 shows the results obtained in the testing program: in particular, the figure shows the elastic undrained stress path during triaxial compression (and also the effective stress path of the anisotropic loading and unloading to produce the initial state prior to the undrained compression triaxial). The undrained stress paths show that this particular material has a significant volumetric-deviatoric elastic coupling since the stress paths are not described by vertical straight lines, such as would predict any elastic model with uncoupled volumetric and deviatoric behavior.
For the numerical simulation, in the referred work the authors use the following set of parameters: , , .
In order to understand the effect of the constitutive parameters, this particular problem has been reanalyzed. The elastic parameters are listed in Table 24, where case MCC1 coincides with the reference one. Additionally, the following parameters have been assumed: , , MPa; as a consequence of the assumed material parameters and based on the reported maximum vertical load and interpreted [43], the initial preconsolidation stress is set to MPa.
Attainable stress ratio
Figure 157 shows the constant volume trajectories in the triaxial plane assuming elasticity; as a reference, the Critical State Line and initial yield surface are also depicted. Using the combination MCC3, these trajectories are straight lines, since there is no coupling between the volumetric and deviatoric elastic response. For the MCC1 constitutive parameters, the limit stress ratio is ; once the stress state reaches this limit, the determinant of the elastic stiffness matrix becomes negative and the stress ratio drastically reduces as deviatoric strains increase.
Using the parameters MCC2, the curve depicted in green shows the stress state whose elastic constitutive matrix is singular, that is, Equation B.10. It can be seen that this curve has two different values of deviatoric stress for a single value of the effective pressure: the lower value of deviactoric stress is obtained with (whose constant volumes trajectories are depicted in cyan in Figure 157). It must be noted that the stress states inside the curve may be obtained with four different combinations of volumetric and deviatoric strains: two with positive and two with negative elastic stiffness matrix. Potentially, using the combination of parameters and , all the stress states of the triaxial plane may be obtained.
Another output of the previous analysis is Figure 158, that shows the curvature of the constant volume trajectories in terms of the stress ratio; in other words, this figure plots in terms of the stress ratio . As shown by Equation B.14, in the general case this slope varies with the strain (or stress) state. However, as reported by [43], the curvature only varies with the stress ratio for the case that . In this figure, curves are reported in terms of the effective stress. As expected, a single curve is found for the set MCC1. On the contrary, for the set MCC2, the amount of coupling increases at larger effective pressures and tends to the curve predicted by MCC1.
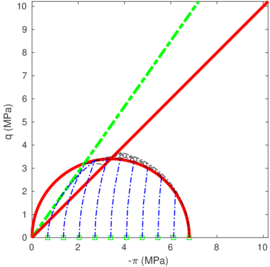
|
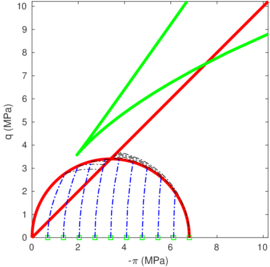
|
| (a) | (b) |
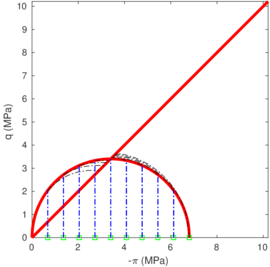
| |
| (c) | |
| Figure 159: Effective stress trajectories of undrained compression triaxial for Material MCC1, (a), MCC2, (b), and MCC3, (c). | |
Undrained triaxial tests
Results of undrained triaxial tests at a broad range of overconsolidation ratios are presented Figure 159. The axial load vs axial displacement results are not reported here since these simulations have been calculated with an independent Matlab code and some simplifications have been made. For instance, for undrained triaxial tests, the stress path from the p-axis to the yield surface is obtained imposing a sequence of volume preserving strains; once the point reaches the yield surface, using Matlab non-linear solver a new stress-strain point is found such that (i) the yield surface is zero, (ii) there is no variation of volume and (iii) the Lode angle is (triaxial compression test) and (iv) the stress path tends to the Critical State line. Since the problem is solved in this manner, some information regarding the deviatoric plastic strains are lost. In order to validate this implementation, some simulations have been run using this the code and the one that is used to compute boundary valued problems and exactly the same stress paths have been found.
For the MCC1, the case with a larger OCR touches the limit stress ratio and then continues elastically with a negative determinant of the elastic stiffness matrix until it reaches the yield surface. During this part of the loading the stress ratio reduces instead of increasing. From the yield surface to the CSL the point advances showing hardening instead of softening. As a consequence, the undrained shear strength, , of this simulation is larger than for other cases with lower OCR; this behavior is contrary to what is expected. Meanwhile, for the rest of cases considered for the material parameters MCC1 the undrained shear strength increases as the overconsolidation ratio decreases, as expected in the uncoupled cases, see Equation B.20.
Using the parameters MCC2 (where the only difference is that MPa instead of zero), the curve describing the stress points where the determinant of the elastic stiffness matrix moves away from the away from the origin; thus, increasing the region of attainable stress states for this hyperelastic model. Due to this increased attainable stress space, all the undrained triaxial tests can be simulated and the expected tendencies are found: the undrained shear strength decrease as the overconsolidation ratio increases (maintaining the same preconsolidation pressure).
Due to the coupling between the volumetric and deviatoric behavior, MCC1 and MCC2 stress paths show some curvature during the elastic regime.
Drained triaxial tests
Figure 160 shows the results of the simulation of drained triaxial tests. Using the set of parameters MCC1, the traixial test with the lowest OCR could not be simulated since the stress state reaches first the limit of attainable stress ratios before reaching the yield surface. However, the rest of simulations of MCC1 could be computed.
In some of the simulations of the set MCC2 it appears that the stress trajectory crosses the curve where the determinant of the elastic stiffness matrix becomes singular. However, it should be noted that for these simulations the relevant limit is the other branch of the curve. The reason beneath this fact is that some stress states may be obtained with different combinations of volumetric and deviatoric strains (see Figure 157) and, as noted before, the condition of a null determinant of the stiffness matrix is posed by an expression relating volumetric and deviatoric strains, Equation B.10.
Figure 160 also includes the behavior in the plane. To ease the interpretation, the CSL assuming that is also included. Due to the coupling, in all the simulations where (MCC1 and MCC2), the response in purely elastic regime is not represented by a straight line. For this reason, all the cases with do not exactly reach the depicted CSL; however a Critical State response is obtained.
To conclude this analysis, Figure 161 shows the main elastic moduli along the compression triaxial plane. As a consequence of Equation B.5, the bulk modulus coincides in all the three cases. Using the constitutive parameters MCC1 and MCC2 similar results of the shear modulus and the coupling term are obtained. The shear modulus for material MCC3 is not depicted since it is constant and the coupling term is null.
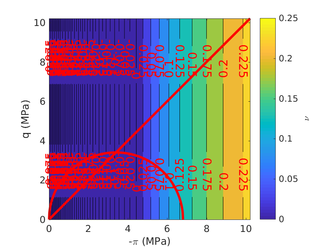
|
| Figure 162: Contour plot of the Poisson's ratio in the triaxial plane for MCC3 |
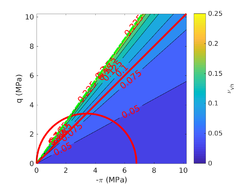
|
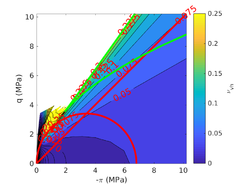
|
| (a) | (b) |
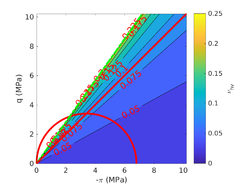
|
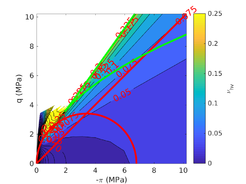
|
| (c) | (d) |
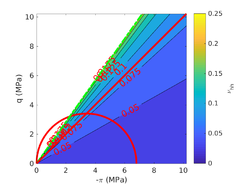
|
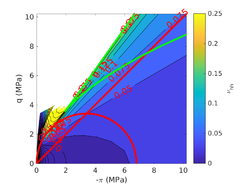
|
| (e) | (f) |
| Figure 163: Contour plots, on the triaxial compression plane, of the Poisson's ratios for MCC1 (left) and MCC2 (right). On top , in the middle and on the bottom . | |
The Poisson's ratios are presented in Figures 162 and 163. In all cases the Poisson ratio has been obtained constructing the stiffness matrix in the principal strains axes (3 by 3 matrix), inverting it to obtain the compliance matrix and interpreting the terms. As predicted by Equation B.11, using the set of constitutive parameters MCC3, the Poisson's ratio only depends on the effective pressure; in fact, it can be seen that it varies rapidly between -1 and 0.5.
By using six different Poisson's ratios appear that reduce to three under the assumption of a triaxial compression state. The three Poisson's ratio appear to be proportional to the stress ratio for the combination MCC1 (), whereas there is not a clear trend when using the combination MCC2. In both cases, all the Poisson's ratios are larger than zero for a broad range of stress states. Additionally, differences between the three Poisson's ratios are not large.
B.3.2 Constitutive parameters for the simulation of the CPT
|
|
M | (kPa) | |||
|
|
0.333 | 0.3 | 1 | 70 | 2 |
|
|
(kPa) | (kPa) | M | (kPa) | |||
|
CPT1 |
10 | 23.5 | 400 | 0.1 | 1 | 70 | |
| CPT2 | 10 | 18 | 400 | 0.1 | 1 | 70 | |
| CPT3 | 10 | 0 | 1000 | 0.1 | 1 | 70 |
In Chapter 8, the numerical results of the simulation of the Cone Penetration test reported by [123] have been used to validate partially the numerical model. As stated before, the main differences between both numerical codes lies on the adopted numerical model In the referred work, the numerical simulations are carried out using Abaqus. Presumably, an hypo-elastic plastic constitutive model have been used. However, in the work reported here, the elastic model is described by means of the hyperelastic model proposed by [42].
In Appendix E, three sets of constitutive parameters have been used to calculate the nearly drained and undrained penetrations in order to assess the influence of the parameters governing the deviatoric elastic response and the volumetric-deviatoric coupling. To complete the analysis, this section is devoted to highlight the differences from an element-test point of view.
For completeness, the constitutive parameters used by [123] are shown again, see Table 25. The three sets of considered parameters, that try to resemble the ones of the reference solution, are presented in Table 26.
Figure 164 shows the effective stress path for all three sets of constitutive parameters. The first thing to note is that, for any of the combinations of constitutive parameters, the curve where the determinant of the elastic stiffness matrix is null does not appear in these graphs. This limiting curve exist, but appears at much larger mean stress and deviatoric stresses, far beyond the expected stress range that might appear in the simulation of the CPTu.
As expected from Equation B.19, having an different from zero results in a larger undrained shear strength, , compared to the uncoupled case. This can be observed in Figure 164. The difference between case CPT1 and CPT2 is almost negligible, whereas the difference with case CPT3 (the uncoupled one) is still small.
Figure 165 presents the main elastic moduli for this example. The effect of only changing the value of from 23.5 to 18 can be observed on both, the shear modulus and the coupling term: the two moduli decrease as the value of decreases.
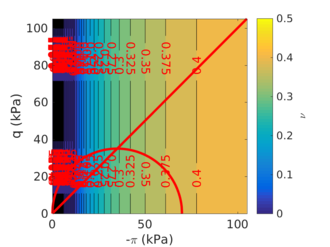
|
| Figure 166: Contour plot of the Poisson's ratio in the triaxial plane for CPT3 |
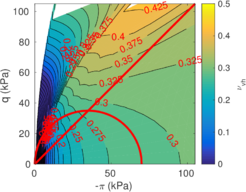
|
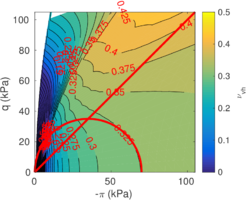
|
| (a) | (b) |
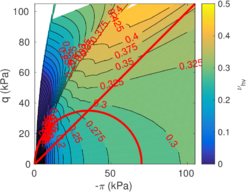
|
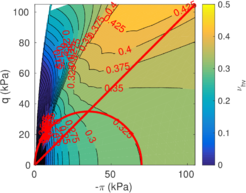
|
| (c) | (d) |
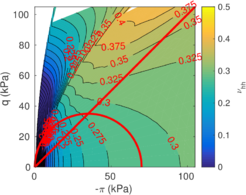
|
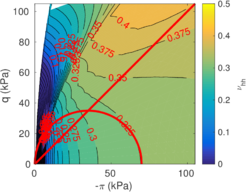
|
| (e) | (f) |
| Figure 167: Contour plots, on the triaxial compression plane, of the Poisson's ratios for MCC1 (left) and MCC2 (right). On top , in the middle and on the bottom . | |
Figures 166 and 167 present the Poisson's ratios along the triaxial plane. As it can be noted, the shear modulus of the set of Parameters CPT3 has been chosen such that produces a Poisson's ratio equal to those of the reference solution at the initial stress state. The Poisson's ratio rapidly changes along the triaxial plane. However, as shown in Figure 166, small variations of the Poisson's ratio are found in constant volume trajectories departing from the initial state that is used in the simulation of the CPT ( kPa, kPa).
In contrast, Figure 167 compares the Poisson's ratios along the triaxial plane for material CPT1 and CPT2. For each particular material, the differences between the three Poisson's ratios are small. The set of parameters CPT1 yields smaller Poisson's ratios than CPT2 does. Additionally, and compared to that obtained using the set of parameters CPT3, a value of results in an almost constant Poisson's ratio for a broad range of stress combinations.
In the simulation of the CPT in undrained conditions using these three sets of constitutive parameters (Appendix E) minimal differences should appear as a consequence of differences in the shear modulus (or Poisson's ratio). As shown in the previous figures, starting from the initial stress state ( kPa and kPa) and performing constant volume trajectories, the discrepancy of the shear modulus between the three sets of constitutive parameters is not large.
B.4 Concluding remarks
In this appendix, the main features of the hyperelastic model proposed by [42] and latter modified by [43] have been described. In particular, it has been emphasized the importance of two constitutive parameters: , the constant part of the shear modulus, and , a parameter that controls the shear modulus and the coupling between volumetric and deviatoric elastic response. Traditionally, it has been assumed that one of them is equal to zero.
The hyperelastic model predicts a bulk and shear moduli that are pressure-dependent by defining them as a function of the first and second invariants of the deformation measure. However, in order to obtain this behavior using an hyperelastic formulation, the volumetric and deviatoric elastic response becomes coupled. Additionally, the model predicts six different Poisson's ratios; numerical evaluation shows that the difference between these Poisson's ratios is not large.
It has been frequently reported that this hyperelastic model implies a maximum attainable stress ratio. Here, it has been shown that having two constitutive parameters, namely and , different from zero, the attainable stress space is enlarged, allowing to compute triaxial tests for large overconsolidation ratios.
Finally, the effect of the hyperelastic model in the simulation of drained and undrained triaxial tests has been examined. On the one hand, it has been demonstrated that the coupling between the volumetric and deviatoric elastic behavior predicts slightly larger undrained shear strengths that the uncoupled model. On the other hand, the Critical State Line on the volumetric strain-effective pressure space also depends on the norm of the deviatoric strain in the cases where .
Appendix C. Linearization of the mixed formulations
C.1 Introduction
This chapter presents the linearized form of the mixed formulations presented in Chapter 5. As in the development of the linearization of the primal formulation, Sections 2.3.5 and 2.4.7, the weak form is linearized and a continuous stiffness matrix is then formed by inserting the definition of the nodal approximation. On the contrary, if the discrete Finite Element equations are linearized the consistent linearization is found [53,54].
In the mixed formulations for the one-phase problem and due to the structure of the mixed formulations, only the internal forces term and the additional balance equation are linearized; the term due to the body forces and (eventually) the dynamic forces remain equal.
Additionally, in the hydromechanical problem, the mixed formulations only affects the definition of the internal forces due to the effective response of the medium. As such, the same terms are valid just taking into acount that the stress measure is the total stress in one-phase formulations whereas the effective stress in the hydromechanical analysis.
C.2 u-θ formulation
C.2.1 Weak form
The weak form of the formulation reads:
|
|
(C.1) |
where and is the Cauchy stress tensor evaluated with the assumed deformation gradient, , that is defined as:
|
|
(C.2) |
However, in two-dimensional plane-strain analysis, the assumed deformation gradient should be:
|
|
(C.3) |
and, in two-dimensional analysis, the constitutive law (CL) is evaluated with:
|
|
(C.4) |
Then, in order to simplify the notation, let us re-define the assumed deformation gradient as:
|
|
(C.5) |
where and is the number of direct strain directions; that is 2 in plane strain conditions and 3 in axisymmetric and three-dimensional analysis.
The external forces term, , is
|
|
(C.6) |
As noted before, in hydro-mechanical simulations, this term also includes the contribution of the water pressure to the internal forces:
|
|
(C.7) |
C.2.2 Preliminaries
First, let us compute the linearization of some deformation and stress measures.
The linearization, with respect to the displacements, , and the assumed Jacobian, , of the assumed deformation gradient is:
|
|
(C.8) |
As a consequence, the derivative of the (constitutive) Right Cauchy Green reads:
|
|
(C.9) |
Although it is not elegant, let us compute the derivative of the Cauchy stress tensor:
|
|
(C.10) |
The first term may be obtained as:
|
|
(C.11) |
whereas the second term:
|
|
(C.12) |
in the third term, the constitutive stiffness matrix is introduced:
|
|
where is the material constitutive matrix and is the Eulerian constitutive matrix.
and, finally, the fourth term:
|
|
(C.13) |
As a consequence, summing the four terms, using and arranging all the terms:
|
|
(C.14) |
where ; that is, in Voigt notation, this four order tensor reads:
|
|
(C.15) |
|
|
(C.16) |
C.2.3 Linearization
Hereafter, the linearization of the first equation (internal forces), Equation C.1, is obtained. By applying the product rule:
|
|
(C.17) |
The first term may be obtained as:
|
|
(C.18) |
In the second term, the linearization of the Cauchy stress obtained in Equation C.14 is introduced:
|
|
(C.19) |
And the third term reads:
|
|
(C.20) |
By doing the sum, the linearized internal forces read:
|
|
(C.21) |
The derivative of the second equation is much simpler:
|
|
(C.22) |
C.2.4 Matrix form
Finally, the stiffness matrix involved in the Newton-Raphson for the formulation, has the form:
|
|
(C.23) |
where the involved matrices may be obtained as:
|
|
(C.24) |
|
|
(C.25) |
|
|
(C.26) |
|
|
(C.27) |
where is the Voigt notation of the tensor , and the definition of terms involved in the computation of the non-linear (geometrycal) stiffness matrix, and , may be found in [60] and are presented, for two-dimensional cases, in Equations 2.80 and 2.81.
C.3 u-p formulation
C.3.1 Weak form
The balance equations of the formulation reads:
|
|
(C.28) |
It should be stressed that even in two-dimensional cases the pressure corresponds to the three-dimensional pressure; that is, the strong form of the second balance equation reads:
|
|
(C.29) |
C.3.2 Preliminaries
As in the previous case, let us begin by computing the linearization of the Cauchy stress tensor:
|
|
(C.30) |
C.3.3 Linearization
First, let us obtain the linearization of the term due to the internal forces. Applying the product rule of differentiation:
|
|
(C.31) |
where it has been introduced .
The first term renders:
|
|
(C.32) |
Whereas the second term encompasses the constitutive matrix:
|
|
(C.33) |
The last term can be further elaborated:
|
|
(C.34) |
So introducing this expression to Equation C.33:
|
|
(C.35) |
So, finally, the linearization of the Internal forces, Equation C.31:
|
|
(C.36) |
where
On the other hand, the derivative of the pressure equation may be obtained as:
|
|
(C.37) |
C.3.4 Matrix form
Finally, the stiffness matrix involved in the Newton-Raphson for the formulation, has the form:
|
|
(C.38) |
where the involved matrices may be obtained as:
|
|
(C.39) |
|
|
(C.40) |
|
|
(C.41) |
|
|
(C.42) |
where , and , is the Voigt notation of the tensor , and the definition of terms involved in the computation of the non-linear stiffness matrix, and , may be found in [60] and are presented, for two-dimensional cases, in Equations 2.80 and 2.81.
It is worth noting that the stiffness matrices developed may be compared with the classical ones used in Solid Mechanics, for instance, the ones presented in [207]. In classical mixed formulations used in Solid Mechanics, it is assumed that the elasto-plastic constitutive response encompasses a pressure-insensitive plastic model (von Mises, Tresca, ...) and that the elastic volumetric response is uncoupled from the deviatoric part. A typical elastic model for the volumetric response that corresponds to a Neo-Hookean or a linear Hencky model is:
|
|
(C.43) |
where is the bulk modulus.
Then, introducing the definition of the constitutive tensor in Equation C.42, it can be demonstrated that this matrix reduces to the classical form of the Solid Mechanics formulation, for instance the one reported in [207]:
|
|
(C.44) |
C.4 u-θ-p formulation
C.4.1 Weak form
The balance equations for the formulation read:
|
|
(C.45) |
Linearizations for this set of equations have appeared before in the literature, for instance in [53,58].
On the one hand, in [53] pressure and volume change variables are approximated by different order shape functions than displacements; not only that, these variables are discretized by element-discontinuous shape functions, so the value of the pressure and volume change fields may be evaluated explicitly at element level based on displacement and the stress . As such, the non-linear system of equations may be written only depending on displacements. Additionally, there are other differences: it is assumed that the volumetric and deviatoric response are uncoupled, the pressure field is computed with in two dimensions (contrary to this work, that pressure is always the three-dimensional pressure) and instead of approximating the Jacobian, , the extra degree of freedom approximates the volumetric Hencky strain, ; that is, the second balance equation proposed by [53] reads:
|
|
(C.46) |
On the other hand, in [58] the linearized form is obtained to admit constitutive equations whose volumetric and deviatoric are coupled. However, no special treatment to plane strain conditions is given (i.e, the special definition of the assumed deformation gradient for plane strain analysis, Equation C.3).
C.4.2 Linearization
Linear momentum balance equation
First let us compute the linearization of the internal forces. In this case, the linearization is performed for a single variable every-time.
With respect to the displacements
|
|
(C.47) |
After introducing the derivative of the linearization of the Cauchy stress tensor calculated with the assumed deformation gradient, Equation C.14, one may get that the linearization of the internal forces with respect to the displacements read:
|
|
(C.48) |
where and . It must be noted that most of the terms coincide with the ones presented by [58] for 3D cases. Eventually, by reworking more the previous equation the same expressions might be found.
With respect to the Volume change:
|
|
(C.49) |
which is equal to the expression presented by [58] for three-dimensional analysis.
With respect to the pressure:
|
|
(C.50) |
Jacobian balance equation
The linearization of the volume change balance equation is exactly the same than the one obtained for the formulation, Equation C.22.
Pressure balance equation
The linearization of the Cauchy stress computed with the assumed deformation gradient is given by Equation C.14. Then, the linearization of pressure continuity equation reads:
|
|
(C.51) |
where .
From the linearization of the previous equation, one can easily see that it is exaclty the same than the one presented by [58] under the hypothyesis of three-dimensional analysis .
In the previous expression there is a missing term for plane strain conditions: the effect of the out-of-plane stress. In other words, the previous expression assumes that in plane strain conditions and the linearization of the term of the out-of-plane stress is missing.
Having in mind that for , the linearization of the out-of-plane stress is:
|
|
(C.52) |
where and .
So, finally, the missing term has the form:
|
|
(C.53) |
C.4.3 Matrix form
Due to the high complexity of the formulation and, as mentioned early, the linearization has different terms in plane strain and three-dimensional analysis, the matrix form is not presented. The interested reader is referred directly to the developed numerical implementation [37].
Appendix D. Bearing capacity factors of close-ended piles and tubes
D.1 Introduction
In Chapter 7, the theory developed by [1] to predict the formation of plugs in tubes and open ended piles has been explained in detail. To employ this theory, the value of all the vertical forces acting on the structure is required, in addition to the bearing capacity factor of open ended piles. Specifically, estimates of the vertical stress acting on the annulus section of the tube, , the internal skin friction resistance, , and the vertical stress acting on the tip of a closed-ended pile, , are needed.
[1] suggest to approximate all these resistances by classical CPT interpretation techniques. In particular, the tip resistance (of both, open and closed ended piles), and , is assumed to be equal to the cone tip resistance, , although the authors state that it may be a crude approximation:
|
|
(D.1) |
where a value of is recommended for the cone bearing capacity factor whereas it is suggested to approximate the undrained shear strength through . Meanwhile, two expressions are given to evaluate the skin friction:
|
|
(D.2) |
This appendix describes the results of the simulation of a closed-ended pile. Secondly, a by-product of all the simulations presented in Chapter 7 -namely, the bearing capacity factors of open-ended piles- is reported.
D.1.1 Simulation of closed-ended pile
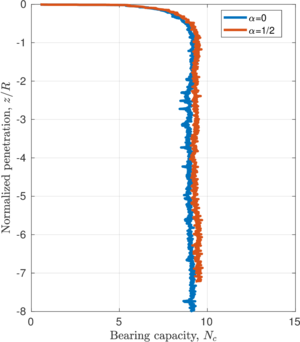
|
| Figure 168: Closed ended pile. Normalized penetration curve for the smooth case () and a rough case (). |
In order to assess the theory proposed by [1], the bearing capacity factors of closed-ended piles are required. To this end, this section presents the results of the simulation of closed-ended piles.
The geometry and boundary conditions for this analysis are almost coincident with those employed for the simulation of the tube sampler; see Figure 68. Additionally, to increase the resemblance between this pile and the plugged soil sampler, the sharp edge between the tip and shaft of the pile is rounded with a circumference whose radium is equal to that employed in the simulation of round-tipped samplers.
In this analysis, a rigidity index of =100 is used, whereas two different contact roughnesses are considered: (smooth) and .
Figure 168 presents the main result of interest: the bearing capacity factor, , defined as:
|
|
(D.3) |
where is the total tip force divided by the projected area whereas stands for the initial total vertical stress. It is clear that after a normalized penetration of 1 radii, both cases reach a stationary state. Little influence of the contact roughness is appreciated: for the smooth case the mean bearing capacity factor is 8.97 whereas a value of 9.33 is obtained for the rough case. The obtained end bearing capacity factor assuming a smooth interface, , is in good agreement with the traditional value proposed by [208], .
Figure 169 explores the failure mechanism for the smooth case. This failure mechanism almost matches that of the rough case. This mechanism closely resembles that described for plugged samplers.
|
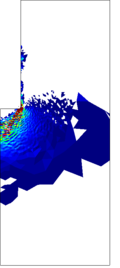
|
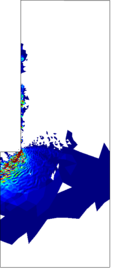
|
|
| (a) | (b) | (c) | (d) |
| Figure 169: Closed ended pile. Smooth interface. Incremental plastic shear strain. | |||
D.2 Bearing capacity factors of tubes
The tip bearing capacity factor of an open-ended pile is defined as:
|
|
(D.4) |
where is the total vertical force acting on the annulus section of the open-ended pile divided by the projected area.
D.2.1 Smooth interface
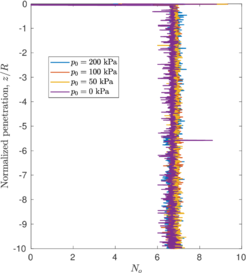
|
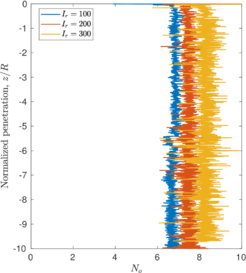
|
| (a) | (b) |
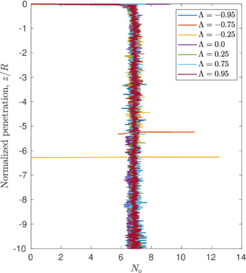
| |
| (c) | |
| Figure 170: Bearing capacity factor for a smooth open-ended pile: influence of the in situ vertical stress, (a), rigidity index, (b), and initial stress anisotropy, (c). | |
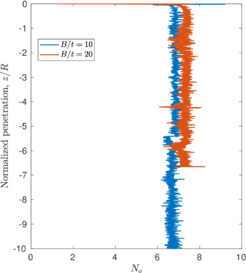
|
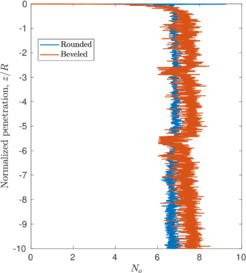
|
| (a) | (b) |
| Figure 171: Bearing capacity factor for a smooth open-ended pile. Influence of for a round-tipped sampler, (a), and the geometry of the cutting-shoe, (b). | |
Figures 170 and 171 depict the evolution of the bearing capacity factor of open-ended piles for several constitutive and geometrical parameters assuming an smooth-interface. Figure 170(a) analyzes the effect of the initial mean stress of the soil (all the simulations consider an isotropic initial stress state) for a rigidity index of and (that is, the set of data presented in Figure 75(a)): the bearing capacity factor is independent of the initial mean stress. The bearing capacity shows a very small influence due to the initial stress anisotropy (Figure 170(b)). The rigidity index of the soil plays a prominent role on the bearing capacity factor, that increases from for to for . The bearing capacity factor is also affected by the thickness of the wall: as larger ratios between the outer diameter to the wall thickness are considered, increases (Figure 171(a)). Finally, the effect of beveled cutting-shoe geometries is assessed in Figure 171(b): the bearing capacity factor considering a cutting-shoe with an outside cutting-edge angle of is larger compared to the round-tipped case.
These bearing capacity factors are much lower than that obtained for a smooth CPT that penetrates a soil characterized with a rigidity index of : a bearing capacity factor of has been obtained in Section 6.4. The reason beneath this fact is the completely different failure mechanism that governs each problem: in the tube insertion problem, most of the material that lays below the tube gets squeezed inside (see, for instance, Figure 71); on the contrary, the failure mechanism obtained for the CPT resembles that of closed ended piles (see Figure 169).
In summary, from the available data, the bearing capacity factor of an open-ended pile with a round-tipped cutting shoe that penetrates a soil may be estimated as:
|
|
(D.5) |
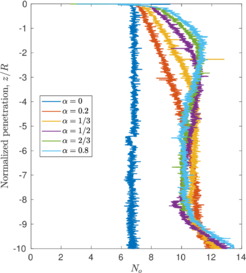
|
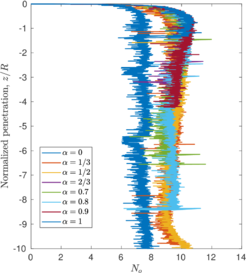
|
| (a) | (b) |
| Figure 172: Bearing capacity factor for a rough open-ended pile: round-tipped shoe, (a), and with an angle of 20, (b). | |
D.2.2 Rough interface
Figure 172 depicts the evolution of in terms of the penetration assuming a rough interface behavior with and for the two cutting shoe geometries. This bearing capacity factor increases until it reaches a maximum around for the round-tipped shoe and for the one with a beveled cutting edge; then, the factor seems to decrease until it reaches a stationary value around and in each case. Finally, as noted before, this factor increases because the boundary of the domain is too near.
D.2.3 Piston in the inner free surface
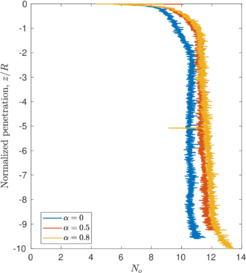
|
| Figure 173: Bearing capacity factor for a smooth open-ended pile with a piston inside of the free-inner surface. Effect of the contact roughness factor. |
The analysis is repeated for the case where a piston is placed on top of the interior free surface. The same definition of the bearing factor, Equation D.4, is used. As shown in Figure 173, for the smooth case, the bearing capacity factor for the smooth case with and . In this case, the bearing capacity factor for a smooth interface is approximately ; surprisingly, this value lies in the range of values of most bearing capacity factors of the CPT, see Table 9. Once a rough interface behavior is considered, larger values of the bearing capacity are obtained. It is unclear if these values represent a steady state since it seems that the bearing capacity slowly increase; additionally, the force acting in the inner piston continuously decrease (see Figure 94(a)) and, eventually, a plug may be formed inside of the tube. The effect of this hypothetic plug on the bearing capacity is unknown.
D.3 Concluding remarks
This Appendix presented the bearing capacity factors of open and closed ended piles. These bearing capacity factors are required to assess and predict the formation of a plug in a tube or a closed-ended pile by using the theory proposed by [1].
First, the bearing capacity of a closed-ended pile in an isotropically stressed soil with a rigidity index of has been obtained; for a smooth interface and increases with the contact roughness to (). These values are slightly lower than typical estimates of the bearing capacity of a CPTu, , obtained through numerical analysis. It has beens shown that the failure mechanism resembles that of plugged open-ended piles and has some similitudes with the one obtained in the simulation of the CPTu.
Finally, this appendix reported the bearing capacity factors of open-ended piles, a by-product of the simulations presented in Chapter 7.
The bearing capacity factor of a smooth open-ended pile is much lower than that of a CPTu or a closed-ended pile. This difference has been attributed to the completely different failure mechanism that exist in these problems: whilst in the open-ended pile a very narrow failure mechanism prevails, in the CPTu and closed ended piles a much larger area of soil is affected by plastic strains. The bearing capacity factor depends on the rigidity index and the geometry of the sampler (cutting shoe geometry and thickness of the wall); a very small variation due to the initial stress anisotropy has also been reported.
Results assuming a rough interface behavior have also been presented. It has been found that the maximum bearing capacity factor is in the order of irrespectively of the contact adhesion; this capacity factor decreases until it reaches a value approximately of once the structure is plugged.
Appendix E. Additional results of the hydro-mechanical simulation of the Cone Penetration Test
E.1 Introduction
The hyperleastic model first developed by [42] and later modified by [43] describes the elastic regime in terms of three different constitutive parameters. As already noted in Appendix B, these three constitutive parameters may be difficult to calibrate and interpret and may pose a maximum attainable stress ratio. In this appendix, additional numerical results of the simulation of the cone penetration test in a Modified Cam Clay are presented, in which the influence of the parameters governing the elastic deviatoric response and the coupling between the elastic volumetric and deviatoric behavior is assessed.
E.2 Details of the analysis
|
|
M | (kPa) | |||
|
|
0.333 | 0.3 | 1 | 70 | 2 |
|
|
(kPa) | (kPa) | M | (kPa) | |||
|
CPT1 |
10 | 23.5 | 400 | 0.1 | 1 | 70 | |
| CPT2 | 10 | 18 | 400 | 0.1 | 1 | 70 | |
| CPT3 | 10 | 0 | 1000 | 0.1 | 1 | 70 |
In this appendix, additional results of the hydro-mechanical simulation of the Cone Penetration Test in (hyperelastic) Modified Cam Clay soil are presented. The same geometry and problem set-up than in Chapter 8 are used. In particular, in this appendix several sets of constitutive parameters are used in order to assess the effect on the cone response.
Again, all the constitutive parameters try to mimic the ones used by [123] to simulate the CPT in clay. In the referred work, the authors use an hypo-elastic plastic implementation of the Modified Cam Clay; the method used to handle large strains and rigid boy rotations is not specified. The constitutive parameters employed by [123] are listed in Table 27.
The set of constitutive parameters that are used to re-calculate the problem are listed in Table 28. A more detailed description of these parameters has been presented in Appendix B. Basically, it has been shown that the sets CPT1 and CPT2 have shear modulus almost proportional to the effective mean stress and the elastic and deviatoric response is coupled, since ; CPT1 has a slightly larger shear modulus than CPT2. On the other hands CPT3 has a constant shear modulus, that has been fitted to be equal to the shear modulus at the initial state of the reference solution of [123] and CPT1; additionally, the volumetric and deviatoric elastic response is uncoupled. Due to this coupling, sets CPT1 and CPT2 predict larger -and almost coincident- undrained shear strength, , than CPT3 (see Figure 164). By using all these three sets of constitutive parameters, the admissible stress space is large. Table 29 presents the value of the initial shear modulus, , and undrained shear strength, , for the three materials.
In terms of hydraulic conditions, only the two limiting cases are considered: almost undrained conditions (with a permeability equal to m/s) and practically drained conditions ( m/s). In all the simulations presented herein, the clay-steel interface has been assumed smooth.
|
|
(kPa) | (kPa) | |
|
CPT1 |
1306 | 71.79 | |
| CPT2 | 1094 | 60.02 | |
| CPT3 | 1000 | 56.25 |
E.3 Results of the simulation
|
|
(kPa) | (kPa) | (kPa) | (kPa) | ||
|
Undrained |
Reference | 152 | - | - | - | |
| ( m/s) | CPT1 | 155.39 | 148.50 | 116.65 | 46.83 | |
| CPT2 | 146.94 | 140.71 | 114.94 | 47.60 | ||
| CPT3 | 148.33 | 145.7 | 115.90 | - | ||
|
Drained |
Reference | 232 | - | - | - | |
| ( m/s) | CPT1 | 228.54 | 0.82 | 0.65 | 0.3 | |
| CPT2 | 219.97 | 0.93 | 0.71 | 0.34 | ||
| CPT3 | 226.83 | 0.79 | 0.54 | 0.22 |
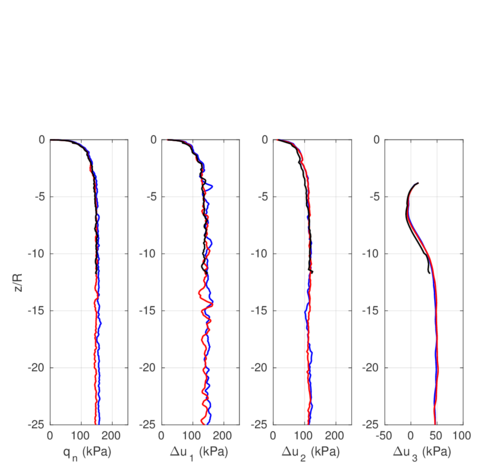
|
|
| (a) | (b) |
| Figure 174: Undrained Cone Penetration Test. Net cone resistance and water pressure at the three measurement positions for three different sets of constitutive parameters. | |
Figure 174 depicts the main results of interest in the cone penetration test for undrained conditions ( m/s). Minor differences appear in all the simulations: by using the set of CPT1 slightly higher net cone resistance are encountered (see also Table 30). This tendency may be explained by the rigidity index, : CPT1 has a slightly larger shear modulus than CPT2 and almost the same undrained shear strength; thus, CPT1 has a larger rigidity index (see Table 29). As such, a slightly larger net cone resistance is obtained since the cone factor, , is proportional to the rigidity index [10]. On the other side, considering a constant shear modulus, CPT3, similar results than the other two previous cases are obtained. In all the three cases the solution is in good agreement with the reference solution of [123], see Table 30. In terms of the numerical records of the water pressure at the three measurement positions, irrespectively of the set of constitutive parameters, almost coincident results are obtained.
To further the analysis, Figure 175 presents the results of the dissipation test of CPT1 and CPT2, where the water pressure curves are normalized with the steady state mean value during penetration. Minimal discrepancies appear in the position. However, at the position, the behavior until it reaches a normalized dissipation of 85% is slightly different; it is believed that this differences steam from the oscillatory nature of the numerical record at the position.
Finally, the problem has been reanalyzed for practically drained conditions ( m/s), Figure 176. Again, minimal discrepancies appear at the net cone resistance: the value is marginally lower using the constitutive parameters CPT2, that have a slightly lower shear modulus and less coupling between the volumetric and deviatoric response. Due to the high permeability, almost no excess water pressure is developed.
The effect of the constitutive parameters in the stress and strain fields is almost unnoticeable in both considered hydraulic conditions, drained and undrained.
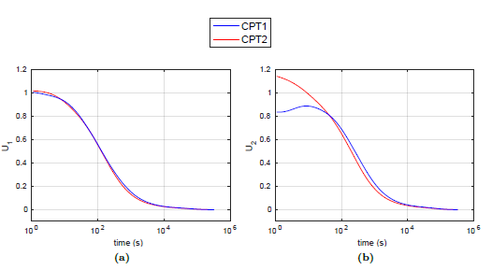
|
| Figure 175: Undrained Cone Penetration Test. Dissipation curves at the , (a), and , (b), position. The water pressure is normalized by the mean value during the penetration phase. |
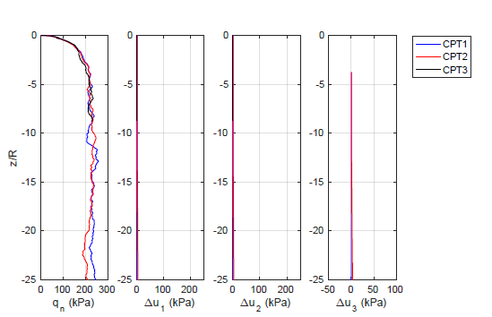
|
| Figure 176: Drained Cone Penetration Test. Net cone resistance and water pressure at the three measurement positions for three different sets of constitutive parameters. |
E.4 Concluding remarks
In this appendix, the effect of the constitutive parameters of the [42] hyperleastic model has been assessed. In particular, the effect of the value of the parameters that govern the elastic deviatoric response has been assessed in a boundary value problem: the cone penetration test. Three different sets of constitutive parameters have been used; all of them share a common treat: they try to mimic the ones used by [123]. Two of them have a shear modulus almost proportional to the mean effective stress and coupling between the elastic and deviatoric response, whereas the third has a constant shear modulus and uncoupled elastic-deviatoric response. Results of the cone penetration test in drained and undrained conditions reveal that almost coincident results in terms of the net cone resistance and water pressure are obtained irrespectively of the constitutive paremeters. A detailed look at the calculated stress and strain fields reveals that almost unnoticeable differences appear.
Appendix F. Additional results: three-dimensional simulations and hypo-elastic plastic large strain models
Numerical simulation of large displacement problems in geomechanics has attracted the interest of many researchers over the past decades. In many circumstances these problems can be treated as two dimensional: plane stress or axisymmetric. However, some problems -such as the penetration of a square foundation or the dilatometer test (DMT)- do not enjoy any of these conditions. This appendix presents the extension to three dimensions of a numerical code for the simulation of large displacement fluid-saturated porous media at large strains. The proposal relies, on the one hand, on the Particle Finite Element Method, known for its capability to tackle large deformations and rapid changing boundaries, and, on the other hand, on constitutive descriptions well established in current geotechnical analyses. The performance of the method is assessed in several benchmark examples, ranging from the insertion of a rigid square footing to a rough ball penetrometer.
F.1 Introduction
Numerical simulation of large displacement problems is relevant for many geomechanical problems. Discrete element models offer one alternative [6] but most efforts are still centered on continuum-based methods, like the finite element method (FEM). FEM can deal with the nonlinearities that arise from the simulation of large strains problems. Lagrangian formulations are well suited for path dependent material models, of the kind frequently applied in geotechnics. However, if a Lagrangian formulation is employed the mesh may experience severe distortion, leading to numerical inaccuracies and even rendering the computation impossible. To overcome the mesh distortion problem, several methods using the particle concept have been proposed: Material Point Methods [209,210] Galerkin Mesh Free Methods [211,210] or the Smoothed Particle Hydrodynamics [212].
In this work, the Particle Finite Element method (PFEM) is employed. The method is characterized by a particle discretization of the domain: every time step a finite element mesh -whose nodes are the particles- is build using a Delaunay’s tessellation and the solution is evaluated using a well shaped, low order finite element mesh [26,32]
Two-dimensional idealizations (plane stress and axisymmetric conditions) are computationally advantageous and fairly realistic for many important cases (e.g. CPTu). However, a large number of problems do not enjoy any symmetry; for instance, the penetration of a square foundation or the DMT. For this kind of problem three-dimensional models are required [130].
This appendix presents the extension to deal with three-dimensional problems of a PFEM implementation, sometimes referred to as G-PFEM (Geotechnical-PFEM), based on the Kratos framework [39]. This appendix is structured as follows: first, the two classical methods to treat constitutive models at large strains are briefly reviewed; afterwards, the proposed approach is assessed against a benchmark example -the penetration of a footing near a vertical cut- and, finally, the three-dimensional penetration of a ball penetrometer subject to an anisotropic initial stress state is presented.
F.1.1 Constitutive equations
In the literature, two main families of schemes have been proposed for the analysis of large deformation elasto-plastic problems [53,57]. The first one is based on the use of hypoelastic rate models and an additive decomposition of the spatial rate of deformation in an elastic and plastic part; this scheme may be regarded as an extension of the usual small strains algorithms so that it fulfills objective transformation and frame indifference. In the second family, deformation itself is decomposed multiplicatively into an elastic and plastic part; therefore, hyperelastic models are used. Due to its construction, the scheme fulfills inherently the objectivity requirements [53]. In this work, the effect of both constitutive frameworks is going to be assessed.
F.1.2 Hypoelastic-based plasticity
The definition of the constitutive equations read [57]:
|
|
(F.1) |
where is the spatial rate of deformation, that is assumed to split additively in an elastic, , and plastic part, .
The hypo-elastic model is formulated in terms of the Lie derivative:
|
|
(F.2) |
where is the deformation gradient.
The Lie derivative of the Kirchhoff stress tensor may be numerically discretized as [57]:
|
|
(F.3) |
where is the relative deformation between configuration relative to .
Meanwhile, the spatial deformation gradient may be approximated as [57]:
|
|
(F.4) |
By using Equation F.1 along with the previously discretized equations, the new Kirchhoff stress is obtained as:
|
|
(F.5) |
F.1.3 Hyperelastic-based plasticity
By using this constitutive framework, the deformation gradient is assumed to split multiplicative into and elastic and plastic part. That is, an intermediate configuration of irreversible (plastic) deformation is introduced, relative to which the elastic response of the material is characterized. As a consequence, the definition of the constitutive problem reads [53]:
|
|
(F.6) |
where is the elastic Hencky strain and is the stored-energy function.
Further details on the integration of stresses, that is performed with an explicit scheme with adaptive sub-stepping and correction for the yield surface drift, may be found in Chapter 3.
F.2 Numerical analyses
In this section several analyses are presented to illustrate the performance of the method. The first one consist of the two-dimensional, total stress analysis of the penetration of a footing into a weightless Tresca soil and serves to demonstrated the benefits of the use of mixed formulations to deal with incompressibility. Then, results of two three-dimensional problems are presented: the penetration of a footing into the soil and penetration of a ball.
F.2.1 Footing near a vertical cut
The first computational analysis consist of total stress penetration of a strip footing that is located near a vertical cut. This is a classic example problem analyzed by [68]. The domain consists of a square whose edges are five times the width of the footing; all the displacements are restricted at the bottom of the domain whereas the horizontal displacements are restricted to zero in the right boundary.
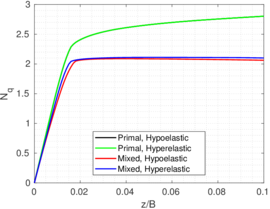
|
| Figure 177: Footing near a vertical cut. Normalized settlement vs normalized resistance using the primal and mixed formulation. |
The soil is assumed weightless and characterized by a shear modulus, kPa, a Poisson’s ratio, = 0.49, and an Undrained shear strength, kPa. A vertical velocity is applied on the top of the footing, idealized as an elastic material of shear modulus two orders of magnitude higher than that of the soil. Remeshing is disabled in a first computation, to assess the effect of the mixed formulation in isolation. The mesh is depicted in Figure 178.
Figure 177 presents the curve normalized settlement vs normalized soil resistance. The first thing to note is that in the curve obtained by using the primal formulation the normalized resistance increase continuously. On the other hand, by using the mixed stabilized formulation after a normalized penetration of the value of the resistance remains almost constant. In general higher resistances are found at every displacement when using the primal formulation. Finally, it is noted that the normalized resistance obtained with the mixed-stabilized formulation is slightly higher than 2, which is in agreement of the results presented by [68].
The behavior of the primal formulation is a consequence of the severe volumetric locking affecting low order finite elements. Furthermore, as shown in Figure 178, the results obtained using the primal formulation present high amplitude spatial oscillations on the total mean stress field whereas a much smoother distribution is found when using the mixed-stabilized formulation. Additionally, using the primal formulation, localization takes place in a shear plane whose orientation is influenced by the preferential mesh orientation. On the other hand the localization plane obtained by the stabilized-mixed formulation is very similar to that obtained by [68].
With respect to the constitutive framework used to formulate the constitutive equations at large strains, both models render similar results. On the one hand, by using the primal formulation, both curves are almost indistinguishable. On the other hand, some differences appear when the mixed stabilized formulation is used: a steeper response is obtained in the hyperlesatic-based model during the first loading steps. Once the failure surface is formed, a small reduction of the resistance is observed in the hypoelastic-based plastic model; this behavior may be explained by the different treatment of rigid-body rotations of both models.
To extend the analysis the effect of the Rigidity index and the Poisson's ratio is now examined. The model is slightly changed in that, instead of applying the vertical movement to a rigid footing, vertical displacement is directly imposed on the soil. Large vertical displacements up to 1 width of the footing are now simulated; as a result the remeshing algorithms of PFEM enter into play. Only the mixed-stabilized formulation is used in conjunction with the hyperelastic-based elasto-plastic model, since its benefits has been illustrated in the previous numerical analysis.
Figure 179(a) shows the normalized resistance curves for Poissons ratios ranging from 0.45 to 0.499 and a fixed . All the simulations share the same undrained shear strength, kPa; the Shear modulus has been modified to maintain the same rigidity index. For this particular problem the Poisson's ratio does not seem to play a prominent role since almost the same resistance is obtained irrespectively of the Poisson's ratio. The curves present slight oscillations that are caused by the introduction of new nodes in the vicinity of the nodes with prescribed displacement.
The, the effect of the Rigidity Index is assessed for a Poisson ratio of in Figure 179(b). Similarly to the rigid strip footing on a soil layer (see Section 6.2), the effect of the rigidity index is very pronounced at the beginning of the loading, but less important as penetration progresses. In all the cases a failure mechanism such as that presented in Figure 178(b) takes place and the drastic change of slope of the penetration curve corresponds to the moment when the failure mechanism is completely formed. Figure 179(c) illustrates the failed final state.
F.2.2 Rectangular footing on poroelastic media
In the second example a rectangular footing is pushed into a porous saturated soil. The soil is assumed to behave as a linear elastic material, kPa and with a permeability m/day. The footing Young modulus is two orders of magnitude larger than that of the soil.
To investigate the three dimensional effects, several footing shapes are studied, all of them with a height of 0.5 m and length of 1 m but widths to lengths ratios variable between 1 and 4. A surface load of 200 kPa is applied on top of the footing, ramped up over a period of one day. Drainage is only allowed through the free surface. Due to the symmetry of the problem, only a quarter of the geometry is simulated, see Figure 180(c).
Figure 180 presents the evolution of the footing settlement and the water pressure at a point located at a depth equal to one width over time. As the ratio B/L increases, the settlement and the water pressure also increase. All the curves that depict the water pressure evolution show a marked Mandel-Cryer effect.
| (m) | (m) | |||
| PFEM | Ref | PFEM | Ref | |
| 1 | 0.172 | 0.226 | 0.252 | 0.316 |
| 2 | 0.215 | 0.317 | 0.338 | 0.444 |
| 4 | 0.25 | 0.416 | 0.433 | 0.582 |
The problem has also been computed using both constitutive frameworks. As state in the literature [57], both constitutive theories only render similar results if elastic strains are small (for instance, in the previous example). However, this problem involves finite elastic strains. Results suggest that smaller settlements and water pressure are registered in the observation points by using an hypo-leastic based thoery (Figure 180). It must be pointed that differences at the water pressure are more noticeable between the end of the loading phase and the peak of the water pressure; this result has been observed at almost all the depths along the centerline of the footing.
These results have been compared with the analytical solution developed by [213] for rectangular, stiff rafts resting in an homogeneous isotropic half-space. As shown in Table 31, systematically lower settlements are obtained by the numerical solution, between 20% to 40% Several are the causes of this mismatch: in the numerical model it has been considered that the raft is flexible and that the interface is completely rough whereas the analytical solution assumes a completely stiff raft whose interface is smooth; additionally, in the numerical simulation the domain is finite, whereas a half-space is used in the reference solution. Although it seems a crude discrepancy, a similar order mismatch between numerical simulations and analytical solutions has been observed in axisymmetric conditions [19].
F.2.3 Ball penetrometer in anisotropically stressed clay
In this final example, the displacement of an initially embedded ball penetrometer is studied. The sphere is initially wished in placed in the middle of a cubical domain with side equal to 20 times the diameter of the sphere.
The soil is described by an hyperelastic Modified Cam Clay model; all the cases share the same set of constitutive parameters: , , kPa, and initial preconsolidation pressure of kPa. The yield surface shape in the deviatoric plane is described using the fully convex formulation proposed by [98]. Permeability was set at a relatively low value of m/s, so undrained penetration is expected. A smooth interface between the clay and the ball is considered.
All simulations are carried under constant vertical effective stress of 100 kPa. Horizontal stresses are adjusted, increasing one and decreasing the orthogonal one by the same amount, with the purpose of maintaining constant the mean effective stress at kPa. It is this anisotropy of horizontal stress what makes the problem three-dimensional.
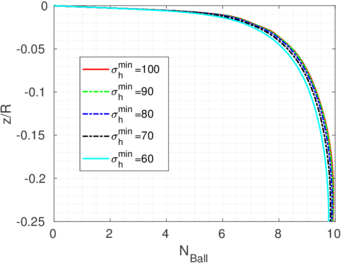
|
| Figure 181: Ball penetrometer. Effect of the horizontal stresses on the on the ball resistance. Curves are labeled in terms of the minimal horizontal stress. |
Figure 181 shows the normalized penetration vs resistance curve for a set of simulations in which the minimum horizontal effective stress varies between 60 and 100 kPa. Results are presented as curves of resistance factor against normalized displacement. The normalized resistance factor is obtained as the ratio of mobilized resistance (i.e. the total vertical force acting on the ball divided by the projected area) to the triaxial compression undrained shear strength, which, for MCC is given by
|
|
(F.7) |
Using the input data the undrained shear strength is kPa; which implies a rigidity index . The resistance factor approximates a limit value close to , with a very small effect (less than 3%) of the anisotropic horizontal stress state. The limit value obtained is slightly below the reference value , predicted by [108] using a combination of upper bound and strain path methods. Two reasons may explain this discrepancy. The first is the different material model employed (a Von Mises model was employed by [108]). The second is that only relatively shallow penetrations have been computed and the expected full flow mechanism has not been yet formed.
Despite the small difference observed in the resistance factor, the anisotropic initial stress state has consequences. For instance (Figure 182) the shape of the plastic zone is highly affected by the horizontal stress anisotropy: it is observed that the plastic zone is much more extended in the plane normal to the smallest horizontal stress and more reduced in the plane normal to the largest horizontal stress. The pore pressure field also exhibit a three-dimensional effect: as the stress anisotropy increases, larger water pressures are developed in the plane normal to the maximum horizontal stress and smaller excess water pressures are found at the plane normal to the minimum horizontal stress; in fact, in some simulations a decrease of the water pressure is found in large regions behind the ball (Figure 183).
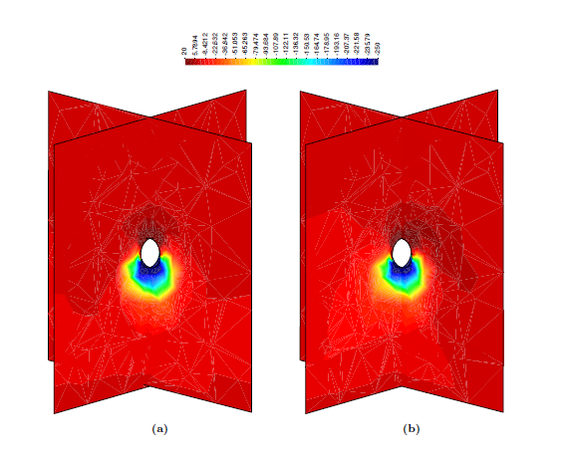
| ||
| Figure 183: Ball penetrometer. Water pressure (kPa) contours along the two two planes for a minimum horizontal stress of kPa, (a), and , (b). | ||
F.3 Concluding remarks
In this appendix, some results of three-dimensional problems have been reported. Preliminary results of the three-dimensional of the Ball penetrometer under anisotropic initial stress states, maintaining the same initial effective pressure, suggest that mobilized ball resistance is not heavily influenced by initial stress anisotropy; however, significant differences on the shape of the plastic region have been observed and the penetration mechanism was not yet fully developed. More research on this topic is currently ongoing.
Additionally, the two main frameworks to describe elasto-plastic models at large strains (namely, hypoelastic-based and hyperelastic-based models) have been numerically assessed in the penetration of a footing in a single-phase quasi-incompressible medium and in a coupled-hydromechanical case. Rigid body rotations were relatively small in both problems; as such, both constitutive models predicted similar results.
References
[1] Paikowsky, Samuel G and Whitman, Robert V. (1990) "The effects of plugging on pile performance and design", Volume 27. NRC Research Press. Canadian Geotechnical Journal 4 429–440
[2] Yu, H. S. and Mitchell, J. K. (1998) "Analysis of cone resistance: review of methods", Volume 124. Journal of Geotechnical and Geoenvironmental Engineering 2 140-149
[3] De Borst, R. and Vermeer, P. A. (1984) "Possibilites and limitations of finite elements for limit analysis", Volume 34. Géotechnique 2 199-210
[4] Arroyo, M. and Butlanska, J. and Gens, A. and Calvetti, F. and Jamiolkowski, M. (2011) "Cone penetration tests in a virtual calibration chamber", Volume 61. Géotechnique 6 525-531
[5] Butlanska, Joanna and Arroyo, Marcos and Gens, Antonio and O’Sullivan, Catherine. (2014) "Multi-scale analysis of cone penetration test (CPT) in a virtual calibration chamber", Volume 51. Canadian Geotechnical Journal 1 51-66
[6] Ciantia, M. O. and Arroyo, M. and Butlanska, J. and Gens, A. (2016) "DEM modelling of cone penetration tests in a double-porosity crushable granular material", Volume 73. Computers and Geotechnics 109-127
[7] Donea, J. and Huerta, A. and Ponthot, J. P. and Rodríguez-Ferran, A. (2004) "Arbitrary Lagrangian-Eulerian Methods. Encyclopedia of Computational Mechanics". John Wiley & Sons, Ltd
[8] van den Berg, P. and de Borst, R. and Huétink, H. (1996) "An Eulerean finite element model for penetration in layered soil", Volume 20. Int. J. Numer. Anal. Meth. Geomech. 12 865-886
[9] Hu, Y. and Randolph, M. F. (1998) "H-adaptive FE analysis of elasto-plastic non-homogeneous soil with large deformation", Volume 23. Computers and Geotechnics 1 61-83
[10] Lu, Q. and Randolph, M. F. abd Hu, Y. and Bugarski, I. C. (2004) "A numerical study of cone penetration in clay", Volume 54. Géotechnique 4 257-267
[11] Zhou, H. and Randolph, M. F. (2009) "Numerical investigation into cycling of full-flow penetrometers in soft clay", Volume 59. Géotechnique 10 801-812
[12] Nazem, M. and Sheng, D. and Carter, J. P. (2006) "Stress integration and mesh refinement for large deformation in geomechanics", Volume 65. International Journal for Numerical Methods in Engineering 7 1002-1027
[13] Nazem, M. and Carter, J. P. and Airey, D. W. and Chow, S. H. (2012) "Dynamic analysis of a smooth penetrometer free-falling into uniform clay", Volume 62. Géotechnique 10 893-905
[14] Kardani, M. and Nazem, M. and Carter, J. P. and Abbo, A. J. (2014) "Efficiency of High-Order Elements in Large-Deformation Problems of Geomechanics", Volume 15. International Journal of Geomechanics 6 1-10
[15] Abaqus. (2012) "Dassault-Systémes, Abaqus user’s manual, version 6.12"
[16] Walker, J. and Yu, H. S. (2006) "Adaptive finite element analysis of cone penetration in clay", Volume 1. Acta Geotechnica 1 43-57
[17] Pucker, T. and Bienen, B. and Henke, S. (2013) "CPT based prediction of foundation penetration in siliceous sand", Volume 41. Applied Ocean Research 9-18
[18] Khoa, H. D. V. (2015) "Numerical simulation of spudcan penetration using coupled Eulerian-Lagrangian method". 14th IACMAG Kyoto
[19] Wang, D. and Bienen, B. and Nazem, M. and Tian, Y. and Zheng, J. and Pucker, T. and Randolph, M. F. (2015) "Large deformation finite element analyses in geotechnical engineering", Volume 65. Computers and Geotechnics 104-114
[20] Coetzee, C. J. and Vermeer, P. A. and Basson, A. H. (2005) "The modelling of anchors using the material point method", Volume 29. International journal for numerical and analytical methods in geomechanics 9 879-895
[21] Alonso, E. E. and Zabala, F. (2011) "Progressive failure of Aznalcóllar dam using the material point method", Volume 61. Géotechnique 9 795-808
[22] Soowski, W. T. and Sloan, S. W. (2015) "Evaluation of material point method for use in geotechnics", Volume 39. International Journal for Numerical and Analytical Methods in Geomechanics 7 685-701
[23] Phuong, N. T. V. and van Tol, A. F. and Elkadi, A. S. K. and Rohe, A. (2016) "Numerical investigation of pile installation effects in sand using material point method", Volume 73. Computers and Geotechnics 58-71
[24] Oñate, E and Idelsohn, Sergio R and Del Pin, Facundo and Aubry, Romain. (2004) "The particle finite element method – an overview", Volume 1. World Scientific. International Journal of Computational Methods 02 267–307
[25] Oñate, E and Idelsohn, Sergio R and Celigueta, Miguel A and Rossi, Riccardo. (2008) "Advances in the particle finite element method for the analysis of fluid–multibody interaction and bed erosion in free surface flows", Volume 197. Elsevier. Computer methods in applied mechanics and engineering 19-20 1777–1800
[26] Oñate, E. and Idelsohn, S. R. and Celigueta, M. A. and Rossi, R. and Marti, J. and Carbonell, J. M. and Ryzakov, P. and Suárez, B. (2011) "Advances in the particle finite element method (PFEM) for solving coupled problems in engineering". In Particle-Based Methods. Springer Netherlands 1–34
[27] Idelsohn, SR and Oñate, E and Del Pin, F. (2003) "A Lagrangian meshless finite element method applied to fluid–structure interaction problems", Volume 81. Elsevier. Computers & Structures 8-11 655–671
[28] Idelsohn, Sergio R and Oñate, Eugenio and Pin, F Del. (2004) "The particle finite element method: a powerful tool to solve incompressible flows with free-surfaces and breaking waves", Volume 61. Wiley Online Library. International journal for numerical methods in engineering 7 964–989
[29] Oliver, J. and Cante, J. C. and Gonzalez, C. (2005) "On particle finite element methods in solid mechanics problems". Computational Plasticity: Fundamentals and Applications - Proceedings of the 8th International Conference on Computational Plasticity, COMPLAS VIII 82-85
[30] Rodríguez, J. M. and Carbonell, J. M. and Cante, J. C. and Oliver, J. (2016) "The particle finite element method (PFEM) in thermo-mechanical problems", Volume 107. Wiley Online Library. International Journal for Numerical Methods in Engineering 9 733–785
[31] Salazar, F and Irazábal, J and Larese, A and Oñate, E. (2016) "Numerical modelling of landslide-generated waves with the particle finite element method (PFEM) and a non-Newtonian flow model", Volume 40. Wiley Online Library. International Journal for Numerical and Analytical Methods in Geomechanics 6 809–826
[32] Carbonell, Josep Maria and Oñate, Eugenio and Suárez, Benjamín. (2010) "Modeling of ground excavation with the particle finite-element method", Volume 136. American Society of Civil Engineers. Journal of Engineering Mechanics 4 455–463
[33] Carbonell, Josep Maria and Oñate, Eugenio and Suárez, Benjamín. (2013) "Modelling of tunnelling processes and rock cutting tool wear with the particle finite element method", Volume 52. Computational Mechanics 3 607-629
[34] Zhang, X. and Krabbenhoft, K. and Pedroso, D. M. and Lyamin, A. V. and Sheng, D. and Da Silva, M. V. and Wang, D. (2013) "Particle finite element analysis of large deformation and granular flow problems", Volume 54. Computers and Geotechnics 133-142
[35] Zhang, X. and Krabbenhoft, K. and Sheng, D. (2014) "Particle finite element analysis of the granular column collapse problem", Volume 16. Granular Matter 4 609-619
[36] Zhang, Xue and Krabbenhoft, Kristian and Sheng, Daichao and Li, Weichao. (2015) "Numerical simulation of a flow-like landslide using the particle finite element method", Volume 55. Springer. Computational Mechanics 1 167–177
[37] Kratos Multiphysics. (2018) "https://www.github.com/KratosMultiphysics/Kratos"
[38] Carbonell, Josep Maria and Franci, A. and Oñate, Eugenio. (2015) "The Particle Finite Element Method (PFEM) in thermo-mechanical problems". IV International Conference on Particle-Based Methods. Fundamentals and Applications
[39] Dadvand, P. and Rossi, R. and Oñate, E. (2010) "An object-oriented environment for developing finite element codes for multi-disciplinary applications", Volume 17. Archives of computational methods in engineering 3 253-297
[40] Rodríguez, J. M. and Carbonell, J. M. and Cante, J. C. and Oliver, J. and Jonsén, P. (2017b) "Generation of segmental chips in metal cutting modeled with the PFEM". Computational Mechanics 1-17
[41] Rodríguez, J. M. and Carbonell, J. M. and Cante, J. C. and Oliver, J. (2017a) "Continuous chip formation in metal cutting processes using the Particle Finite Element Method (PFEM)", Volume 120. International Journal of Solids and Structures 81-102
[42] Houlsby, G. T. (1985) "The use of a variable shear modulus in elastic-plastic models for clays", Volume 1. Elsevier. Computers and Geotechnics 1 3–13
[43] Borja, Ronaldo I and Tamagnini, Claudio and Amorosi, Angelo. (1997) "Coupling plasticity and energy-conserving elasticity models for clays", Volume 123. American Society of Civil Engineers. Journal of geotechnical and geoenvironmental engineering 10 948–957
[44] Oliver, J and Cante, J. C. and Weyler, R. and González, C. and Hernández, J. (2007) "Particle finite element methods in solid mechanics problems". Springer. Computational plasticity 87–103
[45] Bal, Abdiel Ramon Leon and Hoppe, Ulrich and Dang, Thai Son and Hackl, Klaus and Meschke, Günther. (2018) "Hypoplastic particle finite element model for cutting tool-soil interaction simulations: Numerical analysis and experimental validation", Volume 3. Elsevier. Underground Space 1 61–71
[46] Larese, A and Rossi, Riccardo and Oñate, E and Idelsohn, S. R. (2012) "A coupled PFEM–Eulerian approach for the solution of porous FSI problems", Volume 50. Springer. Computational mechanics 6 805–819
[47] Rashid, M. M. (2002) "Material state remapping in computational solid mechanics", Volume 55. International Journal for Numerical Methods in Engineering 4 431-450
[48] Farrell, P. E. and Piggott, M. D. and Pain, C. C. and Gorman, G. J. and Wilson, C. R. (2009) "Conservative interpolation between unstructured meshes via supermesh construction", Volume 198. Computer Methods in Applied Mechanics and Engineering 33 2632-2642
[49] Edelsbrunner, Herbert and Mücke, Ernst P. (1994) "Three–dimensional Alpha Shapes", Volume 13. ACM Trans. Graph. 1 43–72
[50] Barbosa-Cruz, E. R. (2007) "Partial Consolidation and Breakthrough of Shallow foundations in soft soil". Ph.D. Thesis, The University of Western Australia
[51] N.-S. Lee and Klaus-Jürgen Bathe. (1994) "Error indicators and adaptive remeshing in large deformation finite element analysis", Volume 16. Finite Elements in Analysis and Design 2 99 - 139
[52] D. Peri and Ch. Hochard and M. Dutko and D. R. J. Owen. (1996) "Transfer operators for evolving meshes in small strain elasto-placticity", Volume 137. Computer Methods in Applied Mechanics and Engineering 3 331 - 344
[53] Simo, J. C. (1998) "Numerical analysis and simulation of plasticity. Handbook of numerical analysis", Volume 6 183-499
[54] Wriggers, Peter. (2008) "Nonlinear finite element methods". Springer Science & Business Media
[55] de Souza Neto, Eduardo A and Peri, Djordje and Owen, David R. J. (2011) "Computational methods for plasticity: theory and applications". John Wiley & Sons
[56] Oliver, X. and Agelet de Saracíbar, C. (2003) "Mecanica de medis continus per enginyers". Edicions UPC
[57] Simo, J. C. and Hughes, T. J. R. (1998) "Computational inelasticity". Springer Science & Business Media
[58] Zienkiewicz, O.C. and Taylor, R.L. and Zhu, J.Z. (2005) "The Finite Element Method Set (Sixth Edition)". Butterworth-Heinemann
[59] Wriggers, P. (2006) "Computational contact mechanics". Springer-Verlag Berlin Heidelberg
[60] Bathe, K. J. (2006) "Finite element procedures". Prentice-Hall
[61] Zienkiewicz, Olgierd C and Chan, A. H. C. and Pastor, M and Schrefler, B. A. and Shiomi, T. (1999) "Computational geomechanics". Wiley Chichester
[62] Carter, J. P. and Booker, J. R. and Small, J. C. (1979) "The analysis of finite elasto-plastic consolidation", Volume 3. Wiley Online Library. International Journal for Numerical and Analytical Methods in Geomechanics 2 107–129
[63] Borja, Ronaldo I and Alarcón, Enrique. (1995) "A mathematical framework for finite strain elastoplastic consolidation Part 1: Balance laws, variational formulation, and linearization", Volume 122. Elsevier. Computer Methods in Applied Mechanics and Engineering 1-2 145–171
[64] Larsson, Jonas and Larsson, Ragnar. (2002) "Non-linear analysis of nearly saturated porous media: theoretical and numerical formulation", Volume 191. Elsevier. Computer methods in applied mechanics and engineering 36 3885–3907
[65] Chapuis, Robert P and Aubertin, Michel. (2003) "On the use of the Kozeny Carman equation to predict the hydraulic conductivity of soils", Volume 40. NRC Research Press. Canadian Geotechnical Journal 3 616–628
[66] Pastor, M and Li, T and Liu, X and Zienkiewicz, OC and Quecedo, M. (2000) "A fractional step algorithm allowing equal order of interpolation for coupled analysis of saturated soil problems", Volume 5. Wiley Online Library. Mechanics of Cohesive-frictional Materials 7 511–534
[67] Vermeer, PA and Verruijt, A. (1981) "An accuracy condition for consolidation by finite elements", Volume 5. Wiley Online Library. International Journal for Numerical and Analytical Methods in Geomechanics 1 1–14
[68] Pastor, M and Li, T and Liu, X and Zienkiewicz, O. C. (1999) "Stabilized low-order finite elements for failure and localization problems in undrained soils and foundations", Volume 174. Elsevier. Computer Methods in Applied Mechanics and Engineering 1-2 219–234
[69] Bochev, Pavel B and Dohrmann, Clark R and Gunzburger, Max D. (2006) "Stabilization of low-order mixed finite elements for the Stokes equations", Volume 44. SIAM. SIAM Journal on Numerical Analysis 1 82–101
[70] White, Joshua A and Borja, Ronaldo I. (2008) "Stabilized low-order finite elements for coupled solid-deformation/fluid-diffusion and their application to fault zone transients", Volume 197. Elsevier. Computer Methods in Applied Mechanics and Engineering 49 4353–4366
[71] Preisig, Matthias and Prévost, Jean H. (2011) "Stabilization procedures in coupled poromechanics problems: A critical assessment", Volume 35. Wiley Online Library. International Journal for Numerical and Analytical Methods in Geomechanics 11 1207–1225
[72] Sun, WaiChing and Ostien, Jakob T. and Salinger, Andrew G. (2013) "A stabilized assumed deformation gradient finite element formulation for strongly coupled poromechanical simulations at finite strain", Volume 37. International Journal for Numerical and Analytical Methods in Geomechanics 16 2755–2788
[73] Dohrmann, Clark R and Bochev, Pavel B. (2004) "A stabilized finite element method for the Stokes problem based on polynomial pressure projections", Volume 46. Wiley Online Library. International Journal for Numerical Methods in Fluids 2 183–201
[74] Cui, W. and Gawecka, K. A. and Taborda, D. M. G. and Potts, D. M. and Zdravkovi, L. (2016) "Time-step constraints in transient coupled finite element analysis", Volume 106. International Journal for Numerical Methods in Engineering 12 953–971
[75] Isaac Harari. (2004) "Stability of semidiscrete formulations for parabolic problems at small time steps", Volume 193. Computer Methods in Applied Mechanics and Engineering 15 1491 - 1516
[76] Sloan, S. W. and Abbo, A. J. and Sheng, D. (2001) "Refined explicit integration of elastoplastic models with automatic error control", Volume 18. Engineering Computations 1-2 121-194
[77] Hashiguchi, Koichi and Yamakawa, Yuki. (2012) "Introduction to finite strain theory for continuum elasto-plasticity". John Wiley & Sons
[78] Montáns, Francisco Javier and Bathe, Klaus-Jürgen. (2005) "Computational issues in large strain elasto-plasticity: an algorithm for mixed hardening and plastic spin", Volume 63. Wiley Online Library. International Journal for Numerical Methods in Engineering 2 159–196
[79] Sheng, D. and Nazem, M. and Carter, J. P. (2009) "Some computational aspects for solving deep penetration problems in geomechanics", Volume 44. Computational mechanics 4 549-561
[80] Kim, Do-Nyun and Montáns, Francisco Javier and Bathe, Klaus-Jürgen. (2009) "Insight into a model for large strain anisotropic elasto-plasticity", Volume 44. Springer. Computational Mechanics 5 651–668
[81] Armero, F. and Pérez-Foguet, A. (2002) "On the formulation of closest-point projection algorithms in elastoplasticity -Part I: The variational structure", Volume 53. International Journal for Numerical Methods in Engineering 2 297-329
[82] Rouainia, M. and Muir Wood, D. (2006) "Computational aspects in finite strain plasticity analysis of geotechnical materials", Volume 33. Elsevier. Mechanics Research Communications 2 123–133
[83] Simo, J.C. and Meschke, G. (1993) "A new class of algorithms for classical plasticity extended to finite strains. Application to geomaterials", Volume 11. Springer. Computational mechanics 4 253–278
[84] Borja, Ronaldo I and Tamagnini, Claudio. (1998) "Cam-Clay plasticity Part III: Extension of the infinitesimal model to include finite strains", Volume 155. Elsevier. Computer Methods in Applied Mechanics and Engineering 1-2 73–95
[85] Rouainia, M. and Muir Wood, D. (2000) "An implicit constitutive algorithm for finite strain Cam-clay elasto-plastic model", Volume 5. Wiley Online Library. Mechanics of Cohesive-frictional Materials 6 469–489
[86] Song, Xiaoyu and Borja, Ronaldo I. (2014) "Mathematical framework for unsaturated flow in the finite deformation range", Volume 97. Wiley Online Library. International Journal for Numerical Methods in Engineering 9 658–682
[87] Choo, Jinhyun and White, Joshua A and Borja, Ronaldo I. (2016) "Hydromechanical modeling of unsaturated flow in double porosity media", Volume 16. American Society of Civil Engineers. International Journal of Geomechanics 6 D4016002
[88] Pérez-Foguet, A. and Armero, F. (2002) "On the formulation of closest-point projection algorithms in elastoplasticity – part II: Globally convergent schemes", Volume 53. John Wiley & Sons, Ltd. International Journal for numerical Methods in Engineering 2 331–374
[89] Abbo, A. J. and Sloan, S. W. (1995) "A smooth hyperbolic approximation to the Mohr-Coulomb yield criterion", Volume 54. Computers & structures 3 427–441
[90] Potts, D. M. and Gens, A. (1985) "A critical assessment of methods of correcting for drift from the yield surface in elasto-plastic finite element analysis", Volume 9. Wiley Online Library. International Journal for Numerical and Analytical Methods in Geomechanics 2 149–159
[91] Soowski, Wojciech T and Hofmann, Matthias and Hofstetter, Günter and Sheng, Daichao and Sloan, Scott W. (2012) "A comparative study of stress integration methods for the Barcelona Basic Model", Volume 44. Elsevier. Computers and Geotechnics 22–33
[92] Lloret-Cabot, Martí and Sloan, Scott W and Sheng, Daichao and Abbo, Andrew J. (2016) "Error behaviour in explicit integration algorithms with automatic substepping", Volume 108. Wiley Online Library. International Journal for Numerical Methods in Engineering 9 1030–1053
[93] Soowski, Wojciech T and Gallipoli, Domenico. (2010) "Explicit stress integration with error control for the Barcelona Basic Model. Part II: Algorithms efficiency and accuracy", Volume 37. Elsevier. Computers and Geotechnics 1 68–81
[94] Borja, Ronaldo I and Sama, Kossi M and Sanz, Pablo F. (2003) "On the numerical integration of three-invariant elastoplastic constitutive models", Volume 192. Elsevier. Computer methods in applied mechanics and engineering 9-10 1227–1258
[95] Simo, J. C. and Ortiz, M. (1985) "A unified approach to finite deformation elastoplastic analysis based on the use of hyperelastic constitutive equations", Volume 49. Elsevier. Computer methods in applied mechanics and engineering 2 221–245
[96] Abbo, A. J. and Lyamin, A. V. and Sloan, S. W. and Hambleton, J. P. (2011) "A C2 continuous approximation to the Mohr–Coulomb yield surface", Volume 48. Elsevier. International Journal of solids and Structures 21 3001–3010
[97] G. T. Houlsby and A. Amorosi and E. Rojas. (2005) "Elastic moduli of soils dependent on pressure: a hyperelastic formulation", Volume 55. Géotechnique 5 383-392
[98] Panteghini, Andrea and Lagioia, Rocco. (2014) "A fully convex reformulation of the original Matsuoka–Nakai failure criterion and its implicit numerically efficient integration algorithm", Volume 38. International Journal for Numerical and Analytical Methods in Geomechanics 6 593–614
[99] Oliver, J and Huespe, A. E. and Cante, J. C. (2008) "An implicit/explicit integration scheme to increase computability of non-linear material and contact/friction problems", Volume 197. Elsevier. Computer Methods in Applied Mechanics and Engineering 21 1865–1889
[100] Kloosterman, G. (2002) "Contact Methods in Finite Element Simulations". Ph.D. Thesis, Universiteit Twente.
[101] Sabetamal, H and Nazem, M and Sloan, S W and Carter, J P. (2016 b) "Frictionless contact formulation for dynamic analysis of nonlinear saturated porous media based on the mortar method", Volume 40. Wiley Online Library. International Journal for Numerical and Analytical Methods in Geomechanics 1 25–61
[102] Sabetamal, H and Carter, J P and Nazem, M and Sloan, S W. (2016 a) "Coupled analysis of dynamically penetrating anchors", Volume 77. Elsevier. Computers and Geotechnics 26–44
[103] J. Oliver and S. Hartmann and J.C. Cante and R. Weyler and J.A. Hernández. (2009) "A contact domain method for large deformation frictional contact problems. Part 1: Theoretical basis", Volume 198. Computer Methods in Applied Mechanics and Engineering 33 2591 - 2606
[104] S. Hartmann and J. Oliver and R. Weyler and J.C. Cante and J.A. Hernández. (2009) "A contact domain method for large deformation frictional contact problems. Part 2: Numerical aspects", Volume 198. Computer Methods in Applied Mechanics and Engineering 33 2607 - 2631
[105] Sheng, D. and Eigenbrod, K. D. and Wriggers, P. (2005) "Finite element analysis of pile installation using large-slip frictional contact", Volume 32. Computers and Geotechnics 1 17-26
[106] Wriggers, P. (1995) "Finite element algorithms for contact problems", Volume 2. Archives of Computational Methods in Engineering 4 1-49
[107] Zavarise, Giorgio and De Lorenzis, Laura. (2009) "A modified node-to-segment algorithm passing the contact patch test", Volume 79. John Wiley Sons, Ltd. International Journal for Numerical Methods in Engineering 4 379–416
[108] Einav, I and Randolph, M. F. (2005) "Combining upper bound and strain path methods for evaluating penetrometer resistance", Volume 63. International Journal for Numerical Methods in Engineering 14 1991-2016
[109] Potts, David M and Zdravkovi, Lidija. (2001) "Finite element analysis in geotechnical engineering". Thomas Telford
[110] Babuska, Ivo. (1971) "Error-bounds for finite element method", Volume 16. Springer. Numerische Mathematik 4 322–333
[111] Brezzi, Franco. (1974) "On the existence, uniqueness and approximation of saddle-point problems arising from Lagrangian multipliers", Volume 8. EDP Sciences. Revue francaise d'automatique, informatique, recherche opérationnelle. Analyse numérique R2 129–151
[112] Bathe, Klaus-Jürgen. (2001) "The inf–sup condition and its evaluation for mixed finite element methods", Volume 79. Elsevier. Computers & structures 2 243–252
[113] Taylor, Cedric and Hood, Paul. (1973) "A numerical solution of the Navier–Stokes equations using the finite element technique", Volume 1. Elsevier. Computers & Fluids 1 73–100
[114] Raviart, Pierre-Arnaud and Thomas, Jean-Marie. (1977) "A mixed finite element method for 2-nd order elliptic problems". Mathematical aspects of finite element methods. Springer 292–315
[115] Truty, Andrzej and Zimmermann, Thomas. (2006) "Stabilized mixed finite element formulations for materially nonlinear partially saturated two-phase media", Volume 195. Elsevier. Computer methods in applied mechanics and engineering 13 1517–1546
[116] Oñate, Eugenio and Rojek, Jerzy and Taylor, Robert L and Zienkiewicz, Olgierd C. (2004) "Finite calculus formulation for incompressible solids using linear triangles and tetrahedra", Volume 59. Wiley Online Library. International Journal for Numerical Methods in Engineering 11 1473–1500
[117] Sun, WaiChing and Chen, Qiushi and Ostien, Jakob T. (2014) "Modeling the hydro-mechanical responses of strip and circular punch loadings on water-saturated collapsible geomaterials", Volume 9. Springer. Acta Geotechnica 5 903–934
[118] de Souza Neto, E. A. and Peri, D and Dutko, M and Owen, D. R. J. (1996) "Design of simple low order finite elements for large strain analysis of nearly incompressible solids", Volume 33. Elsevier. International Journal of Solids and Structures 20-22 3277–3296
[119] de Souza Neto, E. A. and Andrade Pires, F. M. and Owen, D. R. J. (2005) "F-bar-based linear triangles and tetrahedra for finite strain analysis of nearly incompressible solids. Part I: formulation and benchmarking", Volume 62. Wiley Online Library. International Journal for Numerical Methods in Engineering 3 353–383
[120] Zienkiewicz, O. C. and Taylor, R. L. (2000) "The finite element method: Solid mechanics (Vol. 2)". Butterworth-Heinemann
[121] Borja, Ronaldo I and Tamagnini, Claudio and Alarcón, Enrique. (1998) "Elastoplastic consolidation at finite strain part 2: finite element implementation and numerical examples", Volume 159. Elsevier. Computer Methods in Applied Mechanics and Engineering 1-2 103–122
[122] Robertson, P. K. (2009) "Interpretation of cone penetration tests – a unified approach", Volume 46. NRC Research Press. Canadian geotechnical journal 11 1337–1355
[123] Sheng, D. and Kelly, R. and Pineda, J. and Bates, L. (2014) "Numerical study of rate effects in cone penetration test". 3rd International Symposium on Cone Penetration Testing
[124] Krabbenhoft, K. and Lyamin, A. V. (2015) "Generalised Tresca criterion for undrained total stress analysis", Volume 5. Géotechnique Letters 313-317
[125] Monforte, L and Carbonell, J. M. and Arroyo, M and Gens, A. (2016) "Performance of mixed formulations for the Particle Finite Element Method in soil mechanics problems". (submitted)
[126] Monforte, L. and Arroyo, M. and Gens, A. and Carbonell, J.M. (2014) "Explicit finite deformation stress integration of the elasto-plastic constitutive equations". 14th IACMAG Kyoto
[127] da Silva, M. V. and Krabbenhoft, K. and Lyamin, A. V. and Sloan, S. W. (2011) "Rigid-plastic large-deformation analysis of geotechnical penetration problems". Proceedings of 13th IACMAG conference, Vol. 1. Computer Methods for Geomechanics: Frontiers and New Applications (Khalili & Oeser Eds) 42–47
[128] Gourvenec, S. M. and Mana, D. S. K. (2011) "Undrained vertical bearing capacity factors for shallow foundations", Volume 1. Géotechnique Letters 4 101-108
[129] C. X. Wang and J. P. Carter. (2002) "Deep Penetration of Strip and Circular Footings into Layered Clays", Volume 2. International Journal of Geomechanics 2 205-232
[130] L. Yu and J. Liu and X.J. Kong and Y. Hu. (2008) "Three-dimensional RITSS large displacement finite element method for penetration of foundations into soil", Volume 35. Computers and Geotechnics 3 372 - 382
[131] Gang Qiu and Sascha Henke and Jürgen Grabe. (2011) "Application of a Coupled Eulerian-Lagrangian approach on geomechanical problems involving large deformations", Volume 38. Computers and Geotechnics 1 30 - 39
[132] Randolph, M. and Andersen, K. (2006) "Numerical Analysis of T-Bar Penetration in Soft Clay.", Volume 6. Int. J. Geomech. 6 411-420
[133] Lu, Q. and Hu, Y. and Randolph, M. F. (2000) "FE analysis for T-bar and spherical penetrometers in cohesive soil". The Tenth International Offshore and Polar Engineering Conference. International Society of Offshore and Polar Engineers
[134] Teh, C. I. and Houlsby, G. T. (1991) "An analytical study of the cone penetration test in clay", Volume 41. Géotechnique 1 17-34
[135] van den Berg, P. (1994) "Analysis of soil penetration". Ph.D. Thesis, TU Delft
[136] Beuth, L. (2012) "Formulation and application of a quasi-static material point method". Ph.D. Thesis, University of Sturttgart, Germany
[137] Hvorslev, Mikael Juul. (1949) "Subsurface exploration and sampling of soils for civil engineering purposes". Report on a Research project of the American Society of Civil Engineers
[138] Baligh, M. M. and Azzouz, A. S. and Chin, C. T. (1987) "Disturbance due to "ideal" tube sampling", Volume 113. Journal of Geotechnical Engineering 7 739-757
[139] Clayton, C. R. I. and Siddique, A and Hopper, R. J. (1998) "Effects of sampler design on tube sampling disturbance – numerical and analytical investigations", Volume 48. Thomas Telford Ltd. Géotechnique 6 847–867
[140] Siddique, Abu and Farooq, Sultan M and Clayton, C R I. (2000) "Disturbances due to tube sampling in coastal soils", Volume 126. American Society of Civil Engineers. Journal of Geotechnical and Geoenvironmental Engineering 6 568–575
[141] C. R. I. Clayton and A. Siddique. (1999) "Tube sampling disturbance – forgotten truths and new perspectives", Volume 137. Proceedings of the Institution of Civil Engineers - Geotechnical Engineering 3 127-135
[142] DeGroot, Don J and Poirier, Steven E and Landon, Melissa M. (2005) "Sample disturbance – soft clays.", Volume 27. Studia Geotechnica et Mechanica 3-4 91-105
[143] Terzariol, M. and Santamarina, J. C. (2017) "Methane Hydrates: Sampling and Pressure Core Technology". Proceedings of the 19th International Conference on Soil Mechanics and Geotechnical Engineering
[144] Dai, Sheng and Santamarina, J Carlos. (2014) "Sampling disturbance in hydrate-bearing sediment pressure cores: NGHP-01 expedition, Krishna–Godavari Basin example", Volume 58. Elsevier. Marine and Petroleum Geology 178–186
[145] Baligh, M. M. (1985) "Strain path method", Volume 111. Journal of Geotechnical Engineering 9 1108-1136
[146] Sagaseta, C and Whittle, A J and Santagata, M. (1997) "Deformation analysis of shallow penetration in clay", Volume 21. Wiley Online Library. International Journal for Numerical and Analytical Methods in Geomechanics 10 687–719
[147] Alonso, E. E. and Oñate, E. and Casanovas, J. S. (1981) "An investigation into sampling disturbance", Volume 2. Proch 10th Int. Conf. Soil Mech. Found. Eng. 423-426
[148] Budhu, Muniram and Wu, Chang S. (1992) "Numerical analysis of sampling disturbances in clay soils", Volume 16. Wiley Online Library. International Journal for Numerical and Analytical Methods in Geomechanics 7 467–492
[149] Hover, E. D. and Ni, Q. and Guymer, I. (2013) "Investigation of centreline strain path during tube penetration using transparent soil and particle image velocimetry", Volume 3. Thomas Telford Ltd. Géotechnique Letters 2 37–41
[150] Hover, E. D. (2014) "The investigation of tube sampling disturbance using transparent soil and particle image velocimetry". Ph.D. Thesis, University of Warwick
[151] Cai, Fei and Ugai, Keizo and Hagiwara, Toshiyuki. (2002) "Base stability of circular excavations in soft clay", Volume 128. American Society of Civil Engineers. Journal of Geotechnical and Geoenvironmental Engineering 8 702–706
[152] Kutter, Bruce L. (1995) "Recent advances in centrifuge modeling of seismic shaking". International Conferences on Recent Advances in Geotechnical Earthquake Engineering and Soil Dynamics 927-941
[153] Idinger, Gregor and Aklik, Pelin and Wu, Wei and Borja, Ronaldo I. (2011) "Centrifuge model test on the face stability of shallow tunnel", Volume 6. Acta Geotechnica 2 105–117
[154] Garino, C and Ponthot, J. P. and Mirasso, A and Koeune, R and Jeunechamps, P. P. and Cargelio, C. (2006) "Numerical simulation of large strain rate dependent J2 problems", Volume 25. Mecánica Computacional 1927–1946
[155] Booker, J. R. and Small, J. C. (1986) "The behaviour of an impermeable flexible raft on a deep layer of consolidating soil", Volume 10. Wiley Online Library. International Journal for Numerical and Analytical Methods in Geomechanics 3 311–327
[156] Obrzud, Rafa F and Truty, Andrzej and Vulliet, Laurent. (2011) "Numerical modeling and neural networks to identify model parameters from piezocone tests: I. FEM analysis of penetration in two-phase continuum", Volume 35. Wiley Online Library. International Journal for Numerical and Analytical Methods in Geomechanics 16 1703–1730
[157] Obrzud, Rafa F and Truty, Andrzej and Vulliet, Laurent. (2012) "Numerical modeling and neural networks to identify model parameters from piezocone tests: II. Multi-parameter identification from piezocone data", Volume 36. Wiley Online Library. International Journal for Numerical and Analytical Methods in Geomechanics 6 743–779
[158] Yi, J. T. and Goh, S. H. and Lee, F. H. and Randolph, M. F. (2012) "A numerical study of cone penetration in fine-grained soils allowing for consolidation effects", Volume 62. ICE Publishing. Géotechnique 8 707-719
[159] Tsubakihara, YASUNORI and Kischida, HIDEAKI and Nishiyama, TAKASHI. (1993) "Friction between cohesive soils and steel", Volume 33. Soils and Foundations 2 145–156
[160] Ceccato, F. and Beuth, L. and Vermeer, P. A. and Simonini, P. (2016b) "Two-phase Material Point Method applied to the study of cone penetration", Volume 80. Computers and Geotechnics 440-452
[161] Ceccato, Francesca and Beuth, Lars and Simonini, Paolo. (2016a) "Analysis of piezocone penetration under different drainage conditions with the two-phase material point method", Volume 142. American Society of Civil Engineers. Journal of Geotechnical and Geoenvironmental Engineering 12 04016066
[162] Lunne, T and Robertson, P. K. and Powell, J. J. (1997) "Cone penetration testing in geotechnical practice". Blackie Academic
[163] Randolph, M. F. and Hope, S. (2004) "Effect of cone velocity on cone resistance and excess pore pressures". Int. Symp. on Engineering Practice and Performance of Soft Deposits 147–152
[164] Mahmoodzadeh, H and Randolph, M. F. and Wang, D. (2014) "Numerical simulation of piezocone dissipation test in clays", Volume 64. Thomas Telford Ltd. Géotechnique 8 657–666
[165] DeJong, Jason T and Randolph, Mark R. (2012) "Influence of partial consolidation during cone penetration on estimated soil behavior type and pore pressure dissipation measurements", Volume 138. American Society of Civil Engineers. Journal of Geotechnical and Geoenvironmental Engineering 7 777–788
[166] Lunne, Tom. (2012) "The Fourth James K. Mitchell Lecture: The CPT in offshore soil investigations – a historic perspective", Volume 7. Taylor andFrancis. Geomechanics and Geoengineering 2 75-101
[167] Lunne, Tom and Andersen, Kunt H. (2007) "Soft clay shear strength parameters for deepwater geotechnical design". Society of Underwater Technology. Offshore site investigation and geotechnics, confronting new challenges and sharing knowledge
[168] Jáki, J. (1944) "The coerfficient of earth pressure at rest". Journal for Society of Hungarian Architects and Engineers 355-358
[169] Mayne, Paul W and Kulhawy, Fred H. (1982) "Ko-OCR relationships in soil", Volume 108. Journal of the Soil Mechanics and Foundations Division 6 851–872
[170] Leonards, G. A. and Frost, J. D. (1988) "Settlement of shallow foundations on granular soils", Volume 114. American Society of Civil Engineers. Journal of Geotechnical Engineering 7 791–809
[171] P. K. Robertson. (1990) "Soil classification using the cone penetration test", Volume 27. Canadian Geotechnical Journal 1 151-158
[172] P. K. Robertson and K. L. Cabal. (2015) "Guide to Cone Penetration Testing for Geotechnical Engineering". Gregg Drilling & Testing, Inc.
[173] Robertson, P. K. (2012) "The James K. Mithcell Lecture: Interpretation of in-situ tests – some insights". Proc. 4th Int. Conf. on Geotechnical and Geophysical Site Characterization–ISC'4. Taylor & Francis 3–24
[174] Sandven, R. (2010) "Influence of test equipment and procedures on obtained accuray in CPTu". 2rd International Symposium on Cone Penetration Testing.
[175] Cabal, K. and Robertson, P. K. (2014) "Accuracy and repeatability of CPT sleeve friction measurements". 3rd International Symposium on Cone Penetration Testing.
[176] Kardan, C. and Viking, K. and Nik, L. and Larsson, S. (2016) "Influence of opearator performance on quality of CPTu results". Proceedings of the 17th Nordic Geotechnical Meeting.
[177] James A. Schneider and Mark F. Randolph and Paul W. Mayne and Nicholas R. Ramsey. (2008) "Analysis of Factors Influencing Soil Classification Using Normalized Piezocone Tip Resistance and Pore Pressure Parameters", Volume 134. Journal of Geotechnical and Geoenvironmental Engineering 11 1569-1586
[178] Robertson, Peter K. (2010) "Estimating in-situ soil permeability from CPT & CPTu". 2nd International Symposium on Cone Penetration Testing
[179] Torstensson, B A. (1977) "The pore pressure probe". Nordiske Geotekniske Mote 1–15
[180] Baligh, Mohsen M and Levadoux, Jacques-Noel. (1986) "Consolidation after undrained piezocone penetration. II: Interpretation", Volume 112. American Society of Civil Engineers. Journal of geotechnical engineering 7 727–745
[181] Parez, L and Fauriel, R. (1988) "Le piézocone améliorations apportées a la reconnaissance des sols". Revue francaise de géotechnique 44 13–27
[182] Mayne, Paul W. (2007) "Cone penetration testing", Volume 368. Transportation Research Board
[183] Robertson, P K and Sully, J P and Woeller, D J and Lunne, T and Powell, J J M and Gillespie, D G. (1992) "Estimating coefficient of consolidation from piezocone tests", Volume 29. NRC Research Press. Canadian Geotechnical Journal 4 539–550
[184] Schnaid, F and Sills, G. C. and Soares, J. M. and Nyirenda, Z. (1997) "Predictions of the coefficient of consolidation from piezocone tests", Volume 34. NRC Research Press. Canadian Geotechnical Journal 2 315–327
[185] Elsworth, Derek and Lee, Dae Sung. (2005) "Permeability determination from on-the-fly piezocone sounding", Volume 131. American Society of Civil Engineers. Journal of Geotechnical and GeoEnvironmental Engineering 5 643–653
[186] Elsworth, D and Lee, D S. (2007) "Limits in determining permeability from on-the-fly uCPT sounding", Volume 57. Thomas Telford Ltd. Géotechnique 8 679–685
[187] Chai, J C and Agung, P M A and Hino, Takenori and Igaya, Yutaka and Carter, John P. (2011) "Estimating hydraulic conductivity from piezocone soundings", Volume 61. Thomas Telford Ltd. Géotechnique 8 699–708
[188] Shen, S.-L. and Wang, J.-P. and Wu, H.-N. and Xu, Y.-S. and Ye, G.-L. and Yin, Z.-Y. (2015) "Evaluation of hydraulic conductivity for both marine and deltaic deposits based on piezocone testing", Volume 110. Elsevier. Ocean Engineering 174–182
[189] Elsworth, Derek. (1993) "Analysis of piezocone dissipation data using dislocation methods", Volume 119. American Society of Civil Engineers. Journal of Geotechnical Engineering 10 1601–1623
[190] Chai, J. and Chanmee, N. (2017) "A modified method for estimating the permeability of clayey soils based on piezocone sounding results". Canadian Geotechnical Journal accepted
[191] Parolini, C. (2016) "CPT and dissipation test. Simulation through PFEM". Master Thesis, Politecnico di Milano.
[192] Ming-Fang Chang and Cee Ing Teh and LaiFa Cao. (1999) "Critical state strength parameters of saturated clays from the modified Cam clay model", Volume 36. Canadian Geotechnical Journal 5 876-890
[193] Schneider, James A and Lehane, Barry M and Schnaid, Fernando. (2007) "Velocity effects on piezocone measurements in normally and over consolidated clays", Volume 7. Thomas Telford Ltd-ICE Virtual Library. International Journal of Physical Modelling in Geotechnics 2 23–34
[194] DeJong, J T and Jaeger, R A and Boulanger, R W and Randolph, M F and Wahl, D A J. (2013) "Variable penetration rate cone testing for characterization of intermediate soils", Volume 4. 4th International Site Characterization Conference 25–42
[195] Beissel, Stephen and Belytschko, Ted. (1996) "Nodal integration of the element-free Galerkin method", Volume 139. Elsevier. Computer methods in applied mechanics and engineering 1-4 49–74
[196] Chen, Jiun-Shyan and Wu, Cheng-Tang and Yoon, Sangpil and You, Yang. (2001) "A stabilized conforming nodal integration for Galerkin mesh-free methods", Volume 50. Wiley Online Library. International Journal for Numerical Methods in Engineering 2 435–466
[197] Puso, MA and Solberg, J. (2006) "A stabilized nodally integrated tetrahedral", Volume 67. Wiley Online Library. International Journal for Numerical Methods in Engineering 6 841–867
[198] Puso, MA and Chen, JS and Zywicz, E and Elmer, W. (2008) "Meshfree and finite element nodal integration methods", Volume 74. Wiley Online Library. International Journal for Numerical Methods in Engineering 3 416–446
[199] Zhang, Wei and Yuan, Weihai and Dai, Beibing. (2018) "Smoothed Particle Finite-Element Method for Large-Deformation Problems in Geomechanics", Volume 18. American Society of Civil Engineers. International Journal of Geomechanics 4 04018010-01-12
[200] M. F. Randolph and S. A. Stanier and C. D. O’Loughlin and S. H. Chow and B. Bienen and J. P. Doherty and H. Mohr and R. Ragni and M.A. Schneider and White, D. J. and Schneider, J. A. (2018) "Penetrometer equipment and testing techniques for offshore design of foundation, anchors and pipelines". Cone Penetration Testing 2018 3 – 23
[201] Gajo, A. and Saetta, A. and Vitaliani, R. (1996) "SILENT BOUNDARY CONDITIONS FOR WAVE PROPAGATION IN SATURATED POROUS MEDIA", Volume 20. International Journal for Numerical and Analytical Methods in Geomechanics 4 253-273
[202] Al-Tabbaa, A and Wood, D Muir. (1987) "Some measurements of the permeability of kaolin", Volume 37. Thomas Telford Ltd. Géotechnique 4 499–514
[203] R. W. Boulanger and J. T. DeJong. (2018) "Inverse filtering procedure to correct cone penetration data for thin-layer and transition effects". Cone Penetration Testing 2018 25 – 44
[204] Z. Mynarek and S. Gogolik and J. Pótorak. (2012) "The effect of varied stiffness of soil layers on interpretation of CPTU penetration characteristics", Volume 12. Archives of Civil and Mechanical Engineering 2 253 - 264
[205] Gens, A. and Nova, R. (1993) "Conceptual bases for a constitutive model for bonded soils and weak rocks". Geomechanical Engineering of Hard Soils-Soft Rocks
[206] Rouainia, M. and Muir Wood, D. (1999) "A kinematic hardening constitutive model for natural clays with loss of structure", Volume 50. Géotechnique 2 315-321
[207] Dávalos, César Emilio. (2014) "Particle finite element methods for modelling granular material flows". Ph.D. Thesis, Universitat Politecnica de Catalunya
[208] Skempton, A. W. (1951) "The bearing capacity of clays". Building Research Congress, London. The Institution of Civil Engineering 180-189
[209] B. Wang and M. A. Hicks and P. J. Vardon. (2016) "Slope failure analysis using the random material point method", Volume 6. Géotechnique Letters 2 113-118
[210] Iaconeta, Ilaria and Larese, Antonia and Rossi, Riccardo and Guo, Zhiming. (2017) "Comparison of a Material Point Method and a Galerkin Meshfree Method for the Simulation of Cohesive-Frictional Materials", Volume 10. Materials 10
[211] Navas, Pedro and Rena, C Yu and López-Querol, Susana and Li, Bo. (2016) "Dynamic consolidation problems in saturated soils solved through u–w formulation in a LME meshfree framework", Volume 79. Elsevier. Computers and Geotechnics 55–72
[212] Blanc, T. and Pastor, M. (2013) "A stabilized Smoothed Particle Hydrodynamics, Taylor-Galerkin algorithm for soil dynamics problems", Volume 37. International Journal for Numerical and Analytical Methods in Geomechanics 1 1–30
[213] Brown, Peter T. (1978) "Stiff rectangular rafts subject to concentrated loads", Volume G8. Australian Geomechanics Journal 40–49
Document information
Published on 26/08/19
Submitted on 26/08/19
Licence: CC BY-NC-SA license
Share this document
claim authorship
Are you one of the authors of this document?
