| (25 intermediate revisions by the same user not shown) | |||
| Line 1: | Line 1: | ||
| − | + | Pulished in ''Bytes and Science'', G. Zavarise and D. Boso (Eds.), pp. 119 - 130, CIMNE, Barcelona Spain, 2012 | |
| − | + | ||
| − | + | ||
| − | ''' | + | |
| − | + | ||
| − | + | ||
| − | + | ||
| − | + | ||
| − | + | ||
| − | + | ||
| − | + | ||
| − | + | ||
| − | + | ||
| − | + | ||
| − | + | ||
| − | + | ||
| − | + | ||
==Abstract== | ==Abstract== | ||
| Line 41: | Line 25: | ||
{| class="floating_imageSCP" style="text-align: center; border: 1px solid #BBB; margin: 1em auto; width: 100%;max-width: 100%;" | {| class="floating_imageSCP" style="text-align: center; border: 1px solid #BBB; margin: 1em auto; width: 100%;max-width: 100%;" | ||
|- | |- | ||
| − | |[[Image:Draft_Samper_534298620-Figure2_con276.png| | + | |[[Image:Draft_Samper_534298620-Figure2_con276.png|400px|Sequence of steps to update a “cloud” of nodes representing a domain containing a fluid and a solid from time n (tₙ) to time n+2 (tₙ+2∆t) ]] |
|- style="text-align: center; font-size: 75%;" | |- style="text-align: center; font-size: 75%;" | ||
| colspan="1" | '''Figure 1:''' Sequence of steps to update a “cloud” of nodes representing a domain containing a fluid and a solid from time <math>n</math> (<math>t_n</math>) to time <math>n+2</math> (<math>t_n +2\Delta t</math>) | | colspan="1" | '''Figure 1:''' Sequence of steps to update a “cloud” of nodes representing a domain containing a fluid and a solid from time <math>n</math> (<math>t_n</math>) to time <math>n+2</math> (<math>t_n +2\Delta t</math>) | ||
| Line 207: | Line 191: | ||
In Eqs.([[#eq-7|7]])-([[#eq-9|9]]) <math display="inline">\bar{(\cdot )}</math> denotes nodal variables, <math display="inline">\dot{\bar{(\cdot )}}= {\partial \over \partial t}\bar{(\cdot )}</math>. The different matrices and vectors are given in <span id='citeF-6'></span><span id='citeF-11'></span><span id='citeF-13'></span>[[#cite-6|[6]],[[#cite-11|11]],[[#cite-13|13]]]. | In Eqs.([[#eq-7|7]])-([[#eq-9|9]]) <math display="inline">\bar{(\cdot )}</math> denotes nodal variables, <math display="inline">\dot{\bar{(\cdot )}}= {\partial \over \partial t}\bar{(\cdot )}</math>. The different matrices and vectors are given in <span id='citeF-6'></span><span id='citeF-11'></span><span id='citeF-13'></span>[[#cite-6|[6]],[[#cite-11|11]],[[#cite-13|13]]]. | ||
| − | The solution in time of Eqs.([[#eq-7|7]])-([[#eq-9|9]]) can be performed using any time integration scheme typical of the updated Lagrangian FEM <span id='citeF-17'></span>[[#cite-17|[17]]]. A basic algorithm following the process described in Section 2 is presented in Box [[#Box-1|I]]. | + | The solution in time of Eqs.([[#eq-7|7]])-([[#eq-9|9]]) can be performed using any time integration scheme typical of the updated Lagrangian FEM <span id='citeF-17'></span>[[#cite-17|[17]]]. A basic algorithm following the process described in Section [[#section-2|2]] is presented in Box [[#Box-1|I]]. |
<span id="Box-1"></span> | <span id="Box-1"></span> | ||
| Line 221: | Line 205: | ||
<math display="inline">^{t} \bar{\boldsymbol x},{}^{t} \bar{\boldsymbol v},{}^{t} \bar{\boldsymbol p},{}^{t} \bar{\boldsymbol \pi },{}^{t} \bar{T},{}^{t} \mu ,{}^{t}{\boldsymbol f},{}^{t}\mathbf{ q},{}^{t} C,{}^{t} V,{}^{t} M</math> | <math display="inline">^{t} \bar{\boldsymbol x},{}^{t} \bar{\boldsymbol v},{}^{t} \bar{\boldsymbol p},{}^{t} \bar{\boldsymbol \pi },{}^{t} \bar{T},{}^{t} \mu ,{}^{t}{\boldsymbol f},{}^{t}\mathbf{ q},{}^{t} C,{}^{t} V,{}^{t} M</math> | ||
| + | <span id='section-2'></span> | ||
2. LOOP OVER NUMBER OF ITERATIONS, <math display="inline">i=1</math>, NITER | 2. LOOP OVER NUMBER OF ITERATIONS, <math display="inline">i=1</math>, NITER | ||
| − | <math display="inline">\bullet </math> Compute nodal velocities by solving Eq.(8) | + | <math display="inline">\bullet </math> Compute nodal velocities by solving Eq.([[#eq-8|8]]) |
<math display="inline">\displaystyle \left[\frac{1}{\Delta t} \mathbf{M}+\mathbf{K}\right]{}^{t+1} \bar{\boldsymbol v}^{i+1} ={}^{t+1} \mathbf{f} - {\boldsymbol G}^{t+1} {\boldsymbol p}^{i} +\frac{1}{\Delta t} \mathbf{M} {}^{t} \bar{\boldsymbol v}</math> | <math display="inline">\displaystyle \left[\frac{1}{\Delta t} \mathbf{M}+\mathbf{K}\right]{}^{t+1} \bar{\boldsymbol v}^{i+1} ={}^{t+1} \mathbf{f} - {\boldsymbol G}^{t+1} {\boldsymbol p}^{i} +\frac{1}{\Delta t} \mathbf{M} {}^{t} \bar{\boldsymbol v}</math> | ||
| − | <math display="inline">\bullet </math> Compute nodal pressures from Eq.(9) | + | <math display="inline">\bullet </math> Compute nodal pressures from Eq.([[#eq-9|9]]) |
<math display="inline">\displaystyle \left[\frac{1}{\Delta t}\bar {\boldsymbol M}-{\boldsymbol L}\right]{}^{t+1} \bar{\boldsymbol p}^{i+1} =\mathbf{G}{}^{T} {}^{t+1} \bar{\boldsymbol v}^{i+1} + \mathbf{Q}{}^{t+1} \bar{\boldsymbol \pi }^{i} +\frac{1}{\Delta t}\bar {\boldsymbol M} {}^t\bar{\boldsymbol p} </math> | <math display="inline">\displaystyle \left[\frac{1}{\Delta t}\bar {\boldsymbol M}-{\boldsymbol L}\right]{}^{t+1} \bar{\boldsymbol p}^{i+1} =\mathbf{G}{}^{T} {}^{t+1} \bar{\boldsymbol v}^{i+1} + \mathbf{Q}{}^{t+1} \bar{\boldsymbol \pi }^{i} +\frac{1}{\Delta t}\bar {\boldsymbol M} {}^t\bar{\boldsymbol p} </math> | ||
| − | <math display="inline">\bullet </math> Compute nodal pressure gradient projections from Eq.(10) | + | <math display="inline">\bullet </math> Compute nodal pressure gradient projections from Eq.([[#eq-10|10]]) |
<math display="inline">{}^{n+1} \bar{\boldsymbol \pi }^{i+1} =-\hat{\boldsymbol M}^{-1}_{D} \left[\mathbf{Q}^{T} \right]{}^{t+1} \bar{\boldsymbol p}^{i+1} \begin{array}{ccc} {} & {,} & {\hat{\boldsymbol M}_{D} =diag\left[\hat{\boldsymbol M}_{D} \right]} \end{array}</math> | <math display="inline">{}^{n+1} \bar{\boldsymbol \pi }^{i+1} =-\hat{\boldsymbol M}^{-1}_{D} \left[\mathbf{Q}^{T} \right]{}^{t+1} \bar{\boldsymbol p}^{i+1} \begin{array}{ccc} {} & {,} & {\hat{\boldsymbol M}_{D} =diag\left[\hat{\boldsymbol M}_{D} \right]} \end{array}</math> | ||
| Line 247: | Line 232: | ||
Check convergence <math display="inline">\rightarrow </math> NO <math display="inline">\rightarrow </math> Next iteration <math display="inline">i\to i+1</math> | Check convergence <math display="inline">\rightarrow </math> NO <math display="inline">\rightarrow </math> Next iteration <math display="inline">i\to i+1</math> | ||
| − | <math display="inline">\downarrow </math> YES | + | <math display="inline">\downarrow </math> YES |
Next time step <math display="inline">t\to t+1</math> | Next time step <math display="inline">t\to t+1</math> | ||
| Line 266: | Line 251: | ||
For large 3D problems solved in a single processor Pentium IV PC, meshing consumes around 15% of the total CPU time for time step, while the solution of the equations (with typically 3 iterations to reach convergence per time step) and the assembly of the system consume approximately 70% and 15% of the CPU time per time step, respectively. Considerable speed can be gained using parallel computing techniques. | For large 3D problems solved in a single processor Pentium IV PC, meshing consumes around 15% of the total CPU time for time step, while the solution of the equations (with typically 3 iterations to reach convergence per time step) and the assembly of the system consume approximately 70% and 15% of the CPU time per time step, respectively. Considerable speed can be gained using parallel computing techniques. | ||
| − | Boundary nodes are recognized at mesh generation level <span id='citeF-5'></span><span id='citeF-10'></span>[[#cite-5|[5,10]]]. Considering that the nodes follow a variable <math display="inline">h(x)</math> distribution, where <math display="inline">h(x)</math> is typically the minimum distance between two nodes. ''All nodes on an empty sphere with a radius greater than <math>\alpha h</math>, are considered as boundary nodes''. Values of <math display="inline">\alpha </math> ranging of 1.4 have been found to be optimal. This criterion is coincident with the Alpha Shape <span id='citeF-2'></span>[[#cite-2|[2]]]. | + | Boundary nodes are recognized at mesh generation level <span id='citeF-5'></span><span id='citeF-10'></span>[[#cite-5|[5]],[[#cite-10|10]]]. Considering that the nodes follow a variable <math display="inline">h(x)</math> distribution, where <math display="inline">h(x)</math> is typically the minimum distance between two nodes. ''All nodes on an empty sphere with a radius greater than <math>\alpha h</math>, are considered as boundary nodes''. Values of <math display="inline">\alpha </math> ranging of 1.4 have been found to be optimal. This criterion is coincident with the Alpha Shape <span id='citeF-2'></span>[[#cite-2|[2]]]. |
The boundary recognition method is useful for detecting contact conditions between any fluid/solid or solid/solid interface. | The boundary recognition method is useful for detecting contact conditions between any fluid/solid or solid/solid interface. | ||
| Line 277: | Line 262: | ||
{| class="floating_imageSCP" style="text-align: center; border: 1px solid #BBB; margin: 1em auto; width: 100%;max-width: 100%;" | {| class="floating_imageSCP" style="text-align: center; border: 1px solid #BBB; margin: 1em auto; width: 100%;max-width: 100%;" | ||
|- | |- | ||
| − | |[[Image:Draft_Samper_534298620-Contact_conditions.png| | + | |[[Image:Draft_Samper_534298620-Contact_conditions.png|340px|Modelling contact conditions at a solid-solid interface with PFEM]] |
|- style="text-align: center; font-size: 75%;" | |- style="text-align: center; font-size: 75%;" | ||
| colspan="1" | '''Figure 2:''' Modelling contact conditions at a solid-solid interface with PFEM | | colspan="1" | '''Figure 2:''' Modelling contact conditions at a solid-solid interface with PFEM | ||
| Line 284: | Line 269: | ||
The contact between two solid interfaces is treated by introducing a layer of ''contact elements'' between the interacting interfaces. This layer is ''created during the mesh generation step'' by prescribing a minimum distance (<math display="inline">h_c</math>) between two solid boundaries. If the distance exceeds the minimum value (<math display="inline">h_c</math>) then the generated elements are treated as fluid elements. Otherwise the elements are treated as frictional contact elements (Figure [[#img-2|2]]). | The contact between two solid interfaces is treated by introducing a layer of ''contact elements'' between the interacting interfaces. This layer is ''created during the mesh generation step'' by prescribing a minimum distance (<math display="inline">h_c</math>) between two solid boundaries. If the distance exceeds the minimum value (<math display="inline">h_c</math>) then the generated elements are treated as fluid elements. Otherwise the elements are treated as frictional contact elements (Figure [[#img-2|2]]). | ||
| − | The algorithm can also be used effectively to model frictional contact conditions between rigid or elastic solids in structural mechanics applications <span id='citeF-1'></span><span id='citeF-15'></span>[[#cite-1|[1,15]]]. | + | The algorithm can also be used effectively to model frictional contact conditions between rigid or elastic solids in structural mechanics applications <span id='citeF-1'></span><span id='citeF-15'></span>[[#cite-1|[1]],[[#cite-15|15]]]. |
==6 MODELING OF BED EROSION== | ==6 MODELING OF BED EROSION== | ||
| Line 309: | Line 294: | ||
{| class="floating_imageSCP" style="text-align: center; border: 1px solid #BBB; margin: 1em auto; width: 100%;max-width: 100%;" | {| class="floating_imageSCP" style="text-align: center; border: 1px solid #BBB; margin: 1em auto; width: 100%;max-width: 100%;" | ||
|- | |- | ||
| − | |[[Image:Draft_Samper_534298620-Erosion-breakwater.png| | + | |[[Image:Draft_Samper_534298620-Erosion-breakwater.png|400px|Erosion of an unprotected shoulder of a breakwater due to sea waves]] |
|- style="text-align: center; font-size: 75%;" | |- style="text-align: center; font-size: 75%;" | ||
| colspan="1" | '''Figure 4:''' Erosion of an unprotected shoulder of a breakwater due to sea waves | | colspan="1" | '''Figure 4:''' Erosion of an unprotected shoulder of a breakwater due to sea waves | ||
|} | |} | ||
| − | |||
<div id='img-5'></div> | <div id='img-5'></div> | ||
{| class="floating_imageSCP" style="text-align: center; border: 1px solid #BBB; margin: 1em auto; width: 100%;max-width: 100%;" | {| class="floating_imageSCP" style="text-align: center; border: 1px solid #BBB; margin: 1em auto; width: 100%;max-width: 100%;" | ||
|- | |- | ||
|[[Image:Draft_Samper_534298620-erosion-camion2.png|600px|Erosion of soil mass due to waves and subsequent falling of lorry]] | |[[Image:Draft_Samper_534298620-erosion-camion2.png|600px|Erosion of soil mass due to waves and subsequent falling of lorry]] | ||
| − | |||
|- style="text-align: center; font-size: 75%;" | |- style="text-align: center; font-size: 75%;" | ||
| − | | | + | | colspan="1" | '''Figure 5:''' Erosion of soil mass due to waves and subsequent falling of lorry |
| + | |} | ||
| + | |||
| + | <div id='img-6'></div> | ||
| + | {| class="floating_imageSCP" style="text-align: center; border: 1px solid #BBB; margin: 1em auto; width: 100%;max-width: 100%;" | ||
|- | |- | ||
| − | | | + | |[[Image:Draft_Samper_534298620-Arrastre-casas1.png|300px|]] |
| + | |[[Image:Draft_Samper_534298620-Arrastre-casas3.png|300px|]] | ||
|- style="text-align: center; font-size: 75%;" | |- style="text-align: center; font-size: 75%;" | ||
| − | | colspan="2" | '''Figure | + | | colspan="2" | '''Figure 6:''' Simulation of landslide falling on constructions using PFEM |
|} | |} | ||
| − | Figure [[#img- | + | Figure [[#img-5|5]] shows a representative example of the progressive erosion of a soil mass adjacent to the shore due to sea waves and the subsequent falling into the sea of a 2D rigid object representing the section of a lorry. |
| − | <div id='img- | + | <div id='img-7'></div> |
{| class="floating_imageSCP" style="text-align: center; border: 1px solid #BBB; margin: 1em auto; width: 100%;max-width: 100%;" | {| class="floating_imageSCP" style="text-align: center; border: 1px solid #BBB; margin: 1em auto; width: 100%;max-width: 100%;" | ||
|- | |- | ||
| − | |[[Image:Draft_Samper_534298620-fig_9_01.png| | + | | (a) |
| − | |[[Image:Draft_Samper_534298620-fig_10_02.png| | + | |- |
| + | |[[Image:Draft_Samper_534298620-fig_9_01.png|400px|]] | ||
| + | |- | ||
| + | | (b) | ||
| + | |- | ||
| + | |[[Image:Draft_Samper_534298620-fig_10_02.png|400px|]] | ||
|- style="text-align: center; font-size: 75%;" | |- style="text-align: center; font-size: 75%;" | ||
| − | | colspan="2" | '''Figure | + | | colspan="2" | '''Figure 7:''' Lituya Bay landslide. (a) Left: Geometry. Right: Landslide direction and maximum wave level <span id='citeF-3'></span>[[#cite-3|[3]]]. (b) Landslide motion into reservoir obtained with PFEM. Maximum level of generated wave (551 mts) in north slope |
|} | |} | ||
| − | For other applications of the PFEM to bed erosion problems see <span id='citeF-12'></span><span id='citeF-16'></span>[[#cite-12|[12,16]]]. | + | For other applications of the PFEM to bed erosion problems see <span id='citeF-12'></span><span id='citeF-16'></span>[[#cite-12|[12]],[[#cite-16|16]]]. |
| − | The PFEM is particularly suited for modelling and simulation of landslides and their effect in the surrounding structures. Figure [[#img- | + | The PFEM is particularly suited for modelling and simulation of landslides and their effect in the surrounding structures. Figure [[#img-6|6]] shows an schematic 3D simulation of a landslide falling on adjacent constructions. The landslide material has been modelled as a viscous incompressible fluid. |
| − | In Figure [[#img- | + | In Figure [[#img-7|7]] we present some results of the 3D analysis of the landslide produced in Lituya Bay (Alaska) on July 9th 1958. The landslide was originated by an earthquake and movilized 90 millions tons of rocks that fell on the bay creating a large wave that reached a hight on the opposed slope of 524 mts. |
The sliding mass has been modelled as a quasi-incompressible continuum with a prescribed shear modulus. No frictional or erosion effects with the underneath soil have been considered. | The sliding mass has been modelled as a quasi-incompressible continuum with a prescribed shear modulus. No frictional or erosion effects with the underneath soil have been considered. | ||
| − | The maximum water level in north hill obtained with PFEM was 551 mts. This is 5% higher than the value of 524 mts. observed experimental <span id='citeF-3'></span>[[#cite-3|[3]]]. The maximum height location differs in 300 mts from the observed value. In the south slope the maximum water height observed was 208 mts, while the PFEM result (not shown here) was 195 mts (6% error). For more information on the PFEM solutions of this example see <span id='citeF-15'></span><span id='citeF-16'></span>[[#cite-15|[15,16]]]. | + | The maximum water level in north hill obtained with PFEM was 551 mts. This is 5% higher than the value of 524 mts. observed experimental <span id='citeF-3'></span>[[#cite-3|[3]]]. The maximum height location differs in 300 mts from the observed value. In the south slope the maximum water height observed was 208 mts, while the PFEM result (not shown here) was 195 mts (6% error). For more information on the PFEM solutions of this example see <span id='citeF-15'></span><span id='citeF-16'></span>[[#cite-15|[15]],[[#cite-16|16]]]. |
==8 CONCLUSIONS== | ==8 CONCLUSIONS== | ||
Latest revision as of 10:41, 14 June 2019
Pulished in Bytes and Science, G. Zavarise and D. Boso (Eds.), pp. 119 - 130, CIMNE, Barcelona Spain, 2012
Abstract
We present some developments and applications of the Particle Finite Element Method (PFEM) for analysis of complex coupled problems in mechanics involving fluid-soil-structure interaction.
Keywords Particle finite element method, Fluid-soil structure interaction.
1 INTRODUCTION
The analysis of problems involving the interaction of fluids, soil/rocks and structures is of relevance in many areas of engineering. Examples of fluid-soil-structure interaction (FSSI) problems are common in the study of landslides and their effect on reservoirs and adjacent structures, off-shore and harbour structures under large waves, constructions hit by floods and tsunamis, soil erosion and stability of rock-fill dams in overspill situations, etc.
The authors have successfully developed in previous works a particular class of Lagrangian formulation for solving problems involving complex interactions between (free surface) fluids and solids. The method, called the particle finite element method (PFEM, http://www.cimne.com/pfem/), treats the mesh nodes in the fluid and solid domains as particles which can freely move and even separate from the main fluid domain representing, for instance, the effect of water drops. A mesh connects the nodes discretizing the domain where the governing equations are solved using a stabilized FEM.
An advantage of the PFEM Lagrangian formulation is that the convective terms disappear from the fluid equations. The difficulty is however transferred to the problem of adequately (and efficiently) moving the mesh nodes. We use a mesh regeneration procedure base on an extended Delaunay tesselation [4]. The theory and applications of the PFEM are reported in [1,5,6,7,8,10,11,12,13,14,15,16].
The FEM solution of (incompressible) fluid flow problem implies solving the momentum and incompressibility equations. In our work we use a stabilized mixed FEM based on the Finite Calculus (FIC) approach which allows for a linear approximation for the velocity and pressure variables [9,10].
In the next section the key ideas of the PFEM are outlined. Next the basic equations for a compressible/incompressible Lagrangian continuum are presented. An algorithm for the transient solution is briefly described. The methods for mesh generation and for identification of free surface nodes are outlined. The procedure for treating the frictional contact interaction between interfaces is explained. We present several examples of application of the PFEM to solve FSSI problems such as the erosion of a river bed, the stability of breakwaters and constructions under sea waves and the study of landslides.
2 THE BASIS OF THE PARTICLE FINITE ELEMENT METHOD
In the PFEM both the fluid and the solid domains are modelled using an updated Lagrangian formulation [6,17]. That is, variables are assumed to be known in the current configuration at time . The new set of variables in both domains are sought for in the next or updated configuration at time .
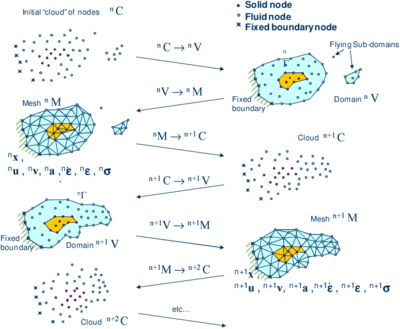
|
| Figure 1: Sequence of steps to update a “cloud” of nodes representing a domain containing a fluid and a solid from time () to time () |
We define the collection or cloud of nodes (C) pertaining to the fluid and solid domains, the volume (V) containing these domains and the mesh (M) discretizing .
A typical solution with the PFEM involves the following steps.
- The starting point at each time step is the cloud of points in the fluid and solid domains. denotes the cloud at time (Figure 1).
- Identify the boundaries for both the fluid and solid domains. The Alpha Shape method [2] is used for the boundary definition.
- Discretize the fluid and solid domains with a finite element mesh . We use a mesh generation scheme based on the extended Delaunay tesselation [4,10].
- Solve the coupled Lagrangian equations of motion for the fluid and the solid domains. Compute the state variables in both domains at the next (updated) configuration for .
- Move the mesh nodes to a new position where denotes the time , in terms of the time increment size.
- Go back to step 1 and repeat the solution process for the next time step to obtain (Figure 1).
The quality of the numerical solution depends on the discretization as in the FEM. Adaptive mesh refinement techniques can be used to improve the solution.
3 PFEM FORMULATION FOR A LAGRANGIAN CONTINUUM
3.1 Governing equations
The equations to be solved are the standard ones in continuum mechanics, written in the Lagrangian frame of reference [17,18]:
Momentum
|
|
(1) |
Pressure-velocity relationship
|
|
(2) |
is the velocity along the ith global axis, is the pressure (assumed to be positive in tension) and are the density and bulk modulus of the material and and are the body forces and the Cauchy stresses. Eqs.(1) and (2) are completed with the constitutive relationships for the fluid and solid materials:
Incompressible fluid
|
|
(3) |
Compressible/quasi-incompressible solid
|
|
(4) |
where are the component of the stress tensor , where is the second Piola-Kirchhoff stress tensor, is the deformation gradient tensor and [17]. Parameters and take the following values [6].
Fluid material: : viscosity
Solid material: ; , where is the Poisson ration, is the shear modulus and the time increment.
In Eqs.(3) and (4), is the rate of deformation, is the viscosity and is the Kronecker delta. denotes values at time . Indexes in Eqs.(1)-(4) range from , where is the number of space dimensions of the problem (i.e. for 2D problems). These equations are completed with the standard boundary conditions [6,17,18].
3.2 Discretization of the equations
A key problem in the numerical solution of Eqs.(1)-(2) is the satisfaction of the mass balance condition for the incompressible case (i.e. in Eq.(2)). Many procedures to solve his problem exist in the FEM literature [18]. In our approach we use a stabilized formulation based in the so-called finite calculus procedure [9,11]. The essence of this method is the solution of a modified mass balance equation which is written as
|
|
(5) |
where are weighting functions, is a stabilization parameter given by [9,11] with being a characteristic length of each finite element and is the modulus of the velocity vector.
In Eq.(5) are auxiliary pressure projection variables chosen so as to ensure that the second term in Eq.(5) can be interpreted as weighted sum of the residuals of the momentum equations. The set of governing equations is completed by adding the following constraint equation [11]
|
|
(6) |
where are arbitrary weighting functions. The rest of integral equations are obtained by applying the standard weighted residual technique to the governing equations (1)-(5) and the boundary conditions [15,17,18].
We interpolate next in the standard finite element fashion the set of problem variables. For 3D problems these are the three velocities , the pressure , the temperature and the three pressure gradient projections . In our work we use equal order linear interpolation for all variables over meshes of 3-noded triangles (in 2D) and 4-noded tetrahedra (in 3D). The set of discretized equations using the Galerkin technique has the following form
Momentum
|
|
(7) |
Pressure-velocity relationship
|
|
(8) |
Pressure gradient projection
|
|
(9) |
In Eqs.(7)-(9) denotes nodal variables, . The different matrices and vectors are given in [6,11,13].
The solution in time of Eqs.(7)-(9) can be performed using any time integration scheme typical of the updated Lagrangian FEM [17]. A basic algorithm following the process described in Section 2 is presented in Box I.
Box I. Basic PFEM algorithm for a Lagrangian continuum
| 1. LOOP OVER TIME STEPS, , NTIME
Known values
2. LOOP OVER NUMBER OF ITERATIONS, , NITER Compute nodal velocities by solving Eq.(8)
Compute nodal pressures from Eq.(9)
Compute nodal pressure gradient projections from Eq.(10)
Update position of analysis domain nodes:
Define new “cloud” of nodes Update strain rate and strain values Update stress values Check convergence NO Next iteration YES
Next time step Identify new analysis domain boundary: Generate mesh: Go to 1 |
4 MESH GENERATION AND BOUNDARY IDENTIFICATION
The success of the PFEM relies on the fast regeneration of a mesh at every time step. Any fast meshing algorithm can be used. In our work the mesh is generated at each time step using an extended Delaunay tesselation [4].
For large 3D problems solved in a single processor Pentium IV PC, meshing consumes around 15% of the total CPU time for time step, while the solution of the equations (with typically 3 iterations to reach convergence per time step) and the assembly of the system consume approximately 70% and 15% of the CPU time per time step, respectively. Considerable speed can be gained using parallel computing techniques.
Boundary nodes are recognized at mesh generation level [5,10]. Considering that the nodes follow a variable distribution, where is typically the minimum distance between two nodes. All nodes on an empty sphere with a radius greater than , are considered as boundary nodes. Values of ranging of 1.4 have been found to be optimal. This criterion is coincident with the Alpha Shape [2].
The boundary recognition method is useful for detecting contact conditions between any fluid/solid or solid/solid interface.
5 TREATMENT OF CONTACT CONDITIONS
Prescribed velocities at the fixed boundaries in the PFEM are applied in strong form to the boundary nodes. Contact between the fluid particles and the fixed boundaries is accounted for by the incompressibility condition which prevents the fluid nodes to penetrate into the solid boundaries [9].
|
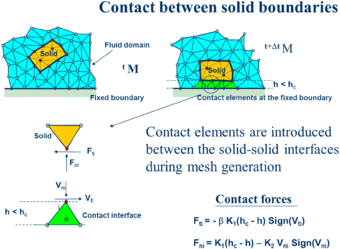
| Figure 2: Modelling contact conditions at a solid-solid interface with PFEM |
The contact between two solid interfaces is treated by introducing a layer of contact elements between the interacting interfaces. This layer is created during the mesh generation step by prescribing a minimum distance () between two solid boundaries. If the distance exceeds the minimum value () then the generated elements are treated as fluid elements. Otherwise the elements are treated as frictional contact elements (Figure 2).
The algorithm can also be used effectively to model frictional contact conditions between rigid or elastic solids in structural mechanics applications [1,15].
6 MODELING OF BED EROSION
Prediction of bed erosion and sediment transport in open channel flows are important tasks in many areas of river and environmental engineering. Bed erosion can lead to instabilities of the river basin slopes. It can also undermine the foundation of bridge piles. Modeling of bed erosion is also relevant for predicting the dragging of surface material in earth dams in overspill situations.
The erosion model used in this work is based on the frictional work at the bed surface originated by the shear stresses in the fluid [12].
7 EXAMPLES
Figure 3 shows the capacity of the PFEM for modelling soil erosion, sediment transport and material deposition in a river bed. The soil particles are first detached from the bed surface under the action of the jet stream. Then they are transported by the flow and eventually fall down due to gravity forces.
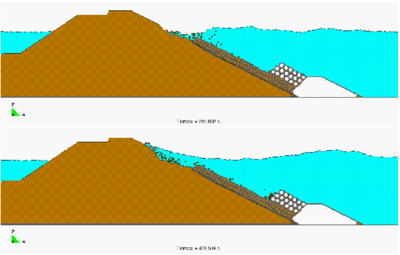
Figure 4 shows the progressive erosion of the unprotected part of a breakwater slope in the Langosteira harbour in A Coruña, Spain. The non protected upper shoulder zone is progressively eroded under the sea waves.

|
| Figure 3: Erosion, transport and deposition of soil particles due to jet stream |
|
| Figure 4: Erosion of an unprotected shoulder of a breakwater due to sea waves |

|
| Figure 5: Erosion of soil mass due to waves and subsequent falling of lorry |
|
|
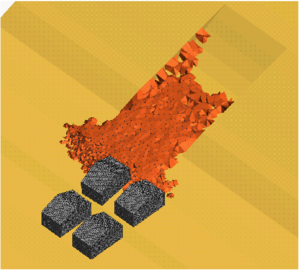
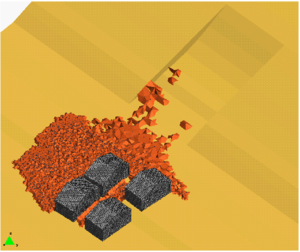
| Figure 6: Simulation of landslide falling on constructions using PFEM | |
Figure 5 shows a representative example of the progressive erosion of a soil mass adjacent to the shore due to sea waves and the subsequent falling into the sea of a 2D rigid object representing the section of a lorry.
| (a) | |

| |
| (b) | |
| |
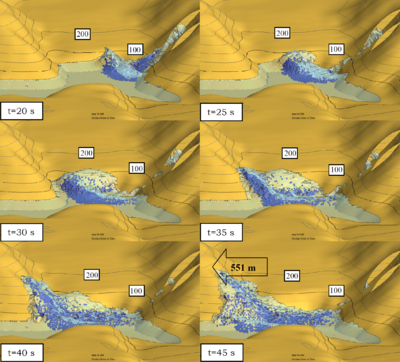
| Figure 7: Lituya Bay landslide. (a) Left: Geometry. Right: Landslide direction and maximum wave level [3]. (b) Landslide motion into reservoir obtained with PFEM. Maximum level of generated wave (551 mts) in north slope | |
For other applications of the PFEM to bed erosion problems see [12,16].
The PFEM is particularly suited for modelling and simulation of landslides and their effect in the surrounding structures. Figure 6 shows an schematic 3D simulation of a landslide falling on adjacent constructions. The landslide material has been modelled as a viscous incompressible fluid.
In Figure 7 we present some results of the 3D analysis of the landslide produced in Lituya Bay (Alaska) on July 9th 1958. The landslide was originated by an earthquake and movilized 90 millions tons of rocks that fell on the bay creating a large wave that reached a hight on the opposed slope of 524 mts.
The sliding mass has been modelled as a quasi-incompressible continuum with a prescribed shear modulus. No frictional or erosion effects with the underneath soil have been considered.
The maximum water level in north hill obtained with PFEM was 551 mts. This is 5% higher than the value of 524 mts. observed experimental [3]. The maximum height location differs in 300 mts from the observed value. In the south slope the maximum water height observed was 208 mts, while the PFEM result (not shown here) was 195 mts (6% error). For more information on the PFEM solutions of this example see [15,16].
8 CONCLUSIONS
The PFEM is a promising numerical technique for solving fluid-soil-structure interaction (FSSI) problems involving large motion of fluid and solid particles, surface waves, frictional contact situations between fluid-solid and solid-solid interfaces and bed erosion, among other complex phenomena. The success of the PFEM lies in the accurate and efficient solution of the equations of a continuum containing fluid and solid domains using an updated Lagrangian formulation and a stabilized FEM with low order elements. Other essential solution ingredients are the efficient regeneration of the finite element mesh, the fast identification of the boundaries and the simple algorithm to treat frictional contact conditions and erosion at the interfaces. The examples show the potential of the PFEM for solving a wide class of practical FSSI problems.
ACKNOWLEDGEMENTS
This research was supported by project SEDUREC of the Consolider Programme of the Ministerio de Educación y Ciencia of Spain and projects SAFECON and REALTIME of the European Research Council.
References
[1] Carbonell JM, Oñate E, Suárez B (2010) Modeling of ground excavation with the Particle Finite Element Method. Journal of Engineering Mechanics (ASCE) 136(4):455–463
[2] Edelsbrunner H, Mucke EP (1999) Three dimensional alpha shapes. ACM Trans. Graphics 13:43–72
[3] Fritz, HM, Hager WH, Minor HE (2001) Lituya Bay Case: Rockslide impact and wave run-up. Science of Tsunami Hazards 19(1):3–22
[4] Idelsohn SR, Calvo N, Oñate E (2003c) Polyhedrization of an arbitrary point set. Comput. Method Appl. Mech. Engng. 192(22-24):2649–2668
[5] Idelsohn SR, Oñate E, Del Pin F, Calvo N (2006) Fluid-structure interaction using the particle finite element method. Comput. Meth. Appl. Mech. Engng. 195:2100–2113
[6] Idelsohn SR, Marti J, Limache A, Oñate E (2008) Unified Lagrangian formulation for elastic solids and incompressible fluids: Application to fluid-structure interaction problems via the PFEM. Comput Methods Appl Mech Engrg. 197:1762–1776
[7] Idelsohn SR, Mier-Torrecilla M, Oñate E (2009) Multi-fluid flows with the Particle Finite Element Method. Comput Methods Appl Mech Engrg. 198:2750–2767
[8] Larese A, Rossi R, Oñate E, Idelsohn SR (2008) Validation of the Particle Finite Element Method (PFEM) for simulation of free surface flows. Engineering Computations 25(4):385–425
[9] Oñate E (2004) Possibilities of finite calculus in computational mechanics. Int. J. Num. Meth. Engng. 60(1):255–281
[10] Oñate E, Idelsohn SR, Del Pin F, Aubry R (2004b) The particle finite element method. An overview. Int. J. Comput. Methods 1(2):267–307
[11] Oñate E, García J, SR Idelsohn, F. Del Pin (2006b) FIC formulations for finite element analysis of incompressible flows. Eulerian, ALE and Lagrangian approaches. Comput. Meth. Appl. Mech. Engng. 195(23-24):3001–3037
[12] Oñate E, M.A. Celigueta, Idelsohn SR (2006c) Modeling bed erosion in free surface flows by the Particle Finite Element Method, Acta Geotechnia 1(4):237–252
[13] Oñate E, Idelsohn SR, Celigueta MA, Rossi R (2008) Advances in the particle finite element method for the analysis of fluid-multibody interaction and bed erosion in free surface flows. Comput. Meth. Appl. Mech. Engng. 197(19-20):1777–1800
[14] Oñate E, Rossi R, Idelsohn SR, Butler K (2010) Melting and spread of polymers in fire with the particle finite element method. Int. J. Numerical Methods in Engineering, 81(8):1046–1072
[15] Oñate E, Celigueta MA, Idelsohn SR, Salazar F, Suárez B (2011) Possibilities of the particle finite element method for fluid-soil-structure interaction problems. Computational Mechanics, 48(3):307–318.
[16] Oñate, E, Salazar F, Morán R (2011) Modeling of landslides into reservoir with the Particle Finite Element Method. Research Report CIMNE No. PI355. Submitted to Int. J. Numerical Methods in Geomechanics
[17] Zienkiewicz OC, Taylor RL (2005) The finite element method for solid and structural mechanics, Elsevier
[18] Zienkiewicz OC, Taylor RL, Nithiarasu P (2006) The finite element method for fluid dynamics, Elsevier