| (16 intermediate revisions by 2 users not shown) | |||
| Line 1: | Line 1: | ||
| − | + | Published in ''Computational Particle Mechanics'', Vol. 5 (3) , pp. 411-420, 2018<br /> | |
| − | + | doi: 10.1007/s40571-017-0178-z | |
| − | + | ||
| − | ''' | + | |
| − | + | ||
| − | + | ||
| − | + | ||
| − | + | ||
| − | + | ||
| − | + | ||
| − | + | ||
| − | + | ||
| − | + | ||
| − | + | ||
| − | + | ||
| − | + | ||
| − | -- | + | |
==Abstract== | ==Abstract== | ||
| − | This paper extends to three dimensions (3D) the computational technique developed by the authors in 2D for predicting the onset and evolution of fracture in a finite element mesh in a simple manner based on combining the finite element method (FEM) and the discrete element method (DEM) approach | + | This paper extends to three dimensions (3D) the computational technique developed by the authors in 2D for predicting the onset and evolution of fracture in a finite element mesh in a simple manner based on combining the finite element method (FEM) and the discrete element method (DEM) approach <span id='citeF-23'></span>[[#cite-23|[23]]]. Once a crack is detected at an element edge, discrete elements are generated at the adjacent element vertexes and a simple DEM mechanism is considered in order to follow the evolution of the crack. The combination of the DEM with simple 4-noded linear tetrahedron elements correctly captures the onset of fracture and its evolution, as shown in several 3D examples of application. |
'''Keywords''': Discrete elements, finite elements, fracture mechanics, FEM-DEM technique | '''Keywords''': Discrete elements, finite elements, fracture mechanics, FEM-DEM technique | ||
| Line 38: | Line 23: | ||
* DEM discretization. | * DEM discretization. | ||
* Substepping time integration of the dynamic equations for the DEM and FEM regions. | * Substepping time integration of the dynamic equations for the DEM and FEM regions. | ||
| + | <br /> | ||
In short, the solution strategy starts by evaluating the transient mechanical behaviour of a finite element (FE) mesh of 4-noded tetrahedra that discretize a solid. The mesh connectivities emulates the discrete element (DE) links were damage is evaluated. The mechanism to transfer an element damage to the DE links is defined by the different cutting planes for each tetrahedron. In this way the element stiffness, affected by the damage, can be defined in a standard form and a new iteration can be made. | In short, the solution strategy starts by evaluating the transient mechanical behaviour of a finite element (FE) mesh of 4-noded tetrahedra that discretize a solid. The mesh connectivities emulates the discrete element (DE) links were damage is evaluated. The mechanism to transfer an element damage to the DE links is defined by the different cutting planes for each tetrahedron. In this way the element stiffness, affected by the damage, can be defined in a standard form and a new iteration can be made. | ||
| Line 74: | Line 60: | ||
===2.3 Elemental damage definition=== | ===2.3 Elemental damage definition=== | ||
| − | Once damage has been evaluated at each element edge, which corresponds to an virtual DE link, the elemental is calculated as the maximum damage created at any cut plane existing within the tetrahedron (Figure [[#img-1|1]]). On each tetrahedron there are four cut planes that disconnect one node from the other three nodes (Figure [[#img-1|1]]a | + | Once damage has been evaluated at each element edge, which corresponds to an virtual DE link, the elemental is calculated as the maximum damage created at any cut plane existing within the tetrahedron (Figure [[#img-1|1]]). On each tetrahedron there are four cut planes that disconnect one node from the other three nodes (Figure [[#img-1|1]]a) and three cut planes that disconnect two nodes from the other two nodes (Figure [[#img-1|1]]b). |
<div id='img-1'></div> | <div id='img-1'></div> | ||
| Line 157: | Line 143: | ||
{| class="floating_imageSCP" style="text-align: center; border: 1px solid #BBB; margin: 1em auto; width: 100%;max-width: 100%;" | {| class="floating_imageSCP" style="text-align: center; border: 1px solid #BBB; margin: 1em auto; width: 100%;max-width: 100%;" | ||
|- | |- | ||
| − | |[[Image:Draft_Samper_993584713-fig5.png| | + | |[[Image:Draft_Samper_993584713-fig5.png|340px|Normalized tensile test of a 3D concrete specimen. Finite element mesh and dimentions acoording to ASTM D638 norm.]] |
|- style="text-align: center; font-size: 75%;" | |- style="text-align: center; font-size: 75%;" | ||
| colspan="1" | '''Figure 3:''' Normalized tensile test of a 3D concrete specimen. Finite element mesh and dimentions acoording to ASTM D638 norm. | | colspan="1" | '''Figure 3:''' Normalized tensile test of a 3D concrete specimen. Finite element mesh and dimentions acoording to ASTM D638 norm. | ||
| Line 210: | Line 196: | ||
{| class="floating_imageSCP" style="text-align: center; border: 1px solid #BBB; margin: 1em auto; width: 100%;max-width: 100%;" | {| class="floating_imageSCP" style="text-align: center; border: 1px solid #BBB; margin: 1em auto; width: 100%;max-width: 100%;" | ||
|- | |- | ||
| − | |[[Image:Draft_Samper_993584713-fig13_crop.png| | + | |[[Image:Draft_Samper_993584713-fig13_crop.png|400px|BTS test on a concrete specimen. Dimensions, boundary conditions and finite element meshes of three noded triangles used.]] |
|- style="text-align: center; font-size: 75%;" | |- style="text-align: center; font-size: 75%;" | ||
| colspan="1" | '''Figure 6:''' BTS test on a concrete specimen. Dimensions, boundary conditions and finite element meshes of three noded triangles used. | | colspan="1" | '''Figure 6:''' BTS test on a concrete specimen. Dimensions, boundary conditions and finite element meshes of three noded triangles used. | ||
| Line 220: | Line 206: | ||
{| class="floating_imageSCP" style="text-align: center; border: 1px solid #BBB; margin: 1em auto; width: 100%;max-width: 100%;" | {| class="floating_imageSCP" style="text-align: center; border: 1px solid #BBB; margin: 1em auto; width: 100%;max-width: 100%;" | ||
|- | |- | ||
| − | |[[Image:Draft_Samper_993584713-fig16_crop.png| | + | |[[Image:Draft_Samper_993584713-fig16_crop.png|300px|BTS 3D test on a concrete specimen. Damage zone and discrete elements generated. a) Coarse mesh, b) intermediate mesh, c) Fine mesh.]] |
|- style="text-align: center; font-size: 75%;" | |- style="text-align: center; font-size: 75%;" | ||
| colspan="1" | '''Figure 7:''' BTS 3D test on a concrete specimen. Damage zone and discrete elements generated. a) Coarse mesh, b) intermediate mesh, c) Fine mesh. | | colspan="1" | '''Figure 7:''' BTS 3D test on a concrete specimen. Damage zone and discrete elements generated. a) Coarse mesh, b) intermediate mesh, c) Fine mesh. | ||
| Line 228: | Line 214: | ||
{| class="floating_imageSCP" style="text-align: center; border: 1px solid #BBB; margin: 1em auto; width: 100%;max-width: 100%;" | {| class="floating_imageSCP" style="text-align: center; border: 1px solid #BBB; margin: 1em auto; width: 100%;max-width: 100%;" | ||
|- | |- | ||
| − | |[[Image:Draft_Samper_993584713-fig17_crop.png| | + | |[[Image:Draft_Samper_993584713-fig17_crop.png|400px|BTS 3D test on a concrete specimen. Force-displacement relationship for the three meshes used.]] |
|- style="text-align: center; font-size: 75%;" | |- style="text-align: center; font-size: 75%;" | ||
| colspan="1" | '''Figure 8:''' BTS 3D test on a concrete specimen. Force-displacement relationship for the three meshes used. | | colspan="1" | '''Figure 8:''' BTS 3D test on a concrete specimen. Force-displacement relationship for the three meshes used. | ||
| Line 241: | Line 227: | ||
A shear test is designed to apply stress to a test sample so that it experiences a sliding failure along a plane that is parallel to the forces applied. Generally, shear forces cause one surface of a material to move in one direction and the other surface to move in the opposite direction so that the material is stressed in a sliding motion. | A shear test is designed to apply stress to a test sample so that it experiences a sliding failure along a plane that is parallel to the forces applied. Generally, shear forces cause one surface of a material to move in one direction and the other surface to move in the opposite direction so that the material is stressed in a sliding motion. | ||
| − | The procedure proposed to determine the shear resistance has been based on the shear test proposed by Luong [ | + | The procedure proposed to determine the shear resistance has been based on the shear test proposed by Luong <span id='citeF-14'>[[#cite-14|[14]]]. This test consists in a circular tube of axis <math display="inline">z = 0</math> subjected, on its internal and external faces, to a shear stress parallel to <math display="inline">z = 0</math> as it is described in Figure [[#img-9|9]] were the boundary conditions can be deduced. The height of the notch is <math display="inline">10 mm</math> whereas the width is <math display="inline">4 mm</math>. On the internal tube a constant vertical velocity of <math display="inline">1 mm/s</math> has been applied until failure. |
<div id='img-9'></div> | <div id='img-9'></div> | ||
{| class="floating_imageSCP" style="text-align: center; border: 1px solid #BBB; margin: 1em auto; width: 100%;max-width: 100%;" | {| class="floating_imageSCP" style="text-align: center; border: 1px solid #BBB; margin: 1em auto; width: 100%;max-width: 100%;" | ||
|- | |- | ||
| − | |[[Image:Draft_Samper_993584713-fig18_crop.png| | + | |[[Image:Draft_Samper_993584713-fig18_crop.png|400px|Shear test on a concrete specimen. Geometry and boundary conditions.]] |
|- style="text-align: center; font-size: 75%;" | |- style="text-align: center; font-size: 75%;" | ||
| colspan="1" | '''Figure 9:''' Shear test on a concrete specimen. Geometry and boundary conditions. | | colspan="1" | '''Figure 9:''' Shear test on a concrete specimen. Geometry and boundary conditions. | ||
| Line 256: | Line 242: | ||
{| class="floating_imageSCP" style="text-align: center; border: 1px solid #BBB; margin: 1em auto; width: 100%;max-width: 100%;" | {| class="floating_imageSCP" style="text-align: center; border: 1px solid #BBB; margin: 1em auto; width: 100%;max-width: 100%;" | ||
|- | |- | ||
| − | |[[Image:Draft_Samper_993584713-fig19_crop.png| | + | |[[Image:Draft_Samper_993584713-fig19_crop.png|400px|Shear test on a concrete specimen. a) CAD gemetry and b) finite element discrtetization.]] |
|- style="text-align: center; font-size: 75%;" | |- style="text-align: center; font-size: 75%;" | ||
| colspan="1" | '''Figure 10:''' Shear test on a concrete specimen. a) CAD gemetry and b) finite element discrtetization. | | colspan="1" | '''Figure 10:''' Shear test on a concrete specimen. a) CAD gemetry and b) finite element discrtetization. | ||
|} | |} | ||
| − | The material properties are <math display="inline">E_o=35\times 10^9 \, Pa</math>, <math display="inline">\nu = 0.22</math>, <math display="inline">\gamma = 7.8 \times 10^3 \, N/m^3</math>, <math display="inline">\sigma _f=30 \, MPa</math>, <math display="inline">\sigma _t=3 \, MPa</math> and <math display="inline">G=75\times 10^{-3} \, J/m^2</math>. In general, the shear strength of concrete is approximately <math display="inline">1/5</math> or <math display="inline">1/6</math> of the compressive stress [ | + | The material properties are <math display="inline">E_o=35\times 10^9 \, Pa</math>, <math display="inline">\nu = 0.22</math>, <math display="inline">\gamma = 7.8 \times 10^3 \, N/m^3</math>, <math display="inline">\sigma _f=30 \, MPa</math>, <math display="inline">\sigma _t=3 \, MPa</math> and <math display="inline">G=75\times 10^{-3} \, J/m^2</math>. In general, the shear strength of concrete is approximately <math display="inline">1/5</math> or <math display="inline">1/6</math> of the compressive stress <span id='citeF-14'>[[#cite-14|[14]]]. |
| − | Figure [[#img-11|11]] shows the crack obtained by the numeric experiment and compared with the restored laboratory samples [ | + | Figure [[#img-11|11]] shows the crack obtained by the numeric experiment and compared with the restored laboratory samples <span id='citeF-14'>[[#cite-14|[14]]]. Figure [[#img-12|12]] shows the force-displacement graph of the numerical test in which the initial elastic branch is well defined until the elements starts damaging and the stiffness decreases. From this Figure and according to the sample dimensions, the computed stress level reaches a value of <math display="inline">5.10 MPa</math>. The obtained result agrees in comparison with the expected value <span id='citeF-14'>[[#cite-14|[14]]]. Figure [[#img-12|12]] shows several laboratory samples, where the crack path obtained is similar to the one found using the FEM-DEM technique. |
<div id='img-11'></div> | <div id='img-11'></div> | ||
{| class="floating_imageSCP" style="text-align: center; border: 1px solid #BBB; margin: 1em auto; width: 100%;max-width: 100%;" | {| class="floating_imageSCP" style="text-align: center; border: 1px solid #BBB; margin: 1em auto; width: 100%;max-width: 100%;" | ||
|- | |- | ||
| − | |[[Image:Draft_Samper_993584713-fig20_crop.png| | + | |[[Image:Draft_Samper_993584713-fig20_crop.png|400px|Shear test on a concrete specimen. a) Top view and b) perspective of the crack obtained at the numeric experiment. c) Restored laboratory samples .]] |
|- style="text-align: center; font-size: 75%;" | |- style="text-align: center; font-size: 75%;" | ||
| − | | colspan="1" | '''Figure 11:''' Shear test on a concrete specimen. a) Top view and b) perspective of the crack obtained at the numeric experiment. c) Restored laboratory samples [ | + | | colspan="1" | '''Figure 11:''' Shear test on a concrete specimen. a) Top view and b) perspective of the crack obtained at the numeric experiment. c) Restored laboratory samples <span id='citeF-14'>[[#cite-14|[14]]]. |
|} | |} | ||
| Line 276: | Line 262: | ||
{| class="floating_imageSCP" style="text-align: center; border: 1px solid #BBB; margin: 1em auto; width: 100%;max-width: 100%;" | {| class="floating_imageSCP" style="text-align: center; border: 1px solid #BBB; margin: 1em auto; width: 100%;max-width: 100%;" | ||
|- | |- | ||
| − | |[[Image:Draft_Samper_993584713-fig21_crop.png| | + | |[[Image:Draft_Samper_993584713-fig21_crop.png|400px|Shear test on a concrete specimen. Force-displacement relationship obtained with the FEM-DEM technique.]] |
|- style="text-align: center; font-size: 75%;" | |- style="text-align: center; font-size: 75%;" | ||
| colspan="1" | '''Figure 12:''' Shear test on a concrete specimen. Force-displacement relationship obtained with the FEM-DEM technique. | | colspan="1" | '''Figure 12:''' Shear test on a concrete specimen. Force-displacement relationship obtained with the FEM-DEM technique. | ||
| Line 290: | Line 276: | ||
{| class="floating_imageSCP" style="text-align: center; border: 1px solid #BBB; margin: 1em auto; width: 100%;max-width: 100%;" | {| class="floating_imageSCP" style="text-align: center; border: 1px solid #BBB; margin: 1em auto; width: 100%;max-width: 100%;" | ||
|- | |- | ||
| − | |[[Image:Draft_Samper_993584713-fig22_crop.png| | + | |[[Image:Draft_Samper_993584713-fig22_crop.png|400px|Cistercian church at the monastery of Poblet. a) Inner view of the central nave. b) Church plant and analized section.]] |
|- style="text-align: center; font-size: 75%;" | |- style="text-align: center; font-size: 75%;" | ||
| colspan="1" | '''Figure 13:''' Cistercian church at the monastery of Poblet. a) Inner view of the central nave. b) Church plant and analized section. | | colspan="1" | '''Figure 13:''' Cistercian church at the monastery of Poblet. a) Inner view of the central nave. b) Church plant and analized section. | ||
| Line 300: | Line 286: | ||
{| class="floating_imageSCP" style="text-align: center; border: 1px solid #BBB; margin: 1em auto; width: 100%;max-width: 100%;" | {| class="floating_imageSCP" style="text-align: center; border: 1px solid #BBB; margin: 1em auto; width: 100%;max-width: 100%;" | ||
|- | |- | ||
| − | |[[Image:Draft_Samper_993584713-fig25_crop.png| | + | |[[Image:Draft_Samper_993584713-fig25_crop.png|450px|Cistercian church at the monastery of Poblet. a) FE Mesh of the analysed section. b) Dynamic exitation expresed in displacements.]] |
|- style="text-align: center; font-size: 75%;" | |- style="text-align: center; font-size: 75%;" | ||
| colspan="1" | '''Figure 14:''' Cistercian church at the monastery of Poblet. a) FE Mesh of the analysed section. b) Dynamic exitation expresed in displacements. | | colspan="1" | '''Figure 14:''' Cistercian church at the monastery of Poblet. a) FE Mesh of the analysed section. b) Dynamic exitation expresed in displacements. | ||
|} | |} | ||
| − | The applied loads correspond to an imposed oscillatory movement, in the normal direction to the central nave axis as shown in Figure [[#img-14|14]] b). The values shown correspond to the oscillatory movement in the direction <math display="inline"> \boldsymbol{S}00\boldsymbol{E} </math> of the records in displacements obtained from the accelerogram of the earthquake "El Centro" occurred on May 18, 1940 [ | + | The applied loads correspond to an imposed oscillatory movement, in the normal direction to the central nave axis as shown in Figure [[#img-14|14]] b). The values shown correspond to the oscillatory movement in the direction <math display="inline"> \boldsymbol{S}00\boldsymbol{E} </math> of the records in displacements obtained from the accelerogram of the earthquake "El Centro" occurred on May 18, 1940 <span id='citeF-2'></span>[[#cite-2|[2]]]. These values are applied with a <math display="inline"> 50 % </math> reduction to the model, so that it simulates a <math display="inline"> 6.0 M_W </math> earthquake. |
<div id='img-15'></div> | <div id='img-15'></div> | ||
{| class="floating_imageSCP" style="text-align: center; border: 1px solid #BBB; margin: 1em auto; width: 100%;max-width: 100%;" | {| class="floating_imageSCP" style="text-align: center; border: 1px solid #BBB; margin: 1em auto; width: 100%;max-width: 100%;" | ||
|- | |- | ||
| − | |[[Image:Draft_Samper_993584713-fig24_crop.png| | + | |[[Image:Draft_Samper_993584713-fig24_crop.png|400px|Cistercian church at the monastery of Poblet. Evolution of fractures at the central section of the nave for different times.]] |
|- style="text-align: center; font-size: 75%;" | |- style="text-align: center; font-size: 75%;" | ||
| colspan="1" | '''Figure 15:''' Cistercian church at the monastery of Poblet. Evolution of fractures at the central section of the nave for different times. | | colspan="1" | '''Figure 15:''' Cistercian church at the monastery of Poblet. Evolution of fractures at the central section of the nave for different times. | ||
Latest revision as of 13:08, 25 March 2019
Published in Computational Particle Mechanics, Vol. 5 (3) , pp. 411-420, 2018
doi: 10.1007/s40571-017-0178-z
Abstract
This paper extends to three dimensions (3D) the computational technique developed by the authors in 2D for predicting the onset and evolution of fracture in a finite element mesh in a simple manner based on combining the finite element method (FEM) and the discrete element method (DEM) approach [23]. Once a crack is detected at an element edge, discrete elements are generated at the adjacent element vertexes and a simple DEM mechanism is considered in order to follow the evolution of the crack. The combination of the DEM with simple 4-noded linear tetrahedron elements correctly captures the onset of fracture and its evolution, as shown in several 3D examples of application.
Keywords: Discrete elements, finite elements, fracture mechanics, FEM-DEM technique
1 Introduction
Many authors have contributed different techniques to define the growth of a fracture in a brittle or ductile continuum [8,11,20,14]. One of the latest works defines the continuum by means of discrete elements [19]. However, the inherent difficulty for calibrating the material parameters in the DEM, as well as the need for a large number of discrete elements [11,19] question it effectiveness, even though the qualitatively results of the DEM for predicting multiple fracture patterns are pretty good.
This paper extends to 3D analysis the basis of the simple FEM-DEM procedure proposed by the authors for predict the onset and propagation of fractures in solids [23]. The method extends a well-defined crack opening methodology termed Element Elimination Technique (EET)[11,19,22] that creates discrete elements at the crack lips. Some important aspects inherent to the formulation here presented guarantee the good results obtained, like a smoothed stress field, mass conservation and the use of a simple algorithm to ensure the post-fracture contact between the fractured edge. The FEM-DEM approach proposed is applied to a collection of benchmark problems in 3D which evidence the good performance of this numerical technique for nonlinear analysis of solids involving multi-fracture situations.
2 3D Implementation
Following the same FEM-DEM philosophy defined for the 2D case [23], the fundamental ideas have been exported to the 3D analysis. Basically the FEM-DEM procedure can be grouped in five steps. Each of these will be discussed in more detail in the next sections.
- FEM discretization with 4-noded tetrahedra.
- Stress field definition.
- Elemental damage definition.
- DEM discretization.
- Substepping time integration of the dynamic equations for the DEM and FEM regions.
In short, the solution strategy starts by evaluating the transient mechanical behaviour of a finite element (FE) mesh of 4-noded tetrahedra that discretize a solid. The mesh connectivities emulates the discrete element (DE) links were damage is evaluated. The mechanism to transfer an element damage to the DE links is defined by the different cutting planes for each tetrahedron. In this way the element stiffness, affected by the damage, can be defined in a standard form and a new iteration can be made.
When the elemental damage is greater than a certain value, it is considered that the element stiffness is so degraded that it is possible to eliminate the element following the Element Elimination Technique (EET) [10,16,22]. At this time, new discrete elements are created at the vertices of the removed tetrahedron. In this way a crack is formed in the continuum discretized by FE with the crack lips defined by the DE. It is interesting that as the crack grows and branches, some discrete elements can be detached from the FE mesh when the element that holds a DE is eliminated, creating a disgregation of the continuum.
2.1 FEM discretization with 4-noded tetrahedral
Much research has been spent in recent years in the development of the FEM for modelling the onset and propagation of cracks in frictional materials [4-6,9,15]. However, most FEM procedures for crack prediction require sophisticated element formulations, as well as remeshing in the vicinity of the possible cracks paths ,[9,15].
The approach followed in this paper uses the FEM to model a continuum whose fracture is described by means of DE, as cracks appear.
The simple 4-noded tetrahedra is chosen for the 3D FEM solution. The analysis domain is initialliy discretized with a tetrahedral mesh, just as in a standard 3D analysis with the FEM. A simple damage model is introduced assuming a progressive degradation of the element stiffness as described below.
2.2 Stress field definition
Having a proper stress field is key for define the right damage level and the crack path. In the 2D problem, the stress field is defined by smoothing the stress values at the elemental Gauss point in a new point located at the middle of the sides of each triangular element. This strategy follows the superconvergent patch recovery method proposed by Zienkiewicz, and Zhu [24] which overcomes the need to add stabilization terms to the stress field, as in alternative procedures [4-6].
Since the 3D stress field between elements is discontinuous, the same smoothing mechanism is used. That is, the stresses on each tetrahedral element edge are computed as the arithmetic mean of the stresses inside all elements that share that edge.
Like for the 2D case [23], the Rankine failure criteria has been used for predicting the onset of fracture in brittle materials [5,13]. During failure an exponential damage law is considered to progressively degrade the material stiffness [7]. The evolution of the damage parameter (varying from to ) is defined as
|
|
(1) |
where is the major principal stress, is the edge lenght, is the tensile strength, is the fracture energy and the undamaged Young modulus of the material.
2.3 Elemental damage definition
Once damage has been evaluated at each element edge, which corresponds to an virtual DE link, the elemental is calculated as the maximum damage created at any cut plane existing within the tetrahedron (Figure 1). On each tetrahedron there are four cut planes that disconnect one node from the other three nodes (Figure 1a) and three cut planes that disconnect two nodes from the other two nodes (Figure 1b).

|
| Figure 1: Cutting planes in a tetrahedron. a) One node disconnect b) Two nodes disconnected. |
The cutting plane damage is defined as the average damage value of each edge that the cutting plane intersects. If the elemental damage exceeds a certain threshold, then the tetrahedron is completely removed [10,16,22] and new discrete elements are created at the associated nodes maintaining the mass of the element removed. In many cases is usual that the elemental damage threshold is reached at the same time steep for all the elements that shares a side. In this case the crack grows along the removed finite elements and the crack lips are defined by discrete elements.
2.4 DEM discretization
When a tetrahedron FE is fully removed (i.e. the element stiffness is neglected) four discrete elements (or particles) are created at the element node. In our work we have used spheres for representing the discrete elements. The mass of each new discrete element corresponds to the nodal mass and its radius is the maximum one that guarantees the contact between the adjacent discrete elements without creating any overlapping between them. Other algorithms can be used for generating DE [11,12], but good results have been achieved with the proposed one.
Once a DE is created, the forces at the contact interfaces are used to define the interaction of the element with the adjacent ones. These forces are due only to the contact interaction in the normal and tangential directions. At the contact point, the minimum radius of the particles in contact are used to evaluate the contact forces [19].
For 3D problems the normal contact force at a contact point between two spheres is given by:
|
|
(2) |
where is the radius of the smaller of the two particles interacting at the interface . is the normal overlap between the two discrete elements and is the distance between the element centres.
The tangential force is decomposed in two orthogonal directions and contained at the plane normal to the direction . For each direction the normal force is given by:
|
|
(3) |
were is the friction coefficient, is the Poisson's ratio, is the relative tangential displacement between two discrete elements and is the module of the vector. More details of Eqs. 2 and 3 can be found in [19].
As we pointed out in [23], the total number of DE generated in an analysis is only a small fraction of the number of nodes of the mesh. Therefore, the searching algorithm for evaluating the contact interactions between discrete elements does not consume much computational resources.
2.5 Substepping time integration of the dynamic equations for the DEM and FEM regions
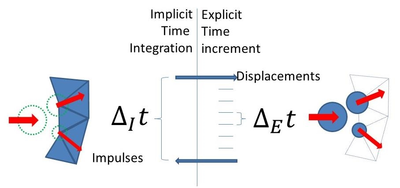
One of the main problems in 3D FEM analysis is the large number of equations that arise from discretization. Adding to these the difficulties to consider a large time increment, an implicit time integration is the best solution strategy. However, this type of integrations is not typically applied when discrete elements are used because it is very difficult to correctly identify and quantify the contacts and contact forces between these elements.
The implementation followed in this work corresponds to a time stepping scheme in which the FEM solution is calculated using an implicit Newmark scheme, while for the discrete elements computation we use an explicit centred differences scheme. Usually the implicit time increment is 100 times greater than the explicit one.
The advantage of this strategy is that the number of discrete elements is much lower than that of finite elements, so the explicit integration performed in an implicit time step is quite fast. Before beginning a new time step in the implicit scheme, the same time period is analysed with an explicit scheme over the discrete elements using a time increment of .
The contact between discrete elements is quantified by the sum of the impulses that occur along the analysis during . This effect is expressed as a force applied on the element at time for computing the implicit solution, as shown in Figure 2. In this way the FEM-DEM solution advances in time.
|
| Figure 2: Substepping time scheme used for FEM and DEM time integration. |
It has been observed that it is not advisable for the time steps and to have a ratio greater than 1:500 since there may be some discrepancy between the explicit and implicit solutions. Having this in mind, the strategy solution implemented yields excellent results, as shown in the examples presented in next section.
3 EXAMPLES
In this section several examples are shown in order to show the good behavior of the 3D FEM-DEM strategy described. The first example presented is the 3D study of a normalized sample for a tensile test. The second example corresponds to the indirect tensile test also known as Brazilian test widely used in in concrete and rock mechanics. The third example consists of a concrete shear test proposed in [14]. Finally, we present the seismic analysis of the central nave of the church located at the Poblet monastery. In this example a earthquake is applied to highlight the effect of the opening and closing of the cracks generated.
3.1 3D normalized tensile test
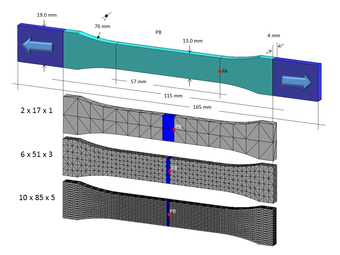
The first example corresponds to the fracture analysis of a flat concrete specimen under tensile stress. The geometry is defined according to the norm D638 of the American Section of the International Association for Testing Materials (ASTM) [1] as shown in Figure 3 where the three meshes of 4-noded tetrahedra used and the boundary conditions can be seen. A constant horizontal velocity is imposed to the two ends of the specimen.
The study has been performed using the 3D FEM-DEM technique previously described. In order to localize the fracture, only one band of elements is allowed to break at the failure stress level corresponding to the tested material, using the linear damage model previously described. The results obtained are analysed by plotting the displacements of points PA and PB shown in Figure 3.
|
| Figure 3: Normalized tensile test of a 3D concrete specimen. Finite element mesh and dimentions acoording to ASTM D638 norm. |
The Young modulus, the Poisson's ratio and the density are respectively , , , the tensile strength and the fracture energy .
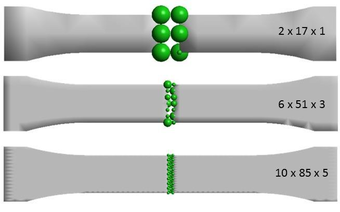
The specimen deforms by applying a constant velocity of . at both tips of the specimen. Figure 4 shows the damaged geometry. Note that where fracture appears, discrete elements are created at the crack lips as explained in the previous sections. Due to the DE sizing algorithm which guarantees that the DE creation do not generate spurious contact forces, the element radius depends on the ordering in which the DE are generation order.
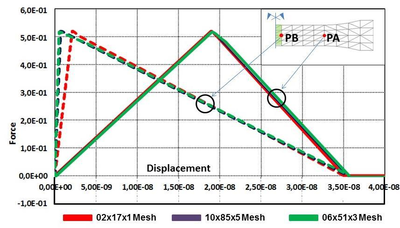
The displacement of points PA and PB are at the right and at the centre of the specimen, respectively (Figure 3) are tracked in order to evaluate the crack opening. Figure 5 shows the load-displacement relationship at these points. For the three meshes considered the displacement evolution is very similar and in agreement with the expected results [23].
|
| Figure 4: Normalized tensile test of a concrete specimen. Cracked zone with the discrete particles generated for the three finite element meshes considered. |
Since the fractured elements have a different size for each mesh, the displacement of point PB in the elastic region becomes smaller as the element size is reduced. Beacause the crack opening is a fast phenomenon, the use of an implicit integration scheme does not allow to capture properly the movement of the analysed points. However, it follows the theoretical results.
We point at the insensitivity of the force-displacement curves to the quality of the mesh. This is a distinct feature of the FEM-DEM procedure [17,18,23]
|
| Figure 5: Normalized tensile test of a concrete specimen. Load-displacement at points PA and PB of the specimen using |
3.2 Indirect tensile test
The Brazilian tensile strength (BTS) test is a very practical and simple way to evaluate the tensile strength of concrete and rock materials. The concrete sample analysed is a cylinder of diameter () and thickness (), which is a diametrically loaded by a press. The tensile strength value is computed by the following relationship [3]:
|
|
(4) |
were is the applied load.
The material properties are , , , and . This corresponds to a maximum failure load of .
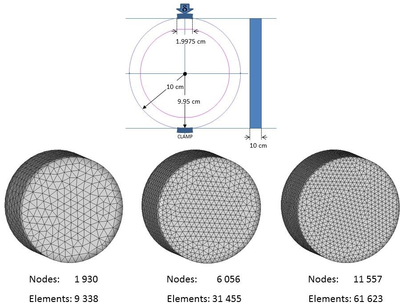
|
| Figure 6: BTS test on a concrete specimen. Dimensions, boundary conditions and finite element meshes of three noded triangles used. |
Three meshes of , and 4-noded linear tetrahedra elements each are used for the analysis, as shown in Figure 6. The sample is deformed by imposing a constant vertical velocity at the top of the sample.
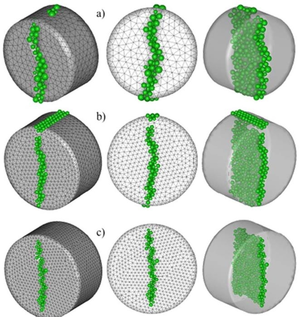
|
| Figure 7: BTS 3D test on a concrete specimen. Damage zone and discrete elements generated. a) Coarse mesh, b) intermediate mesh, c) Fine mesh. |
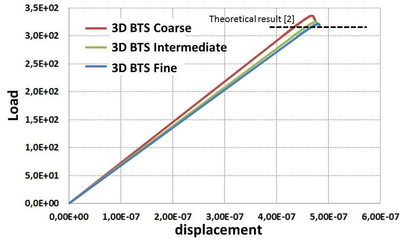
|
| Figure 8: BTS 3D test on a concrete specimen. Force-displacement relationship for the three meshes used. |
Figure 7 depicts the crack and the discrete elements generated. It can be seen that the cracking pattern is similar for the three meshes and in agreement with the expected result. The numerical results for the load-displacement curve are presented in Figure 8. The values obtained for the maximum tensile strength are of (coarse to fine) , and which yields in the range of to error versus the expected value of .
Again we note the insensitivity of the load-displacement curves to the mesh size.
3.3 Shear test
A shear test is designed to apply stress to a test sample so that it experiences a sliding failure along a plane that is parallel to the forces applied. Generally, shear forces cause one surface of a material to move in one direction and the other surface to move in the opposite direction so that the material is stressed in a sliding motion.
The procedure proposed to determine the shear resistance has been based on the shear test proposed by Luong [14]. This test consists in a circular tube of axis subjected, on its internal and external faces, to a shear stress parallel to as it is described in Figure 9 were the boundary conditions can be deduced. The height of the notch is whereas the width is . On the internal tube a constant vertical velocity of has been applied until failure.
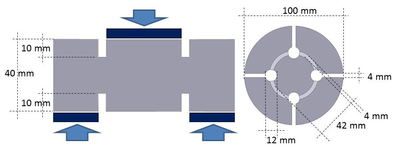
|
| Figure 9: Shear test on a concrete specimen. Geometry and boundary conditions. |
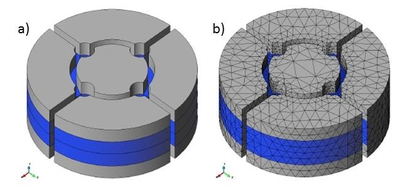
The CAD geometry and the finite element mesh can be seen in Figure 10. The shear plane has been discretized with 4-noded tetrahedral elements in order to capture properly the stress gradient at this zone.
|
| Figure 10: Shear test on a concrete specimen. a) CAD gemetry and b) finite element discrtetization. |
The material properties are , , , , and . In general, the shear strength of concrete is approximately or of the compressive stress [14].
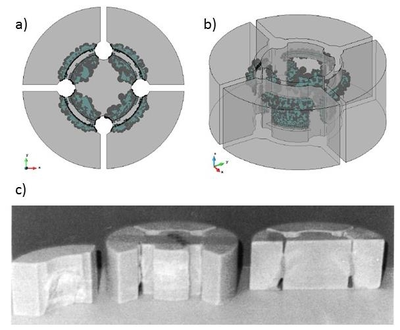
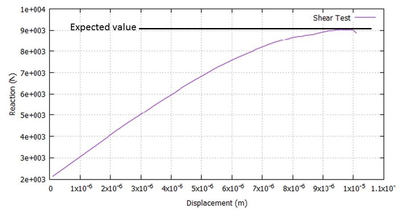
Figure 11 shows the crack obtained by the numeric experiment and compared with the restored laboratory samples [14]. Figure 12 shows the force-displacement graph of the numerical test in which the initial elastic branch is well defined until the elements starts damaging and the stiffness decreases. From this Figure and according to the sample dimensions, the computed stress level reaches a value of . The obtained result agrees in comparison with the expected value [14]. Figure 12 shows several laboratory samples, where the crack path obtained is similar to the one found using the FEM-DEM technique.
|
| Figure 11: Shear test on a concrete specimen. a) Top view and b) perspective of the crack obtained at the numeric experiment. c) Restored laboratory samples [14]. |
|
| Figure 12: Shear test on a concrete specimen. Force-displacement relationship obtained with the FEM-DEM technique. |
3.4 Earthquake analysis of cistercian church
The church belonging to the Royal Monastery of Santa Maria de Poblet, located in Vimbodí (Tarragona) is an historical artistic monument declared by UNESCO as a world heritage site. Built from the second half of the twelfth century, the temple adopts a basilical plant with its apse orientated to the East.
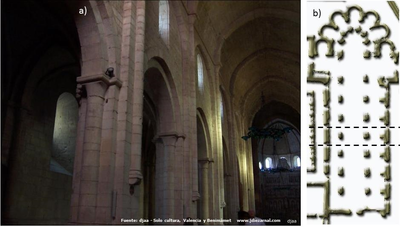
The Church is built on one nave plant and two aisles, with seven sections each. Including cruiser, central apse, abbatial chapels and ambulatory. The central nave has dimensions of long for wide and high, while the sides reach high. The height difference respect to the central nave is not solved by flying buttress of the gothic style, but with buttresses. The fully Romanesque central nave is covered with a ribbed pointed barrel vault, in each section as shown in Figure 13.
|
| Figure 13: Cistercian church at the monastery of Poblet. a) Inner view of the central nave. b) Church plant and analized section. |
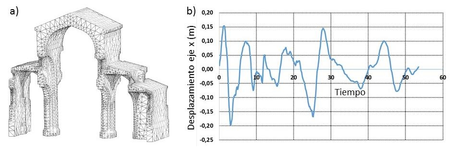
In this case the solid domain is enveloped with “invisible” DE in order to solve the FE-DE contact. For simplifying reasons, only a section of the central nave is considered. This section is symmetrical respect the normal to the central nave direction. The FEM mesh has nodes and 4-noded tetrahedra as shown in Figure 14 a). The material properties correspond to a limestone of the region, with , , , , y . We consider the church to be at its clamped foundations.
|
| Figure 14: Cistercian church at the monastery of Poblet. a) FE Mesh of the analysed section. b) Dynamic exitation expresed in displacements. |
The applied loads correspond to an imposed oscillatory movement, in the normal direction to the central nave axis as shown in Figure 14 b). The values shown correspond to the oscillatory movement in the direction of the records in displacements obtained from the accelerogram of the earthquake "El Centro" occurred on May 18, 1940 [2]. These values are applied with a reduction to the model, so that it simulates a earthquake.
|
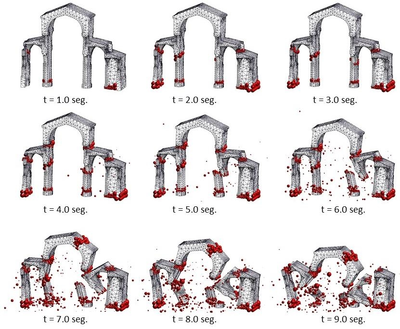
| Figure 15: Cistercian church at the monastery of Poblet. Evolution of fractures at the central section of the nave for different times. |
Although the record of movements lasts more than 50 seconds, the structure is only capable of standing on foot for 4 seconds, beyond this time the church fully collapses.
Figure 15 shows the cracks formed in the church at 1 second intervals. Initially the shear of the columns and the more rigid wall occurs, later, the arches bases are cutt off. From the second 5 it is observed how the structure fully collapses.
It is remarkable how the columns and arches of the aisles are held in place after they have been cut. This is due to the closure of the formed cracks. The FEM-DEM technique captures properly the contact between the different broken elements of the structure. The fall of these elements occurs with a rotation as can be seen along seconds 5 to 9 in Figure 15.
4 CONCLUSIONS
A simple 3D FEM-DEM methodology has been proposed for analisys of the onset and evolution of the crack path in materials and structures. Excellent results have been found for the examples presented which confirms the predictive capability of the formulation.
5 ACKNOWLEDGEMENTS
This work was partially supported by the ICEBREAKER Proof of concept project of the European Research Council.
Results presented in this work have been obtained using the FEM2DEM and DEMPACK codes of CIMNE (http://www.cimne.com/dempack) were the DEM-FEM methodology described has been implemented.
REFERENCES
[1] Astm standard d638 - 10, 2003, ”standard test method for tensile properties of plastics,” astm international, west conshohocken, pa, 2003, doi: 10.1520/d0638-10, www.astm.org.
[2] Ground accelerogram from el-centro, imperial valley irrigation district (comp s00e). http://www.eng.ucy.ac.cy/petros/earthquakes/eq1.txt.
[3] F. L. L. B. Carneiro, A new method to determine the tensile strength of concrete, Proceedings of the 5th meeting of the brazilian association for technical rules., 1943, pp. 126 –129. (In portuguese).
[4] M. Cervera, M. Chiumenti, and C. Agelet de Saracibar, Shear band localization via local j2 continuum damage mechanics, Comput. Methods Appl. Mech. Engrg. 193 (2004), 849 –880
[5] M. Cervera, M. Chiumenti, and R. Codina, Mixed stabilized finite element methods in nonlinear solid mechanics part i: Formulation., Computer Methods in Applied Mechanics and Engineering 199 (2010), 2559 –2570.
[6] Mixed stabilized finite element methods in nonlinear solid mechanics part ii: Strain localization., Computer Methods in Applied Mechanics and Engineering 199 (2010), 2571–2589.
[7] Mesh objective modelling of cracks using continuous linear strain and displacements interpolations, Int. J. Numer. Meth. Engng. 87 (2011), 962 –987.
[8] P. A. Cundall and O. D. L. Strack, A discrete numerical model for granular assemblies, Geotechnique 29 (1979), no. 1, 47 –65.
[9] P.R. Johnson, N. Petrinic, and E. Sli, Element –splitting for simulation of fracture in 3d solid continua, VIII International Conference on Computational Plasticity, Barcelona. (2005)
[10] S. Katagiri and S. Takada, Development of fem-dem combined method for fracture analysis of a continuos media, Memoirs of the Graduate School of Science and Technology, Kobe University Japan. 20A (2002 –03), 65 –79.
[11] C. Labra, Advances in the development of the discrete element method for excavation processes, Ph.D. Thesis, Barcelona, 2012.
[12] C. Labra and E. Oñate, High-density sphere packing for discrete element method simulations, Commun. Numer. Meth. Engng. 25 (2009), no. 7, 837 –849
[13] J. Lopez, S. Oller, E. Oñate, and J. Lubliner, A homogeneous constitutive model for masonry, Int. J. Numer. Meth. Engng. 46 (1999), 16511671.
[14] M. Luong, Tensile and shear strengths of concrete and rock, Engineering Fracture Mechanics 1-3 (1990), no. 35, 127–135.
[15] L. Mishnaevsky Jr, N. Lippmann, and S.; Schmauder, Computational modelling of crack propagation in real microstructures of steels and virtual testing of artificially designed materials, International Journal of Fracture 120 (2003), 581 –600.
[16] A. Munjiza, The combined finite-discrete element method, isbn 0-470-84199-0,Wiley, 2004.
[17] E. Oñate, C. Labra, Zárate F., J. Rojek, and Miquel J., Avances en el desarrollo de los mtodos de elementos discretos y de elementos finitos para el análisis de problemas de fractura, Anales de Mecánica de la Fractura 22 (2005), 27–34
[18] E. Oñate, F. Zárate, M.A. Celigueta, J.M. González, J. Miquel, J.M. Carbonell, F. Arrufat, S. Latorre, and M. Santasusana, Advances in the dem and coupled dem and fem techniques in non linear solid mechanics, Advances in computational plasticity. Oñate et al. (eds), springer, 2017
[19] E. Oñate, F. Zárate, J. Miquel, M. Santasusana, M.A. Celigueta, F. Arrufat, R. Gandijota, K. Valiullin, and L. Ring, A local constitutive model for the discrete element method. Application to geomaterials and concrete, Computational Particle Mechanics 2 (2015), 139–160
[20] J. Rojek, E.. Oñate, F. Zarate, and J. Miquel, Modelling of rock, soil and granular materials using spherical elements, 2nd European Conference on Computational Mechanics ECCM-2001, Cracow (2629 June 2001).
[21] J. Williams and R. O’Connor, Discrete element simulation and contact problem, Archives of Computer Methods in Engineering 6 (1999), no. 4, 279 –304.
[22] Shmauder S. Wulf J. and Fischmeister H.F., Finite element modelling of crack propagation in ductile fracture, Computation Materials Science 1 (1993), 297 –301.
[23] F. Zárate and E. Oñate, A simple femdem technique for fracture prediction in materials and structures, Computational particle mechanics 2 (2015), no. 3, 301–314.
[24] O.C Zienkiewicz and J.Z. Zhu, The superconvergent patch recovery (spr) and adaptive finite element refinement., Comput. Methods App. Mech. Engng. 101 (1992), 207 –224.
Document information
Published on 01/01/2018
DOI: 10.1007/s40571-017-0178-z
Licence: CC BY-NC-SA license