(Created page with " ==Abstract== Reduction in ship resistance, in order to decrease fuel consumption and also achieve higher speeds, has been the topic of major research over the last three de...") |
m (Scipediacontent moved page Draft Content 668364604 to Sayyaadi Nematollahi 2013a) |
(No difference)
| |
Latest revision as of 14:36, 6 October 2016
Abstract
Reduction in ship resistance, in order to decrease fuel consumption and also achieve higher speeds, has been the topic of major research over the last three decades. One of the most attractive ideas in this field is micro bubble drag reduction, which attempts to obtain optimum injection flow rate based on ship specifications. The model test results of a 70 cm catamaran model was used to quantify the effect of air injection rate on drag reduction, and to estimate a simple formulation for calculating an efficient injection rate by considering the main parameters of the ship, such as: length, width and speed. The test results show that excessive air injection decreases the drag reduction effect, while suitable injection reduces total drag by about 5%–8%.
Keywords
Drag reduction ; Micro bubble ; Turbulent boundary layer ; Air injection flow rate ; Experimental model test
1. Introduction
Drag is a mechanical force generated by a solid object moving through a fluid, which is usually divided into two components: frictional drag (sometimes called viscous drag) and pressure drag (sometimes called form drag). Pressure drag (i.e., form resistance) and wave resistance are frequently optimized through employing Computational Fluid Dynamics (CFD), but the other component remains constant. Over the years, many techniques have been proposed in order to reduce frictional resistance and, consequently, decrease total drag. In 1875, Froude pioneered the idea of reducing friction between water flow and a solid surface via gas injection. This concept was later patented by Laval, in 1883.
The concept of micro bubble drag reduction came into existence in its present form from the contribution of McCormick and Bhattacharyya [1] . They used a copper wire wound around a towed body of revolution to produce hydrogen bubbles by electrolysis [1] . Laboratory results of micro-bubble injection by Madavan et al. [2] showed reduction of frictional drag up to 80%, clearly a significant result in fluid mechanics [2] .
Merkle and Deutsch indicated the size of the bubbles as an alternative important parameter for drag reduction. The diameter of the bubbles affects their trajectories and, consequently, their concentration and location in the boundary layer [3] . Lattore reported the results of a two-year project (1999–2001), which focused on the development and implementation of a Micro-Bubble Drag Reduction (MBDR) system for 40–60 knot high-speed craft. These model tests showed the ability of the MBDR system in achieving an overall resistance reduction of 5%–15% [4] . Foeth et al. [5] carried out experiments on ships at model and full scale, and the results of those experiments indicated a small increase in resistance of around 1%–2% [5] .
The mechanisms by which bubbles reduce friction are not recognized correctly, and the results of scientific experiments are usually different. There has been some controversy in the literature concerning the effects of main parameters in the usage of bubbles as a drag reduction mean. Although air lubrication by bubbles can show a decrease of frictional resistance, the results are not always convincing.
For instance, Yasuhiro Moriguchi investigated some experiments to clarify the influence of bubble diameter on frictional resistance reduction. The results showed that air bubble diameter mainly depends on flow velocity at the place where air injection occurs and that micro bubble diameter has no effect on the reduction of frictional resistance. The photographic records of Eric S. Winkel et al. [6] showed that mean bubble diameter decreased monotonically with increasing salinity, and that bubble size could have a significant effect on micro bubble drag reduction [7] and [6] . Madavan et al. [2] reported that there was no difference in the effectiveness of helium and air in flat plate geometry, while Deutsch and Castano [8] have shown that helium is a more effective drag reducer than air at high stream speeds [8] .
Beyond laboratory experiments, expensive full scale tests are not always successful. For instance, in research by Kodama et al. regarding the vessel “Seiun Maru”, no considerable resistance decrease was measured in model and full-scale experiments (2002) [9] . In these experiments, only two percent decrease was observed at only a limited speed range, with an increase in required power over most of the speed range.
Some scientists believe that bubbles affect the density and viscosity of flow. Viscosity actually increases for small amounts of air, but at high Reynolds number, turbulent stress is more important than viscous stress. A decrease in density outside the viscous sub layer may be more important. Kitagawa et al. [10] found that bubbles deformed with a favorable orientation with respect to the flow, reduced turbulent stress, as the flow field around the bubble was more isotropic. Other mechanisms have also been proposed, such as compression or bubble splitting [10] , [11] and [12] .
Numerical studies of micro bubble drag reduction considering bubble dynamics are still very limited, and, unfortunately, these theories were derived by neglecting some main parameters. For instance, Moriguchi and Kato [7] assumed that the size of micro bubbles remains constant throughout the downstream boundary layer. However, individual bubble size changes, and the evolution of bubble size distribution, due to bubble coalescence and break-up mechanisms, is, thereby, neglected. It is well known that air-bubbles will merge or break-up through coalescence and break-up mechanisms. Without considering the effect of bubble dynamics, it is envisioned that constant bubble size may only be valid for problems in which the number density of micro-bubbles is considerably low. Directly adopting the model for flow problems, wherein the dispersed phase undergoes constant change in shape and size, may introduce substantial error to final predictions, especially for cases with high bubble number density, wherein the miniature distance between closely packed bubbles could dramatically exaggerate the significance of the coalescence and break-up mechanism.
Recently, Kunz et al. [13] attempted to model micro-bubble coalescence and break-up, and validated their numerical results against three sets of data; one with DNS, along with two sets of experiments [13] . From their validation study, physical models of interfacial dynamics, bubble break-up and bubble coalescence were found to play a significant role within the simulations. These studies divulged the importance of bubble break-up and coalescence and its associated bubble size evolution on overall drag reduction. Nonetheless, the bubble number density aft of the injection point considered within their model remains relatively low, where the noteworthy bubble interactions were not fully explored.
The complexity of the micro bubble drag reduction mechanism and the considerable parameters affecting it encouraged researchers to use an experimental approach, while numerous numerical studies that have been carried out to investigate the aura of micro-bubbles along the turbulent boundary layer and to fully divulge the importance of bubble dynamics in high air injection rate micro-bubble drag reduction, are still very imperfect.
Based on recent experiments, one of the most important parameters for practical usage of micro bubble drag reduction mechanisms in ship industries is to clarify the effect of injection rate on drag reduction. Also to estimate some common formula in order to achieve maximum drag reduction rate before creating expensive models or full scale tests. It is obviously necessary to discuss the net drag reduction effect by taking into account the energy needed for injecting air bubbles into water. In this paper, air injection increased as a ratio of water flow in the boundary layer. At each step, drag was recorded separately and with a common skin friction formula, a skin friction coefficient can be calculated that can be simply determined using the knowledge of only a few common characteristics of a ship, such as length, width and speed. This simple formula can help designers to calculate essential air injection flow rate and also check the efficiency of this method before doing expensive practical tests. The experimental apparatus and measurements are described in Section 2 . Section 3 introduces the analysis of injection flow rate and the optimum case. Finally, conclusions are presented in Section 4 .
2. Experimental apparatuses and tests
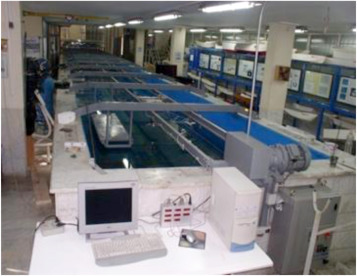
The experimental model test is a fundamental tool utilized by naval architects and other engineering professionals for conducting physical model experiments within a controlled environment. The main capabilities of a towing tank is to measure the resistance of ship hulls in order to provide powering predictions, investigate ways to reduce fuel costs and also undertake the physical modeling of various types of behavior under different sea conditions. In this case, the model is made based on scale effect and scale parameter. It is clear that one of the main applications of this method is to use and test new drag reduction ideas in practical situations, in order to check their ability and to clarify their main parameters, as ships must be designed to move efficiently through water with a minimum of external force. The experiments were done in the Center of Excellence in Hydrodynamics and Dynamics of Marine Vehicles, at the School of Mechanical Engineering, in Sharif University of Technology. This towing tank is a member of the International Towing Tank Conference (ITTC) (Figure 1 ). The specifications of this towing tank are presented in Table 1 .
|
|
|
Figure 1. Towing tank at the center of excellence in Sharif University of Technology. |
| Towing tank length (m) | 25 |
| Towing tank width (m) | 2.5 |
| Towing tank depth (m) | 1.2 |
| Towing system specification | Carriage + electromotor (4 kw) |
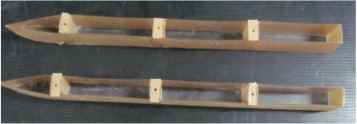
A 70 cm catamaran model has been constructed with plexiglas for experimental tests (Figure 2 ). The hull form of this model is very simple, in a spindle form with a bow and box shape in the stern region. Air injection is undertaken at three positions along the overall length of the model: fore, midship and stern regions. So, totally, the Micro Bubble Drag Reduction (MBDR) system consisted of six bottom hull injectors. These injectors were connected to an air compressor by 50 mm diameter nylon pipes.
|
|
|
Figure 2. Plexiglass catamaran model with three separate injection chambers. |
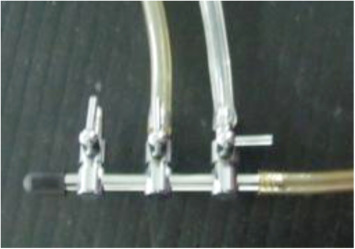
A division manifold was used to create equal air flow in each of the bottom air injectors (Figure 3 ).
|
|
|
Figure 3. The division manifold that divides the main flow in three bottom hull injectors equally. |
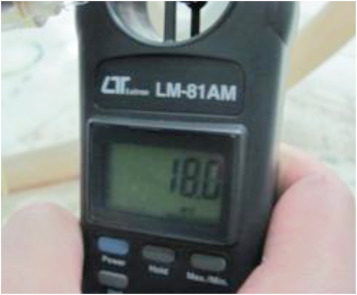
To set and control the air flow rate, an anemometer was used. This anemometer shows the speed of the injected air at a scale of meters per second. Thus, by using the anemometer and knowing the diameter of the connection pipe, the air flow rate can be controlled at each step (Figure 4 ).
|
|
|
Figure 4. The anemometer showing injection air speed in each experiment. |
In order to form bubbles around the model hull, air was injected through a plate with an array of holes (porous plate) in three positions to help the bubbles cover all regions of the model hull. The width and length of the injection plate were about 16 mm and 35 mm, respectively, and the diameter of each hole was about 1 mm. The injection plates covered the whole width of the injection area at each position, which is illustrated in Figure 5 .
|
|
|
Figure 5. Bubble injection porous at the bottom of the catamaran hull. |
The specifications of the catamaran model, such as length, width, draft, and weight and space ratio (the distance between two hulls of body ( ) to length of hull ( )), are presented in Table 2 .
| Model length | Lm= 0.707 (m) |
| Model width | Bm= 0.072 (m) |
| Draft | Tm= 0.031 (m) |
| Weight | Δm=1.84 (kg) |
| Space ratio | SL=0.28 |
3. Estimation of air injection rate
One of the most important factors in practical usage of the micro bubble method is estimation of efficient air. But, it is important to consider this parameter before performing some expensive experiments.
There is no direct established method to estimate air injection rate, but this parameter can be evaluated as indexes of boundary water flow, which can be calculated simply by considering some common turbulent fluid relations.
The injection coefficient, , is defined as the ratio of injected air flow rate divided by water flow rate within the boundary layer:
|
|
( 1) |
where is the injected air flow rate, and is the water flow rate within the boundary layer. Based on the turbulent boundary theory [14] , the water flow rate within the boundary layer of the plate can be calculated by:
|
|
( 2) |
where is the width of the plate, is flow velocity, is the boundary layer thickness, which is well-known as the distance from the wall, where the velocity is , and is displacement thickness, which is expressed as below:
|
|
( 3) |
A seventh power velocity distribution is assumed for the velocity distribution across the boundary layer:
|
|
( 5) |
is fluid velocity in the boundary layer, is the free stream fluid velocity out of the boundary layer, and is the distance from the wall.
The Schlichting boundary thickness formula is used to estimate the thickness of the boundary layer as below:
|
|
( 6) |
where:
|
|
( 7) |
is fluid velocity, is the distance from the origin of the plate and is the kinematic viscosity of the fluid.
Using Eqs. and (5) to solve Eq. (2) , the water flow rate can be calculated by:
|
|
( 8) |
In order to simplify Eq. (8) , an equivalent zero pressure-gradient is assumed at the trailing edge of the hull, so the hull length substitutes for :
|
|
( 9) |
With some mathematical simplification, Eq. (9) becomes:
|
|
( 10) |
Eq. (10) is a helpful and also simple formula, as by knowing some common parameters of the ship, such as length ( ), width ( ) and speed ( ), the boundary flow can be considered.
The injection flow rate is set as a ratio of the boundary layer of the model, and increased by a step of 0.1 at each step of the experimental test. Then, the result is compared with the simple hull resistance without any injection.
In the first step, a simple model without any injection is tested in the towing tank. Total resistance is recorded separately at each speed, which can be used for comparison with injection cases in further attempts. The total resistance of the model is presented in Table 3 .
| V (m/s) | (N) | (m2 ) | (N) | (N) | |||
|---|---|---|---|---|---|---|---|
| 0.46 | 0.20 | 0.13 | 0.0144 | 0.00612 | 0.08 | 0.11 | 0.0083 |
| 0.69 | 0.56 | 0.13 | 0.0182 | 0.00555 | 0.17 | 0.39 | 0.0127 |
| 0.92 | 0.88 | 0.13 | 0.0167 | 0.00521 | 0.28 | 0.61 | 0.0115 |
| 1.15 | 1.72 | 0.12 | 0.0211 | 0.00495 | 0.40 | 1.31 | 0.0161 |
| 1.38 | 2.31 | 0.12 | 0.0200 | 0.00476 | 0.55 | 1.76 | 0.0152 |
| 1.61 | 2.36 | 0.12 | 0.0151 | 0.00460 | 0.72 | 1.64 | 0.0105 |
| 1.73 | 2.56 | 0.12 | 0.0142 | 0.00453 | 0.81 | 1.75 | 0.0097 |
| 1.84 | 2.84 | 0.12 | 0.0139 | 0.00447 | 0.91 | 1.93 | 0.0095 |
| 2.07 | 3.19 | 0.12 | 0.0123 | 0.00436 | 1.13 | 2.06 | 0.0080 |
| 2.30 | 3.74 | 0.12 | 0.0118 | 0.00427 | 1.36 | 2.38 | 0.0075 |
| 2.53 | 4.41 | 0.12 | 0.0115 | 0.00420 | 1.61 | 2.80 | 0.0073 |
| 2.76 | 5.49 | 0.12 | 0.0120 | 0.00413 | 1.89 | 3.60 | 0.0079 |
| 2.88 | 6.38 | 0.12 | 0.0128 | 0.00411 | 2.04 | 4.34 | 0.0087 |
| 3.11 | 7.28 | 0.12 | 0.0130 | 0.0047 | 2.61 | 4.67 | 0.0083 |
| 3.53 | 8.81 | 0.12 | 0.0123 | 0.0046 | 3.29 | 5.52 | 0.0077 |
| 3.74 | 9.76 | 0.12 | 0.0121 | 0.0046 | 3.7 | 6.06 | 0.0075 |
presents the speed of the model, indicates total resistance, is the area of wetted surface, and are total, frictional and remaining resistance coefficients of the model.
Because recording data at 16 speeds, in 10 injection cases at each speed and also for repeatability (each test done 3 times), needs considerable time, only four kinds of model constant speed of 0.96, 1.76, 2.73, and 3.53 m/s were selected, and experimental measurements, with adjustable air injection flow rate, which increased by steps of 0.1, were studied.
At each stage of the experiment, the injection flow rate increased at constant speed, so the injection flow coefficient ( ) grew by steps of 0.1–1, which means that, in the final case, injection flow rate is equal to water flow in the boundary layer. This procedure is repeated for 4 sample speeds and total resistance is recorded for each experiment.
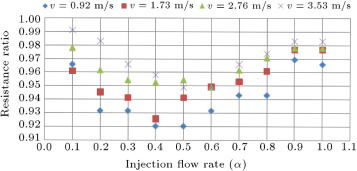
In these sample constant speeds, the plot of total resistance in the bubbly and simple case ratio (resistance ratio) versus the injection coefficient ( ) is shown in separate diagrams (Figure 6 ). It is obvious that when the resistance ratio (ratio of resistance in the bubbly case to the simple no injection case) is smaller than 1, it means that drag reduction exists.
|
|
|
Figure 6. Ratio of total resistance in simple and injection cases versus injection rate in four sample velocities. |
It must be noted that the injected bubbles are assumed to be distributed uniformly across the boundary layer, as there was no possibility for the towing tank to see the bottom of the model or the bubbles during the tests.
4. Skin friction reduction
Based on experimental results, it is assumed that the main effect of bubble injection is due to skin friction drag reduction. In order to understand and quantify this phenomenon, two main assumptions were made:
(1) The total resistance of the model consists of two main parts, skin friction and residual resistance.
(2) After bubble injection, the residual parts remains constant in comparison to the simple case (without air injection), while the wetted surface remains constant as there is no change in the model trim and draft, before or after injection.
Based on these two main assumptions, total resistance is defined as below:
|
|
( 11) |
indicates total resistance, is frictional coefficient and is residual resistance.
The non-dimensional form is shown below:
|
|
( 12) |
where, indicates total drag coefficient, is the frictional coefficient and is the residual resistance coefficient.
In the first case, where there is no injection, skin friction can be calculated with an ITTC simple equation [15] :
|
|
( 13) |
while:
|
|
( 14) |
In Eq. (14) , is fluid velocity, is ship length and is the kinematic viscosity of water.
Knowing the friction resistance coefficient and also the wetted surface area, skin friction resistance is evaluated as:
|
|
( 15) |
In this equation, is water density, is ship velocity and presents wetted surface area.
At the first step of the experiments, where injection does not exist, total resistance is resulted from experimental data. Frictional resistance is also considered by Eq. (15) , so, residual resistance can be calculated as below:
|
|
( 16) |
In this case, residual resistance coefficient can be determined by:
|
|
( 17) |
As mentioned before, this parameter is assumed to be constant in both injection and no injection situations.
In the second steps of the experimental model test, where air injection formed bubbles around the model hull, total resistance coefficient can be also determined as below:
|
|
( 18) |
In which, indicates total resistance in case of bubble injection, which was calculated from the experimental model test in the towing tank.
Based on the second terms of the assumption (residual resistance assumed to be constant in both cases of injection and no injection), the skin friction coefficient in bubble injection case is calculated simply by Eq. (19) :
|
|
( 19) |
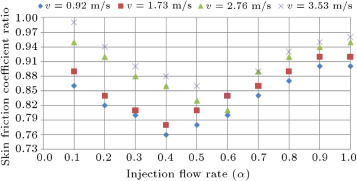
The results of these calculations are compared to the skin friction coefficient in a simple case without injection bubble (calculated by Eq. (13) ), and are presented in Figure 7 . It must be noted that the effect of injection on skin friction is higher than total resistance, as the maximum percent of reduction in this case is about 24%, which is approximately 3 times the maximum total drag reduction rate. Although the rate of skin friction reduction is higher than total resistance, the same behavior, in other words, friction coefficient, has an optimum case at an injection rate of 0.4–0.6.
|
|
|
Figure 7. Ratio of skin friction coefficient in simple and injection cases versus injection rate in four sample velocities. |
The plot of drag reduction ratio versus injection flow rate at a speed of 0.96 (m/s) is shown in Figure 6 . At this speed, maximum rate of drag reduction is about 7.95% in both injection coefficients of 0.4 and 0.5. The minimum rate of drag reduction is about 3.05% at the injection coefficient of 0.9.
It is noticeable here that the rate of drag reduction in an injection coefficient of 0.1 is equal to maximum flow rate 1. This is because excessive micro bubble injection will decay the turbulent boundary layer, and, as a result, a decrement in drag reduction effects will occur. At a speed of 1.76 (m/s), maximum reduction rate occurs at a flow rate of 0.4, and is about 7.43%. After that point, the drag reduction effect starts to decrease, although the micro bubble drag reduction effect exists. At a speed of 2.73 (m/s), maximum drag reduction was about 7.1%, and the flow rate coefficient in this case was 0.6. The maximum reduction rate at a speed of 3.53 is 5.1% at a flow rate coefficient of 0.6. The results of these case experiments are summarized in Table 4 .
| Model speed (m/s) | Maximum drag reduction (%) | Injection flow rate ( ) |
|---|---|---|
| 0.96 | 7.9 | 0.4 |
| 1.73 | 7.4 | 0.4 |
| 2.76 | 7.1 | 0.6 |
| 3.53 | 5.1 | 0.6 |
At all of the sample speeds, resistance reduction occurred, but at different rates. For the drag reduction curve under different sample speed conditions (Figure 6 ), it is obvious that at lower speeds, the maximum reduction ratio is greater. This means that the higher the speed, the lower the micro-bubble drag reduction effect. Also, it was found that whenever there is an excessive injection of flow rate micro-bubbles, there will be a piling up effect. This makes the micro bubbles accumulate and form a larger size of air cavity. Although, in general, large air cavities bring about serious drag reduction effects, it is not the case here. The ways of the air layer drag reduction mechanism and micro bubble drag reduction are different. The air cavity wants to extend its range as being as large as possible, but it is really hard to form a large scale air cavity in that situation. It is too difficult for these oversize air cavities to keep surface tension, so this factor results in collapse. After this phenomenon, it goes ahead and disturbs the current boundary layer, even to enlarge the wake range. So, it is clear that the drag reduction effect slows down with excessive injection flow.
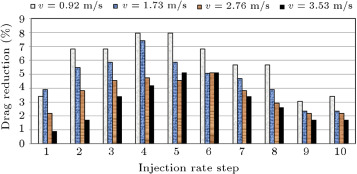
The percentage of resistance reduction versus ten steps of increasing injection flow rate ( ) (from 0.1 to 1) is presented in Figure 8 . As shown in this diagram, the maximum percent of the drag reduction effect is larger at lower injection rates. Only at a speed of 3.53 m/s is the percent of drag reduction larger at an injection ratio of 1. The reason behind this phenomenon is the effect of speed; as the speed is high, the bubbles cannot stay in the boundary layer at low injection rates, however, with higher injection rates, more bubbles remain in the boundary layer and the drag is reduced. At a speed of 0.92 m/s, the percent of drag reduction at injection rates of 0.4 and 0.5 is equal to the same happening at a speed of 3.53 m/s. That percentage of drag reduction is equal at injection rates of 0.5 and 0.6. This means that by raising speed, the injection rate must be increased, but, at the same time, it must be noted that we can use a lower injection rate, as further power can be saved in this situation.
|
|
|
Figure 8. Percent of total drag reduction versus injection rate in four sample velocities. |
The percentage of total drag reduction versus injection rate is shown in Figure 8 . It must be noted that in the left side of this diagram, the reduction effect is higher, which means that excessive flow rate reduces the efficiency of the bubble drag reduction mechanism.
5. Conclusion
Base on turbulent fluid relations, the flow rate of water within a boundary layer is obtained as a function of ordinary parameters of a ship, such as length, width and speed. Then, the injection flow rate is considered as an index of that boundary flow and is increased by steps of 0.1 at four sample constant velocities. Experiments have been performed with and without air-bubble injection using a model scale of a vessel. The result showed that the maximum rate of the drag reduction effect decreases as the speed increases. In other words, the drag reduction effect slows down at higher speeds, so, it would be more efficient to use the micro bubble drag reduction method in low speed vessels. It was also found that whenever there is an excessive supplied quantity of micro-bubbles, they will have a piling up effect. In this situation, the efficiency of the drag reduction effect decreases. So, the injection flow rate has a significant influence on the drag reduction mechanism, which should be noted by designers to achieve reduction. Experiments illustrated that in order to achieve the maximum rate of drag reduction, the injection coefficient must be set between 0.4 and 0.6, which is approximately close to the results of Lattore et al., who considered about 0.66 to be the efficient injection ratio [4] .
As shown in Figure 8 , the percentage of drag reduction is higher when the lower injection rate is fed to the system. But, it must be noted that at higher speeds, the injection flow rate must be increased, because at high speeds, bubbles are pushed out of the boundary layer, while at lower speeds, the stream can move these bubbles to whole regions of the boundary layer. Also, it was observed that excessive flow rate decays the boundary layer, while a piling up effect occurs. In fact, the small bubbles stick together and form larger bubbles and air cavities. These bubbles move along the boundary layer and bring about some hydrodynamic drag terms and other main phenomena, which are that each bubble moves in the wake of another bubble. Another reason is that as the injection rate increases, bubble size grows and probably causes breakage, which disturbs the boundary layer and also reduces the drag reduction effect, although, in this situation, the drag reduction effect still exists.
References
- [1] M.E. McCormick, R. Bhattacharyya; Drag reduction of a submersible hull by electrolysis; Nav. Eng. J., 85 (2) (1973), pp. 11–16
- [2] N.K. Madavan, S. Deutsch, C.L. Merkle; Reduction of turbulent skin friction by micro bubbles; Phys. Fluids (27) (1983), pp. 356–363
- [3] Merkle, C.L. and Deutsch, S. “Drag reduction in liquid boundary layers by gas injection”, The Smithsonian/NASA Astrophysics Data System, (A91-12688 02-34) , Washington, DC, American Institute of Aeronautics and Astronautics, Inc., 1990, pp. 351–412 (1990).
- [4] R. Latorre, A. Miller, R. Philips; Ship hull drag reduction using bottom air injection; Ocean Eng. (30) (2003), pp. 161–176
- [5] Foeth, E.J., Eggers, R. and Hourt, I. “Reduction of frictional resistance by air bubble lubrication”, SNAME Annual Meeting , Providence (2009).
- [6] E.S. Winkel, S.L. Ceccio, D.R. Dowling, M. Perlin; Bubble size distributions produced by wall-injection of air into flowing freshwater, saltwater, and surfactant solutions; Exp. Fluids (37) (2004), pp. 802–810
- [7] Y. Moriguchi, H. Kato; Influence of micro bubble diameter and distribution on frictional resistance reduction; J. Mar. Sci. Technol., 7 (2) (2002), pp. 79–85
- [8] S. Deutsch, J. Castano; Micro bubble skin friction on an axis metric body; Phys. Fluids (29) (1986), pp. 3590–3597
- [9] Y. Kodama, A. Kakugawa, T. Takahashi; A full-scale experiment on micro bubbles for skin friction reduction using Seiun–Maru, pt. 1: the preparatory study; J. Soc. Navy Architects Japan (192) (2002), pp. 1–13
- [10] Kitagawa, A., Hishida, K. and Kodama, Y. “Two phased turbulence structure in a micro bubble channel flow”, Proc. of 5th Symp. on Smart Control of Turbulence , University of Tokyo, Japan (2004).
- [11] J. Lu, A. Fernandez, G. Tryggvason; The effect of bubbles on the wall drag in a turbulent channel flow; Phys. Fluids (17) (2005), p. 095102
- [12] J.C.S. Meng, J.S. Uhlman; Micro bubble formulation and splitting in a turbulent boundary layer for turbulence reduction; Advances in Fluid Dynamics, Springer-Verlag, New York (1989), pp. 168–217
- [13] R.F. Kunz, H.J. Gibeling, M.R. Maxey, G. Tryggvason, A.A. Fontaine, H.L. Petrie, S.L. Ceccio; Validation of two-fluid Eulerian CFD modelling for microbubble drag reduction across a wide range of Reynolds numbers; J. Fluids Eng., 129 (2007), pp. 66–79
- [14] H. Schlichting; Boundary-Layer Theory; (7th Edn.)McGraw-Hill, New York (1979)
- [15] O.M. Faltinsen; Hydrodynamics of Marine High Speed Vehicle; , 0-521-84568-8Norwegian University of Science and Technology, Trondheim (2005)
Document information
Published on 06/10/16
Licence: Other
Share this document
Keywords
claim authorship
Are you one of the authors of this document?
